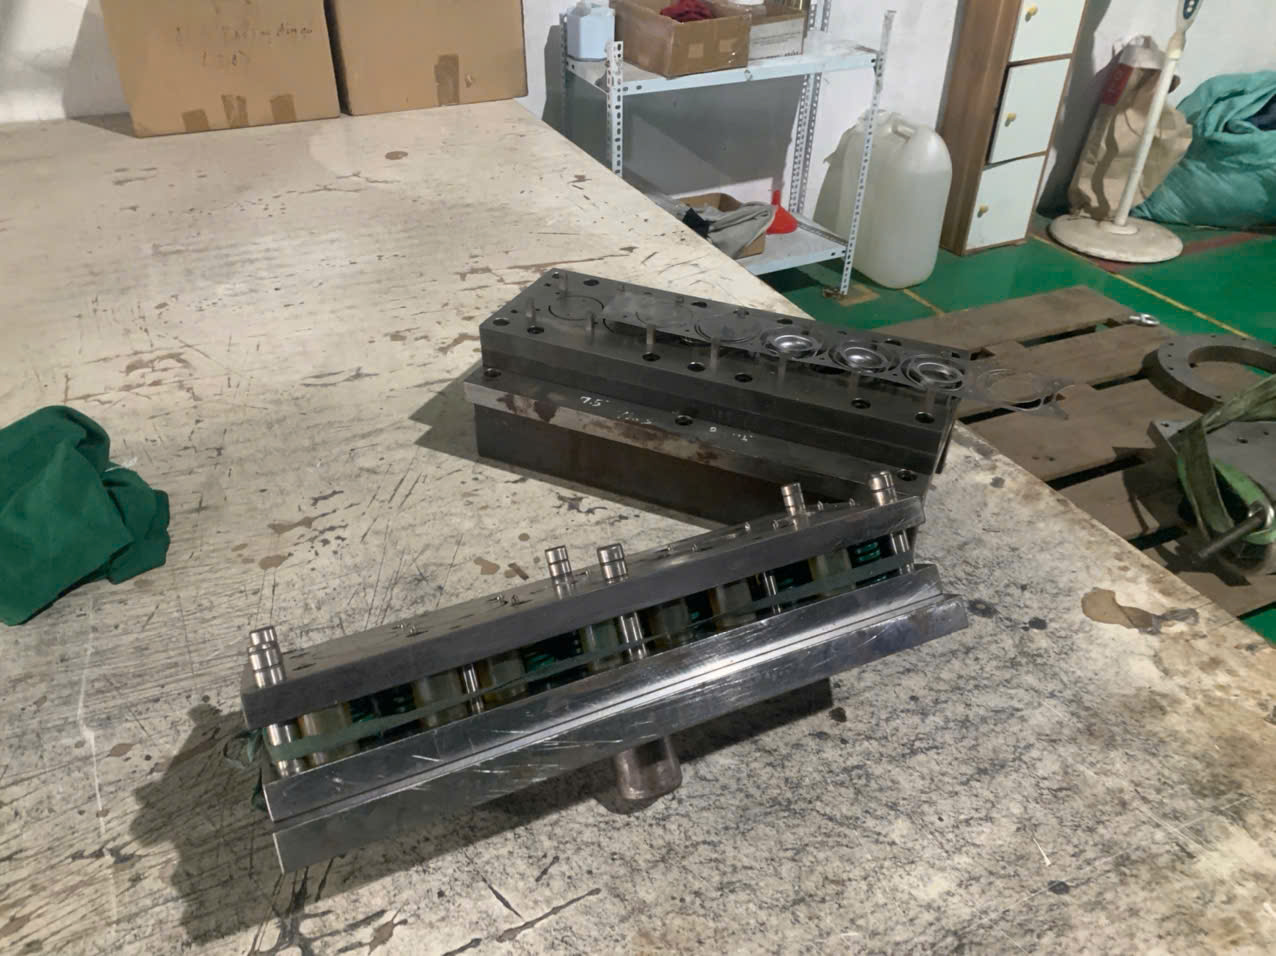
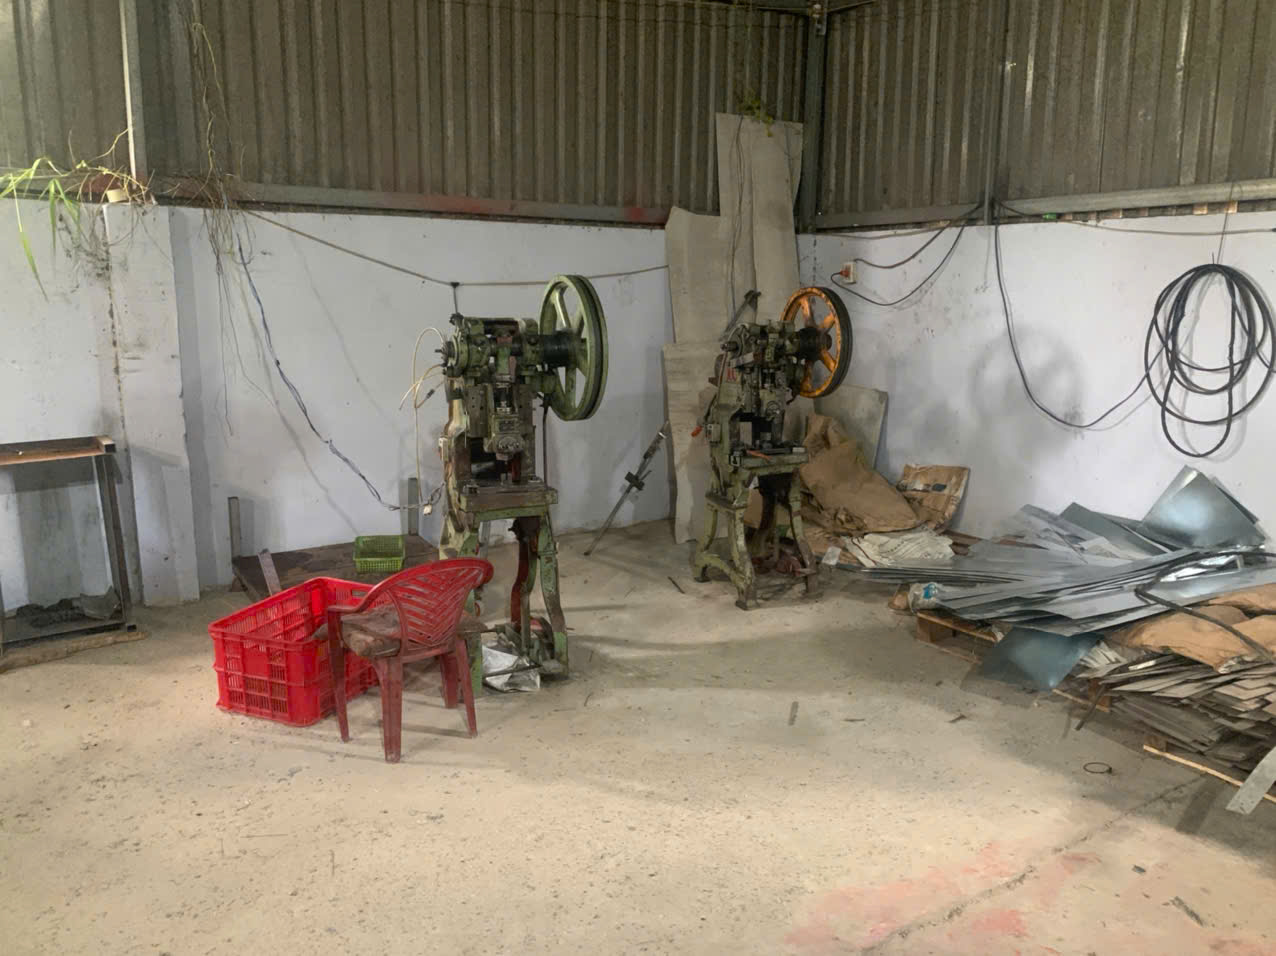
Last quarter, a delayed shipment of custom stamping brackets nearly shut down a client’s assembly line for two days—costing far more than the parts themselves were worth.
Balancing inventory holding costs against stockout risk for stamping parts requires calculating the true annual carrying cost (typically 20–30% of inventory value), quantifying production downtime costs from stockouts, then setting safety stock levels and reorder points so total combined cost is minimized.
This article walks through the math, the strategies, and the supplier-side tactics that keep your stamping parts supply chain both lean and resilient Economic Order Quantity formula 1. Whether you source mounting clips, formed brackets, or custom sheet-metal components, the framework below applies directly to your purchasing decisions.
How do I calculate the true holding cost of stamping parts inventory?
A buyer we work with in the Midwest once told me his company had been estimating holding costs at a flat ten percent for years—until a product-line redesign made half his custom bracket inventory obsolete overnight.
The true holding cost of stamping parts inventory includes capital cost, warehousing, insurance, taxes, handling, and obsolescence risk. For most manufacturers, the total annual carrying cost rate falls between 20% and 30% of the inventory's purchase value.
Breaking Down the Cost Components
Holding cost is not one number. It is a stack of costs that compound quietly. Here is a breakdown of each element and how it applies specifically to stamping parts like mounting brackets, clips, and formed sheet-metal components.
Capital cost is the largest slice. Every dollar tied up in stamping parts sitting on a shelf is a dollar that cannot fund new tooling, pay suppliers early for discounts, or earn a return elsewhere. If your cost of capital is 10%, that is 10 cents per dollar of inventory per year doing nothing for you.
Warehousing and handling includes rent, utilities, labor to receive and pick parts, and the racking or bin systems to store them. Stamping parts with sharp edges or complex geometry sometimes need custom packaging or dividers to prevent nesting and damage, adding cost.
Insurance and taxes are often overlooked. Property taxes on inventory exist in many U.S. states. Insurance premiums scale with the total value stored.
Obsolescence risk is the silent killer for custom stamping parts. Unlike standard fasteners, a custom-formed bracket is designed for one assembly. If the end product is redesigned or discontinued, that inventory becomes scrap metal. In our experience managing supply chains for U.S. clients, we have seen obsolescence alone push the effective holding rate above 30% for short-lifecycle products.
A Practical Holding Cost Table
| Cost Component | Typical Range (% of Inventory Value/Year) | Notes for Stamping Parts |
|---|---|---|
| Cost of Capital | 8–15% | Opportunity cost of tied-up funds |
| Warehousing & Handling | 3–6% | Custom packaging may increase this |
| Insurance | 1–3% | Scales with total stored value |
| Property Taxes | 1–2% | Varies by U.S. state |
| Obsolescence & Shrinkage | 3–8% | Higher for custom or short-run parts |
| Total Holding Cost Rate | 20–30% | Use your own data to refine |
How to Apply the Rate
Multiply the per-unit purchase price of the stamping part by your total holding cost rate. That gives you the annual cost to hold one unit.
For example, a custom stainless steel mounting clip costs $2.50 per piece. At a 25% holding rate, each clip costs $0.625 per year just to sit in your warehouse. If you hold 10,000 of them, that is $6,250 per year in carrying cost alone—before you consider the risk of a design change making them worthless.
This number feeds directly into your Economic Order Quantity formula 2 and your safety stock calculation. Without an accurate holding cost, every downstream decision is built on a shaky foundation.
What safety stock level protects me from stockouts without overstocking?
During a recent project sourcing zinc-coated stamping brackets from Vietnam for a U.S. distributor, we discovered that lead time variability—not average demand—was the main driver behind their chronic stockout problem.
Safety stock should be calculated using the formula: Safety Stock = z × σ_L, where z is the service level factor and σ_L is the standard deviation of demand during lead time. The right level depends on your acceptable stockout probability and the true cost of production downtime versus holding cost.
Understanding the Variables
The safety stock calculation has two inputs you control and one you estimate.
Service level (z-factor): This is how confident you want to be that stock will cover demand during a replenishment cycle. A 95% service level 3 uses a z-factor of 1.65. A 99% level uses 2.33. The higher you go, the more buffer stock you hold—and the more you pay in carrying costs.
Standard deviation of demand during lead time (σ_L): This captures the combined variability of both your demand fluctuations and your supplier's lead time inconsistency. For stamping parts, lead time variability tends to be the dominant factor because tooling maintenance, raw material delays, and quality holds can cause large swings.
Choosing the Right Service Level
The decision comes down to comparing production downtime costs against holding costs. Here is a framework I use when advising our clients.
| Scenario | Recommended Service Level | z-Factor | Rationale |
|---|---|---|---|
| Part is used on a high-volume assembly line | 97–99% | 1.88–2.33 | Downtime cost per hour far exceeds holding cost |
| Part is used in batch production with flexible scheduling | 90–95% | 1.28–1.65 | Some delay is tolerable; optimize for cost |
| Part is a low-cost commodity with multiple suppliers | 85–90% | 1.04–1.28 | Easy to expedite; low stockout penalty |
| Part is custom with a single-source supplier | 97–99% | 1.88–2.33 | No alternative source; stockout means full stop |
A Worked Example
Consider a galvanized steel mounting bracket used on an assembly line producing 200 units per hour, with each unit worth $50 in production value.
- Average demand during lead time: 5,000 pieces
- Standard deviation during lead time: 800 pieces
- Target service level: 97.5% (z = 1.96)
- Safety stock = 1.96 × 800 = 1,568 pieces
- Holding cost per piece per year = $1.80 × 25% = $0.45
- Annual safety stock holding cost = 1,568 × $0.45 = $705.60
Now, the cost of a single stockout event: the line runs $10,000 per hour in production value. If the bracket runs out and it takes 8 hours to get emergency stock, that is $80,000 in lost output. Compared to $706 per year in safety stock cost, the math is clear. Service level optimization here strongly favors the buffer.
ABC Analysis for Prioritization
Not every stamping part deserves the same treatment. Apply ABC analysis 4 to sort your parts.
- A-items (top 20% by value or criticality): High safety stock, tight monitoring, frequent review.
- B-items (next 30%): Moderate safety stock, periodic review.
- C-items (bottom 50%): Minimal safety stock, simplified reorder rules.
This approach avoids the trap of applying a blanket service level to every SKU, which either under-protects critical parts or over-invests in low-risk ones. Demand forecasting models 5 become more practical when you focus your best data and analysis on the A-items rather than spreading effort thin across hundreds of SKUs.
How can I use supplier lead time data to set reorder points for stamping parts?
One lesson our team learned early when coordinating production between Vietnamese stamping shops and U.S. warehouses: the average lead time your supplier quotes is almost never the number you should plan around.
To set accurate reorder points, use the formula ROP = (average daily demand × average lead time) + safety stock. Collect actual historical lead time data from your supplier—not just quoted lead times—and factor in the standard deviation to capture real-world variability in your calculations.
Why Quoted Lead Times Are Misleading
Suppliers quote their best-case or average lead time. But your reorder point must protect you against the worst realistic cases. If a supplier quotes four weeks but occasionally delivers in six due to raw material shortages or die maintenance, that two-week gap is where stockouts happen.
We track actual delivery dates against promised dates for every shipment we manage. This gives us a distribution—not just an average. That distribution is what drives the σ_L term in your safety stock and reorder point formulas. Lead time variability is the data most procurement teams lack, and it is the data that matters most.
Building the Reorder Point Step by Step
Here is a practical process any purchasing manager can follow:
-
Gather historical data. Collect the last 12–24 months of actual receipt dates for each stamping part from your supplier.
-
Calculate average lead time. Sum all lead times and divide by the number of orders. This is your μ_LT.
-
Calculate lead time standard deviation. This measures how much your supplier's delivery varies. Call this σ_LT.
-
Determine average daily demand (d̄) from your consumption records.
-
Calculate demand variability (σ_d) from your daily or weekly usage records.
-
Combine into the ROP formula:
ROP = (d̄ × μ_LT) + z × √(μ_LT × σ_d² + d̄² × σ_LT²)
The second term is your safety stock, accounting for both demand and lead time uncertainty simultaneously.
Impact of Lead Time Variability on Reorder Point
| Supplier Lead Time Profile | Avg Lead Time (days) | Std Dev (days) | ROP at 95% Service (d̄ = 100/day, σ_d = 15) | Safety Stock Portion |
|---|---|---|---|---|
| Very Consistent Supplier | 21 | 2 | 2,658 | 558 |
| Moderately Variable Supplier | 21 | 5 | 2,952 | 852 |
| Highly Variable Supplier | 21 | 10 | 3,559 | 1,459 |
The table above shows how the same average lead time leads to dramatically different reorder points 6 depending on variability. A highly variable supplier forces you to hold nearly three times the safety stock of a consistent one. This is why supply chain resilience starts with supplier selection—not just inventory math.
Practical Tips for Better Lead Time Data
- Ask your supplier for a shipment log, not just a quoted lead time.
- Track the gap between your purchase order date and the date goods arrive at your dock.
- Separate lead time into production lead time 7 and transit lead time. You may find that ocean freight variability matters more than factory output timing.
- Review and update your ROP quarterly. Seasonal demand shifts and raw material market changes will move both d̄ and σ_LT over time.
In our work coordinating door-to-door logistics from Asia to the U.S., we have found that investing in accurate lead time tracking reduces the need for excess safety stock far more effectively than simply ordering larger quantities. Your inventory turnover ratio 8 improves when your reorder point is calibrated to real data instead of guesswork.
Should I negotiate consignment or VMI terms with my stamping parts supplier to reduce risk?
A client in Ohio once asked me whether consignment inventory was "too good to be true." He was paying 25% annually to hold safety stock of custom stamping clips, and his supplier had offered to own that inventory until he pulled it.
Yes, negotiating consignment or Vendor Managed Inventory (VMI) terms can significantly reduce your holding cost burden and stockout risk simultaneously. The supplier retains ownership of buffer stock until consumption, shifting capital and obsolescence costs while keeping parts available at your facility or a nearby warehouse.
How Consignment and VMI Differ
These two models are related but distinct. Understanding the difference helps you negotiate the right arrangement.
Consignment inventory means the supplier places stock at your location (or a third-party warehouse), but retains ownership. You pay only when you consume parts. The supplier bears the capital cost and obsolescence risk until pull-through.
Vendor Managed Inventory (VMI) goes a step further. The supplier monitors your inventory levels—often through shared data or system integration—and decides when and how much to replenish. Vendor Managed Inventory 9 You set the min/max parameters. The supplier manages the execution.
Comparing Inventory Models for Stamping Parts
| Factor | Traditional Buy-and-Hold | Consignment | VMI |
|---|---|---|---|
| Who owns inventory at your site? | You | Supplier | Supplier (usually) |
| Who decides reorder timing? | You | You | Supplier |
| Capital cost borne by | You | Supplier | Supplier |
| Obsolescence risk borne by | You | Supplier (negotiable) | Supplier (negotiable) |
| Your administrative burden | High | Medium | Low |
| Supplier willingness (typical) | Always | Selective | Selective |
| Best suited for | Low-trust or new relationships | Established relationships, high-value parts | High-volume, repetitive parts |
When Consignment or VMI Makes Sense
Not every stamping part qualifies for these arrangements. Suppliers agree to consignment or VMI when the relationship justifies the investment. High-volume, repetitive parts like standard mounting brackets or clips are the easiest to get on consignment because the supplier can forecast your pull-through with reasonable confidence.
Custom, low-volume, or prototype-stage parts are harder. The supplier's obsolescence risk is too high if your demand is uncertain. In these cases, a hybrid approach works: consignment for your high-runners (A-items) and traditional purchase orders for specialty parts.
Negotiation Tactics That Work
From our experience managing supplier relationships across Vietnam and other Asian sourcing markets, here are practical negotiation strategies:
- Share your demand forecast. Suppliers agree to hold inventory when they trust your consumption projections. Transparent data builds trust—87% of distributors report that data sharing strengthens supplier partnerships.
- Offer longer-term contracts. A 12- or 24-month agreement gives the supplier volume certainty, which offsets the risk of holding consignment stock.
- Define clear obsolescence rules. Agree upfront on who pays if parts become obsolete. A common split: you cover obsolescence if the design change originates on your side; the supplier covers it if their quality or process creates the issue.
- Start small. Pilot consignment with two or three high-volume SKUs. Prove the model before scaling.
The Cash Flow Advantage
For purchasing managers working with 60–90 day payment terms, consignment extends the effective payment window even further. You do not pay until you use the part. This frees working capital for other priorities. It also aligns well with Just-in-Time manufacturing 10 philosophies—parts are there when you need them, but your balance sheet stays lean.
The trade-off is that consignment parts sometimes carry a slightly higher unit price. The supplier builds their carrying cost into the piece price. Run the numbers: if the total cost (piece price + reduced holding cost + reduced stockout risk) is lower than your current model, consignment wins. If not, stick with traditional ordering and invest in better demand forecasting models and tighter reorder point discipline.
Conclusion
Balancing inventory holding costs against stockout risk for stamping parts is not about picking one extreme. It is about calculating your true costs, setting data-driven reorder points, and leveraging supplier partnerships to share the burden intelligently.
Frequently Asked Questions
How do I calculate the true holding cost of stamping parts inventory?
A buyer we work with in the Midwest once told me his company had been estimating holding costs at a flat ten percent for years—until a product-line redesign made half his custom bracket inventory obsolete overnight.
What safety stock level protects me from stockouts without overstocking?
During a recent project sourcing zinc-coated stamping brackets from Vietnam for a U.S. distributor, we discovered that lead time variability—not average demand—was the main driver behind their chronic stockout problem.
How can I use supplier lead time data to set reorder points for stamping parts?
One lesson our team learned early when coordinating production between Vietnamese stamping shops and U.S. warehouses: the average lead time your supplier quotes is almost never the number you should plan around.
Footnotes
1. Describes the mathematical model used to determine the ideal order quantity that minimizes total inventory costs. ↩︎
2. Explains the standard inventory optimization model referenced for balancing ordering and holding costs. ↩︎
3. Defines the performance measure used to determine the probability of meeting customer demand. ↩︎
4. Provides background on the inventory prioritization method described for sorting stamping parts. ↩︎
5. Provides context on forecasting methods that support safety stock and reorder point decisions. ↩︎
6. Explains the inventory level that triggers an action to replenish that particular stock item. ↩︎
7. Defines the period between the initiation and completion of a production process. ↩︎
8. Explains the financial metric used to assess reorder point calibration effectiveness. ↩︎
9. Defines the supplier-managed replenishment model discussed as an alternative to traditional ordering. ↩︎
10. Defines the production philosophy mentioned as aligning with consignment inventory strategies. ↩︎