
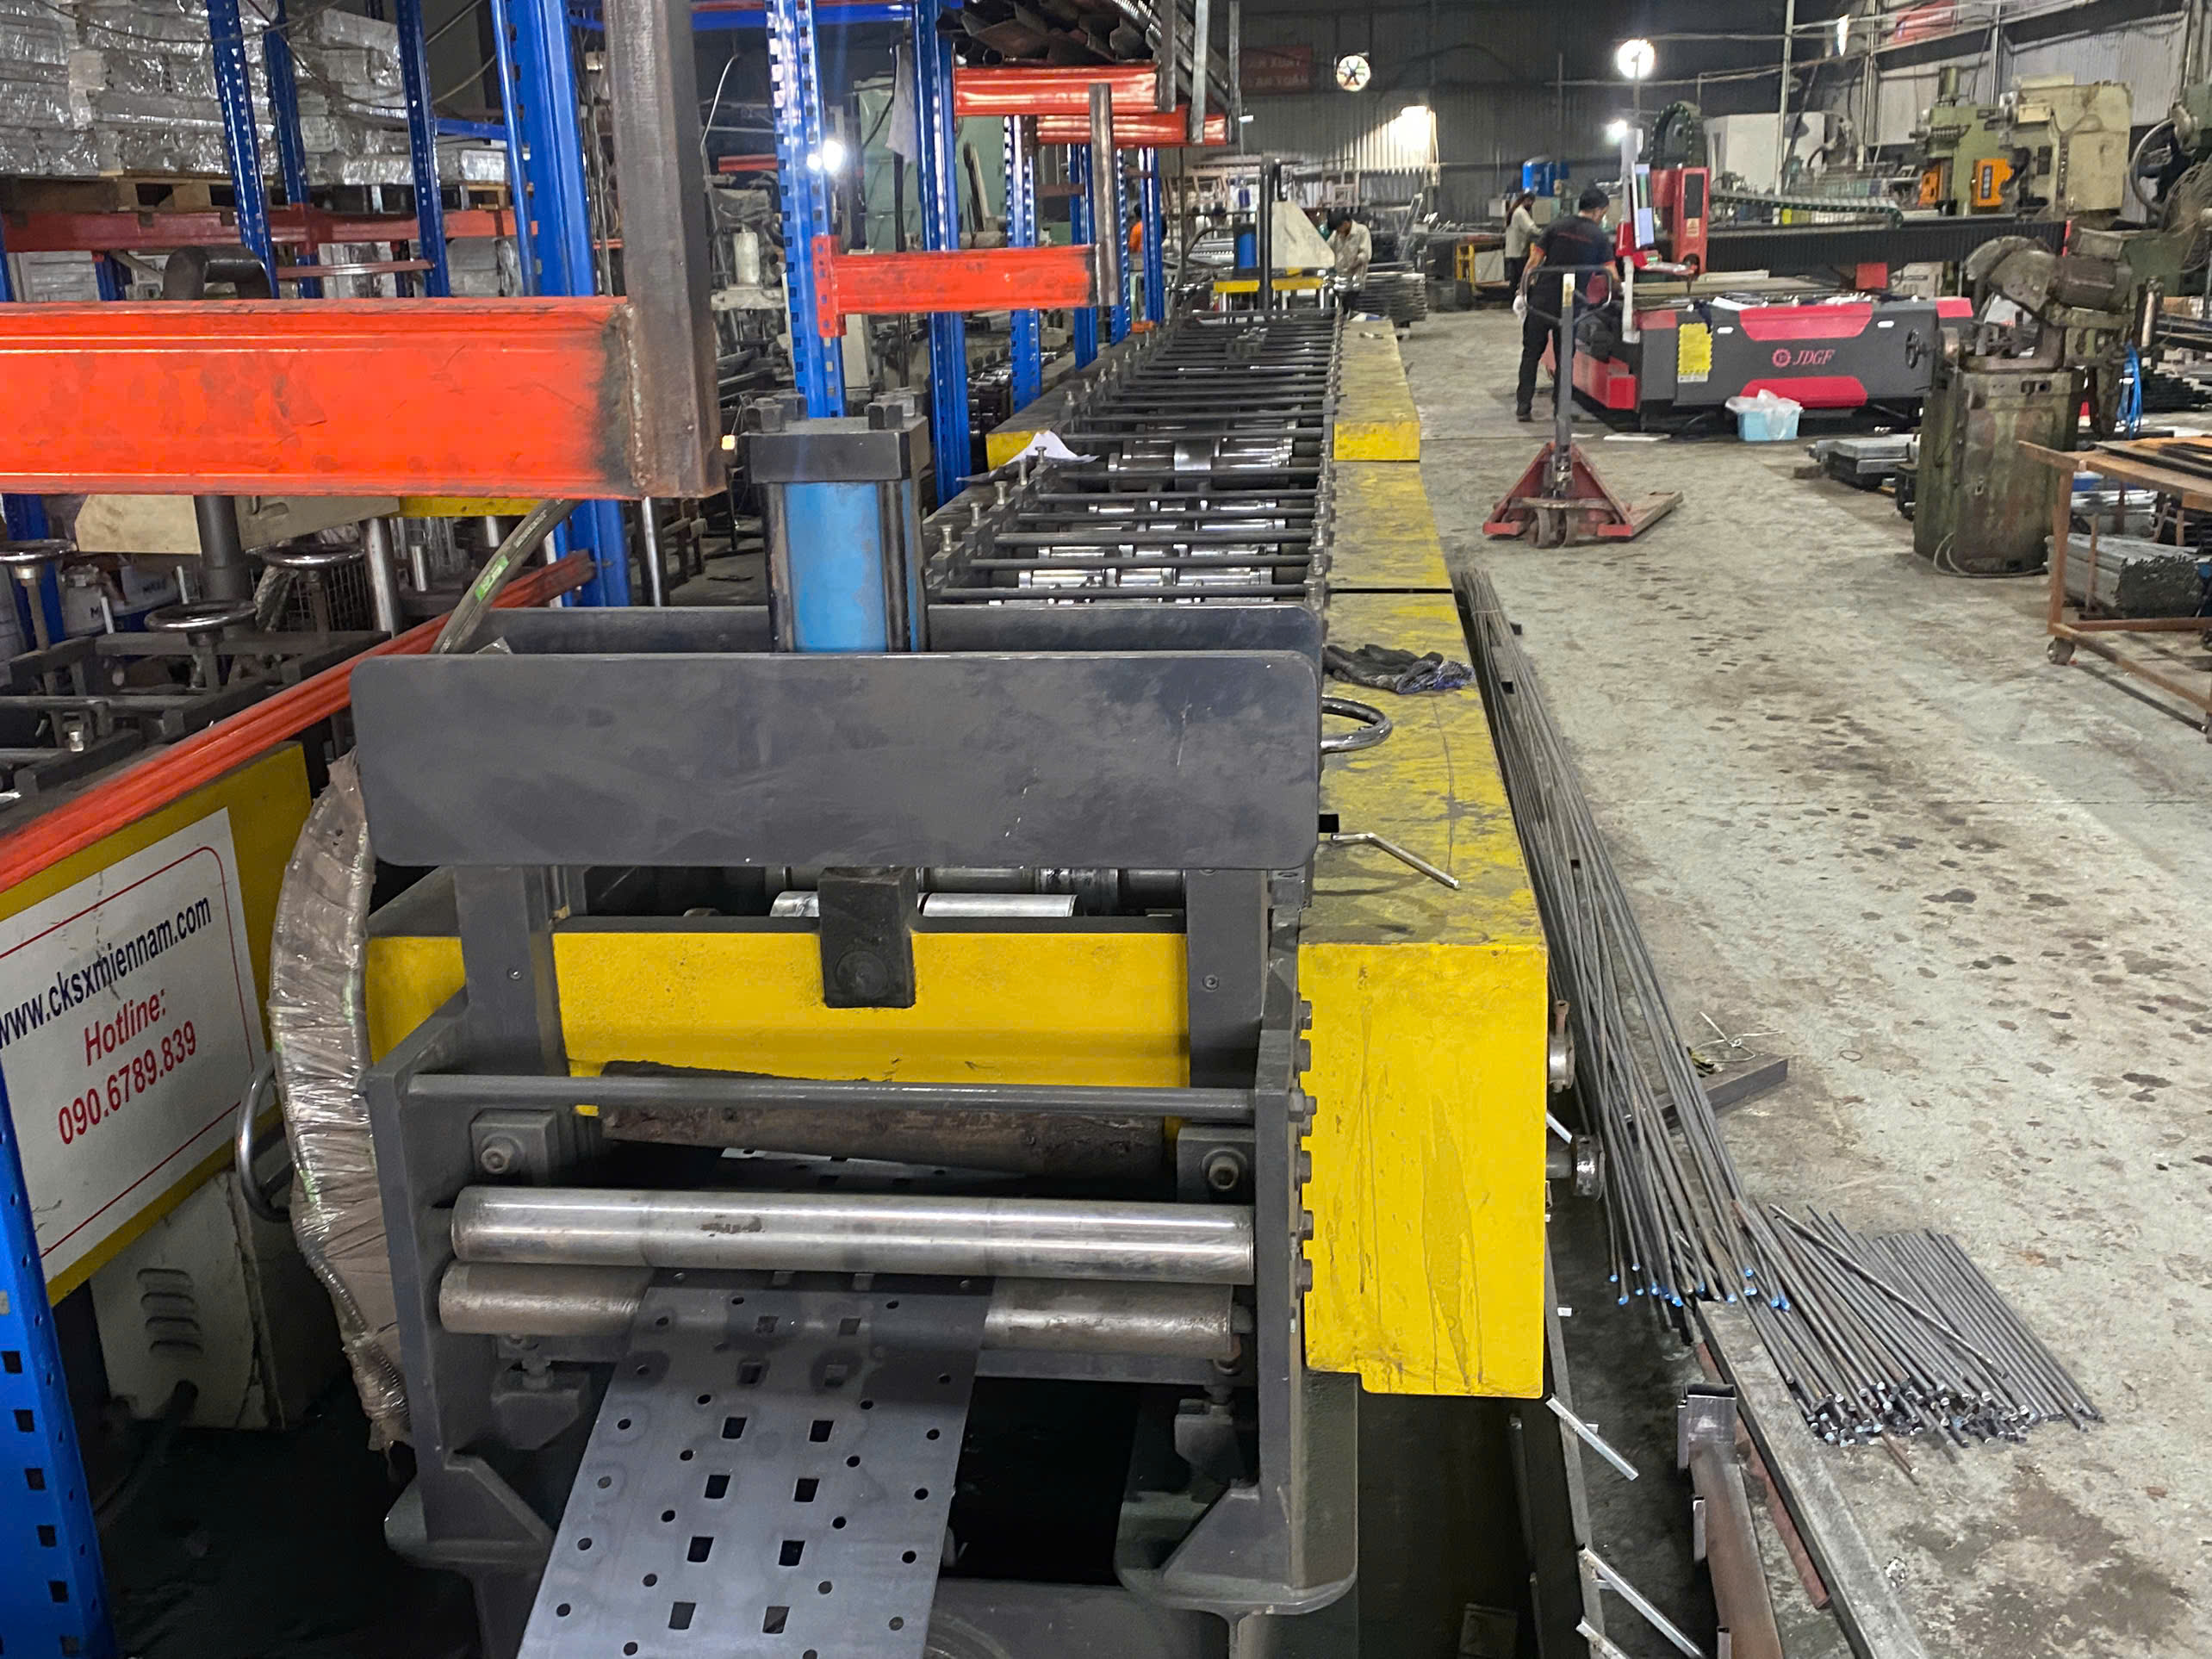
A supplier scorecard for stamping parts procurement 1 can save your production line—or sink it. I learned this the hard way when a bracket supplier’s tooling wore out mid-run, and we had no system to flag the warning signs. The dimensional accuracy 2 drifted, scrap rates climbed, and our U.S. client’s assembly line almost stopped. That crisis taught our team at DEWIN that generic supplier evaluation forms 3 simply do not work for stamping. The tolerances are tighter, the tooling demands are unique, and the cost of poor quality compounds fast across high-volume orders. You need a scorecard built specifically for the realities of metal stamping procurement.
To build a supplier scorecard for stamping parts procurement, define stamping-specific objectives, select 5–7 key performance metrics including PPM defect rate and on-time delivery, assign weighted scores by category, collect data from ERP systems and stakeholder feedback, and review results on a regular cadence to drive corrective actions and sourcing decisions.
Below, I will walk through the exact metrics, weighting methods, tools, and review cadences we use to evaluate stamping suppliers across Vietnam and other Asian sourcing regions. Each section gives you practical steps you can apply immediately.
What Metrics Should I Include in My Stamping Supplier Scorecard?
When we onboard a new stamping supplier in Vietnam or Taiwan, the first question our quality engineers ask is: "What exactly are we measuring, and does it match what can go wrong with stamped parts?" That distinction matters because stamping failures—die wear, burr formation, dimensional drift—are different from machining or casting failures.
A stamping supplier scorecard should include parts per million (PPM) defect rate, on-time delivery (OTD), first pass yield, tooling life cycle management metrics, total cost of ownership, corrective action responsiveness, and compliance with certifications like IATF 16949 or ISO 9001.

Selecting the right quality performance metrics is the foundation. Too few, and you miss critical signals. Too many, and the scorecard becomes noise. I recommend organizing your KPIs into five pillars, then choosing one or two metrics per pillar.
The Five Pillars for Stamping KPIs
| Pillar | Stamping-Specific KPI | Why It Matters |
|---|---|---|
| Quality | PPM Defect Rate 4 | Measures non-conforming units per million; the primary gauge of stamping precision |
| Quality | First Pass Yield | Shows what percentage of parts pass inspection without rework |
| Quality | Dimensional Compliance 5 | Tracks adherence to CAD tolerances (e.g., ±0.005") |
| Delivery | On-Time Delivery (OTD) | Percentage of shipments arriving within the agreed window |
| Delivery | Lead Time Variability | Deviation between quoted and actual lead times |
| Cost | Total Cost of Ownership (TCO) | Includes unit price, freight, inspection costs, scrap handling, and COPQ |
| Service | Corrective Action Responsiveness | Speed and effectiveness of closing non-conformance reports |
| Service | Tooling Maintenance Turnaround | Time to repair or replace worn dies |
| Compliance | Certification Status | Valid ISO 9001, IATF 16949, or industry-specific certs |
| Compliance | Material Traceability | Ability to trace steel coils or aluminum sheet back to the mill |
Quality Metrics in Detail
Parts per million defect rate is non-negotiable. For automotive stamping, targets often sit below 50 PPM. For general industrial brackets and clips—like the mounting hardware our clients frequently order—we typically target below 100 PPM. First pass yield tells you how efficient the supplier's process really is. If they rework 15% of parts before shipping, that hidden cost shows up in lead time variability and in your cost of poor quality.
Dimensional accuracy deserves its own tracking column. Stamped parts with tight bend tolerances can drift as the die wears. We ask suppliers to report stroke counts alongside inspection data so we can correlate tooling life cycle management with quality trends.
Delivery and Service Metrics
On-time delivery is straightforward to measure, but the devil is in the definition. Does "on time" mean the date the supplier ships, or the date parts arrive at your dock? We define OTD as the dock-receipt date. Lead time variability captures consistency. A supplier who quotes four weeks but delivers anywhere between three and six weeks creates planning chaos.
For service, corrective action reports 6 deserve a dedicated metric. We track how many days a supplier takes to respond with a root-cause analysis after we issue a non-conformance report. Anything over five business days raises a flag in our system.
How Do I Weight Quality, Delivery, and Cost When Scoring Stamping Suppliers?
One trade-off our procurement team debates regularly is how much weight to give delivery versus quality. A supplier with flawless parts but chronic late shipments still shuts down a production line. Conversely, a supplier who always delivers on time but ships borderline parts creates rework nightmares downstream.
For stamping parts, weight quality and delivery highest—typically 25–40% each—followed by cost at 15–20%, service and tooling responsiveness at 10–15%, and compliance at 5–10%. Adjust weights based on supplier tier: strategic suppliers warrant heavier quality weights, while transactional suppliers may emphasize cost.
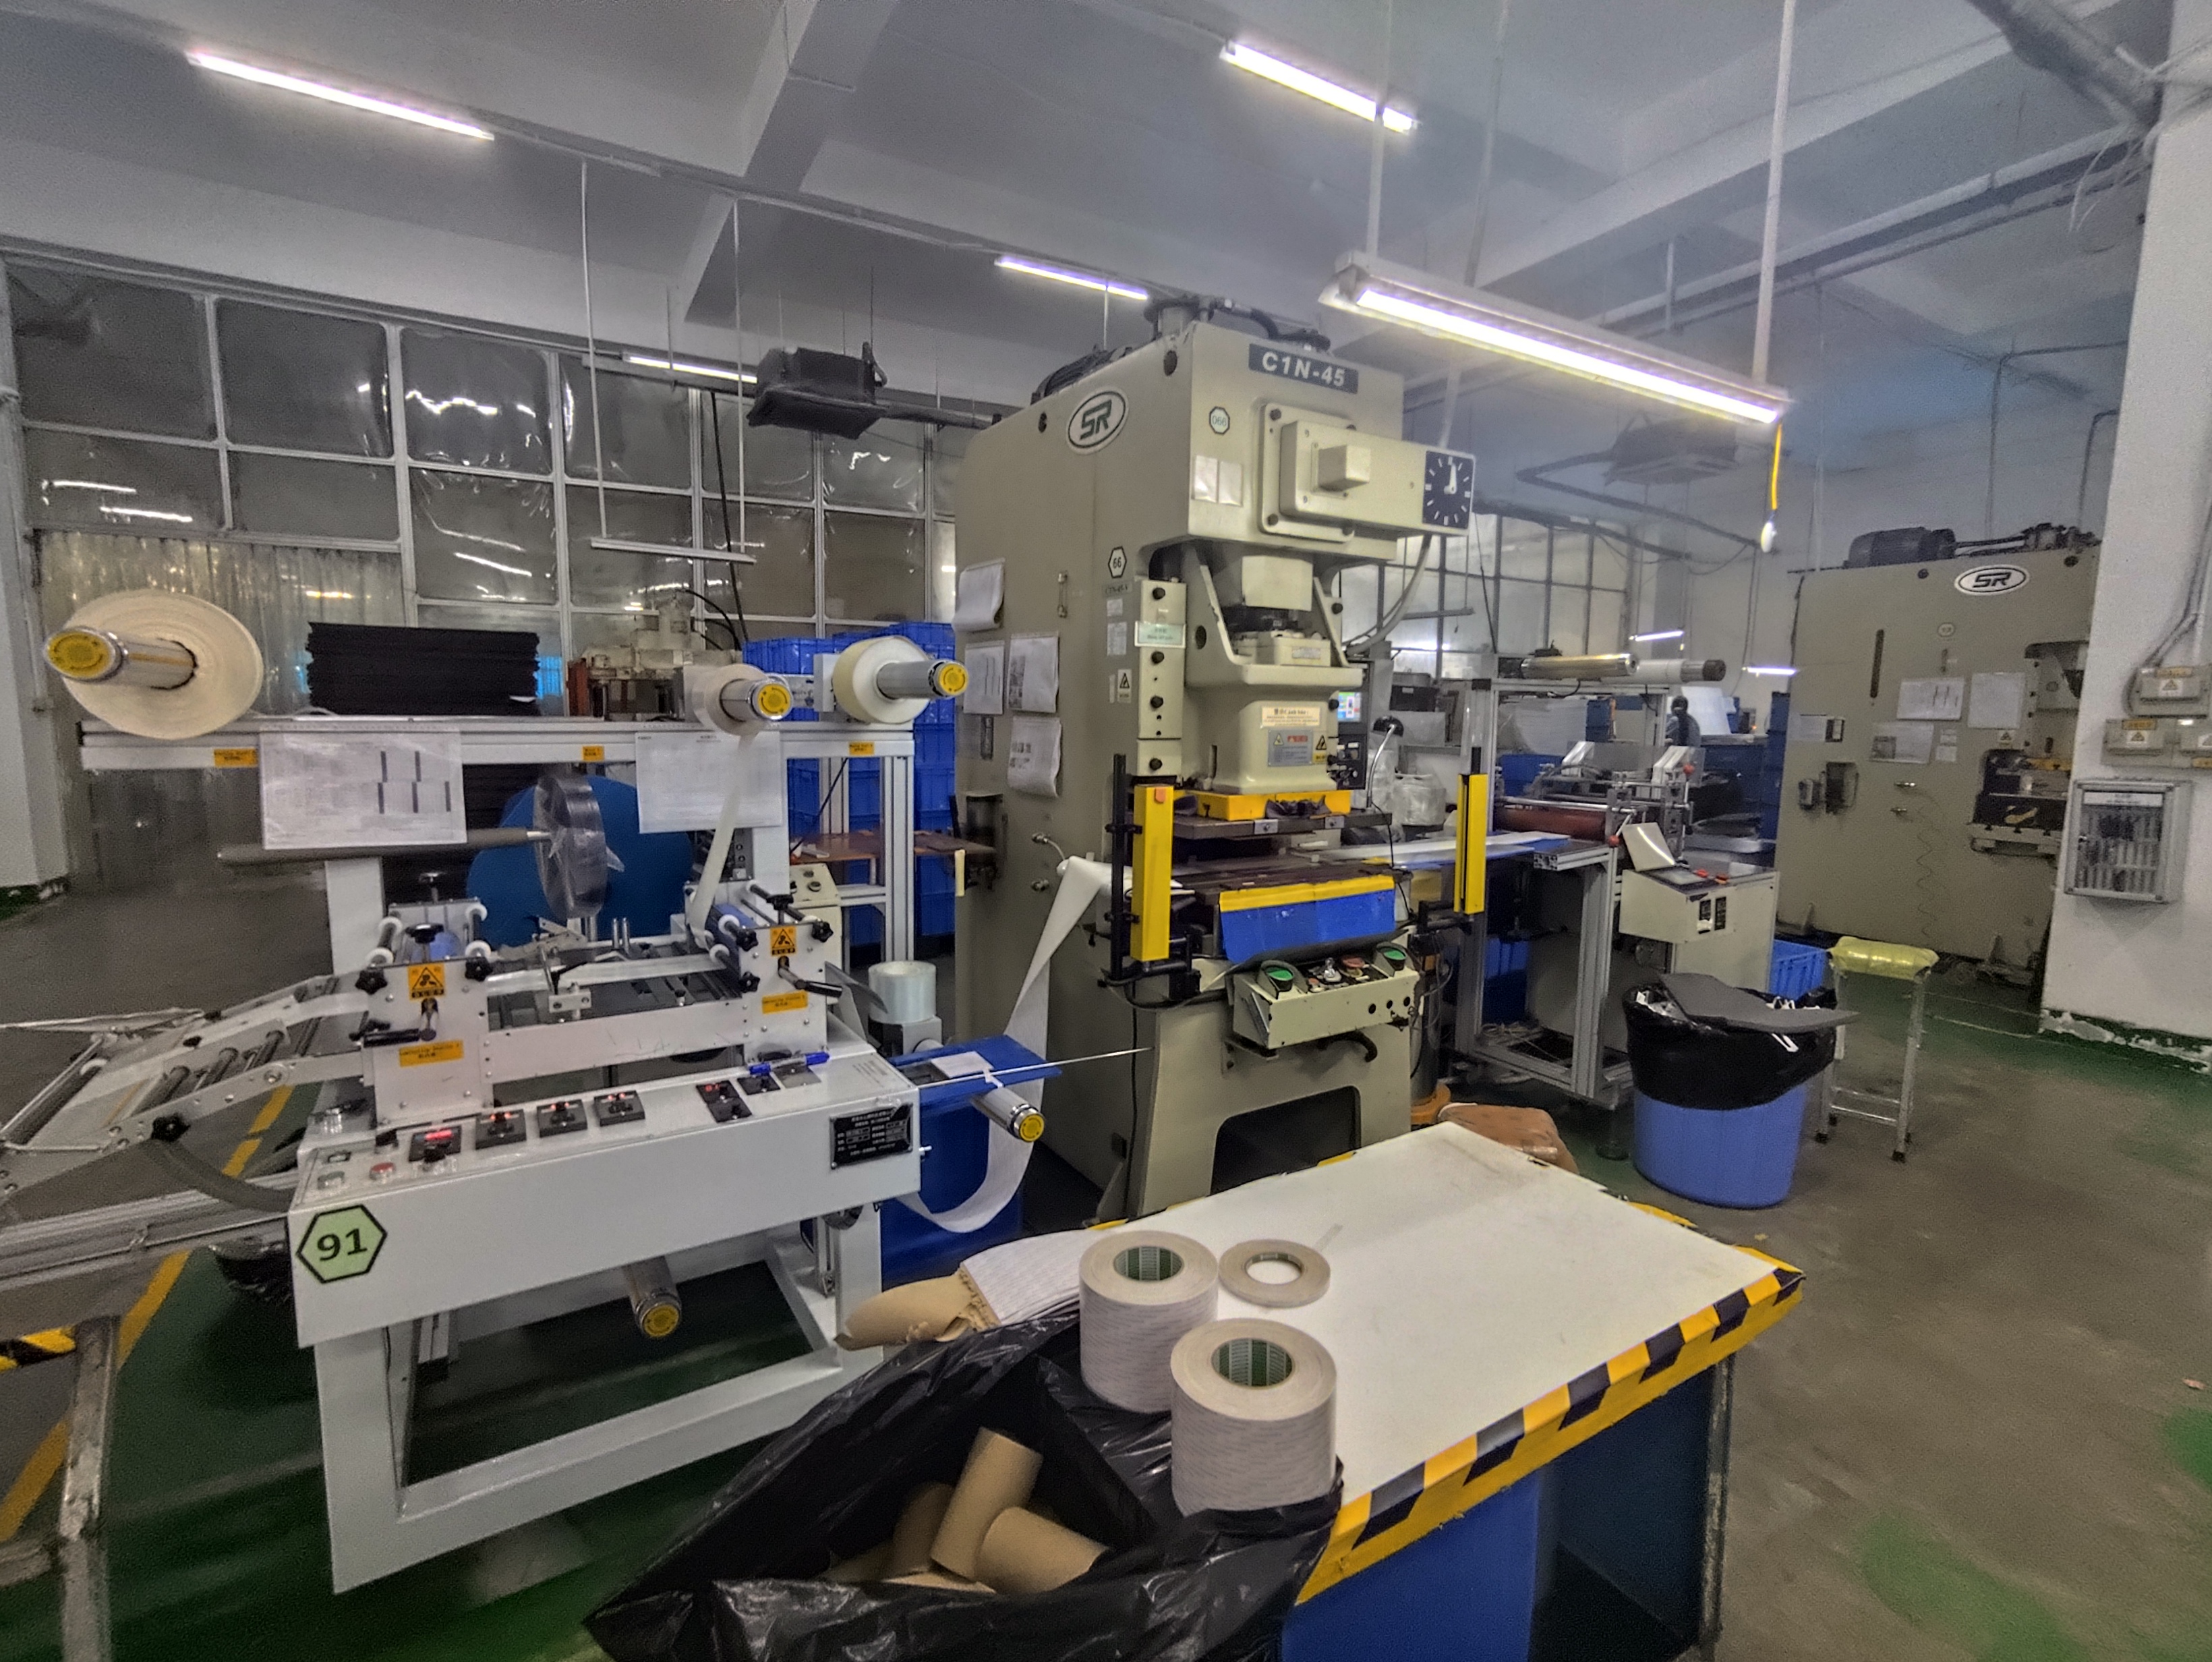
The weighting model you choose determines what behavior you reward. Here is the approach we follow when managing stamping supply chains for our U.S. clients.
A Practical Weighting Framework
| Category | Weight (Strategic Supplier) | Weight (Transactional Supplier) | Rationale |
|---|---|---|---|
| Quality | 35% | 25% | Strategic suppliers make critical parts; defects have outsized impact |
| Delivery (OTD) | 30% | 35% | Transactional suppliers often serve just-in-time lines |
| Cost / TCO | 15% | 25% | Cost matters more when parts are commoditized |
| Service & Tooling | 15% | 10% | Engineering support and tooling life cycle management are vital for complex stampings |
| Compliance | 5% | 5% | Certification is a gate, not a gradient |
Defining Scoring Bands
Raw data needs translation into a uniform scale. We use a 1-to-5 scoring system. Here is how we map on-time delivery performance to that scale:
| OTD Performance | Score | Label |
|---|---|---|
| ≥ 98% | 5 | Exceptional |
| 95–97.9% | 4 | Meets expectations |
| 90–94.9% | 3 | Needs improvement |
| 80–89.9% | 2 | At risk |
| < 80% | 1 | Unacceptable |
For PPM defect rate, we apply similar logic. Below 50 PPM earns a 5. Between 50 and 100 PPM earns a 4. Above 500 PPM earns a 1. These thresholds should reflect your industry. Automotive buyers aligned with IATF 16949 compliance standards will set tighter bands than general industrial buyers.
Tiered Weighting by Supplier Classification
Not every supplier should face the same scorecard weights. We classify suppliers into three tiers:
- Strategic: Long-term partners producing complex, high-tolerance stamped assemblies. Quality and service carry the most weight.
- Preferred: Reliable suppliers handling moderate-complexity parts. Delivery and quality are balanced.
- Transactional: Commodity suppliers for simple brackets or clips. Cost and delivery dominate.
This tiered approach prevents you from penalizing a low-cost bracket supplier for not offering full DFM engineering support, which was never part of the relationship. It also prevents you from overlooking quality drift in a strategic supplier just because their price is competitive.
Calculating the Final Score
Multiply each category score by its weight, then sum. For example, if a strategic supplier scores Quality = 4, Delivery = 3, Cost = 5, Service = 4, Compliance = 5:
Final Score = (4 × 0.35) + (3 × 0.30) + (5 × 0.15) + (4 × 0.15) + (5 × 0.05) = 1.40 + 0.90 + 0.75 + 0.60 + 0.25 = 3.90 out of 5.00
That score tells you the supplier is solid but has a delivery gap that needs a corrective action plan. Without the weighting, you might overlook that the delivery issue drags down overall reliability.
Which Tools or Templates Can Help Me Track Supplier Performance Over Time?
A lesson we learned early in our Vietnam operations was that the best scorecard is useless if nobody updates it. Our first attempt was a beautifully designed Excel file. It sat untouched for three months. The problem was not the template—it was the workflow around it.
Spreadsheet templates in Excel or Google Sheets work well for small supplier bases, while ERP-integrated dashboards and dedicated supplier management platforms like SAP Ariba, Ivalua, or Coupa scale better for larger programs. The best tool is the one your team will actually use consistently.
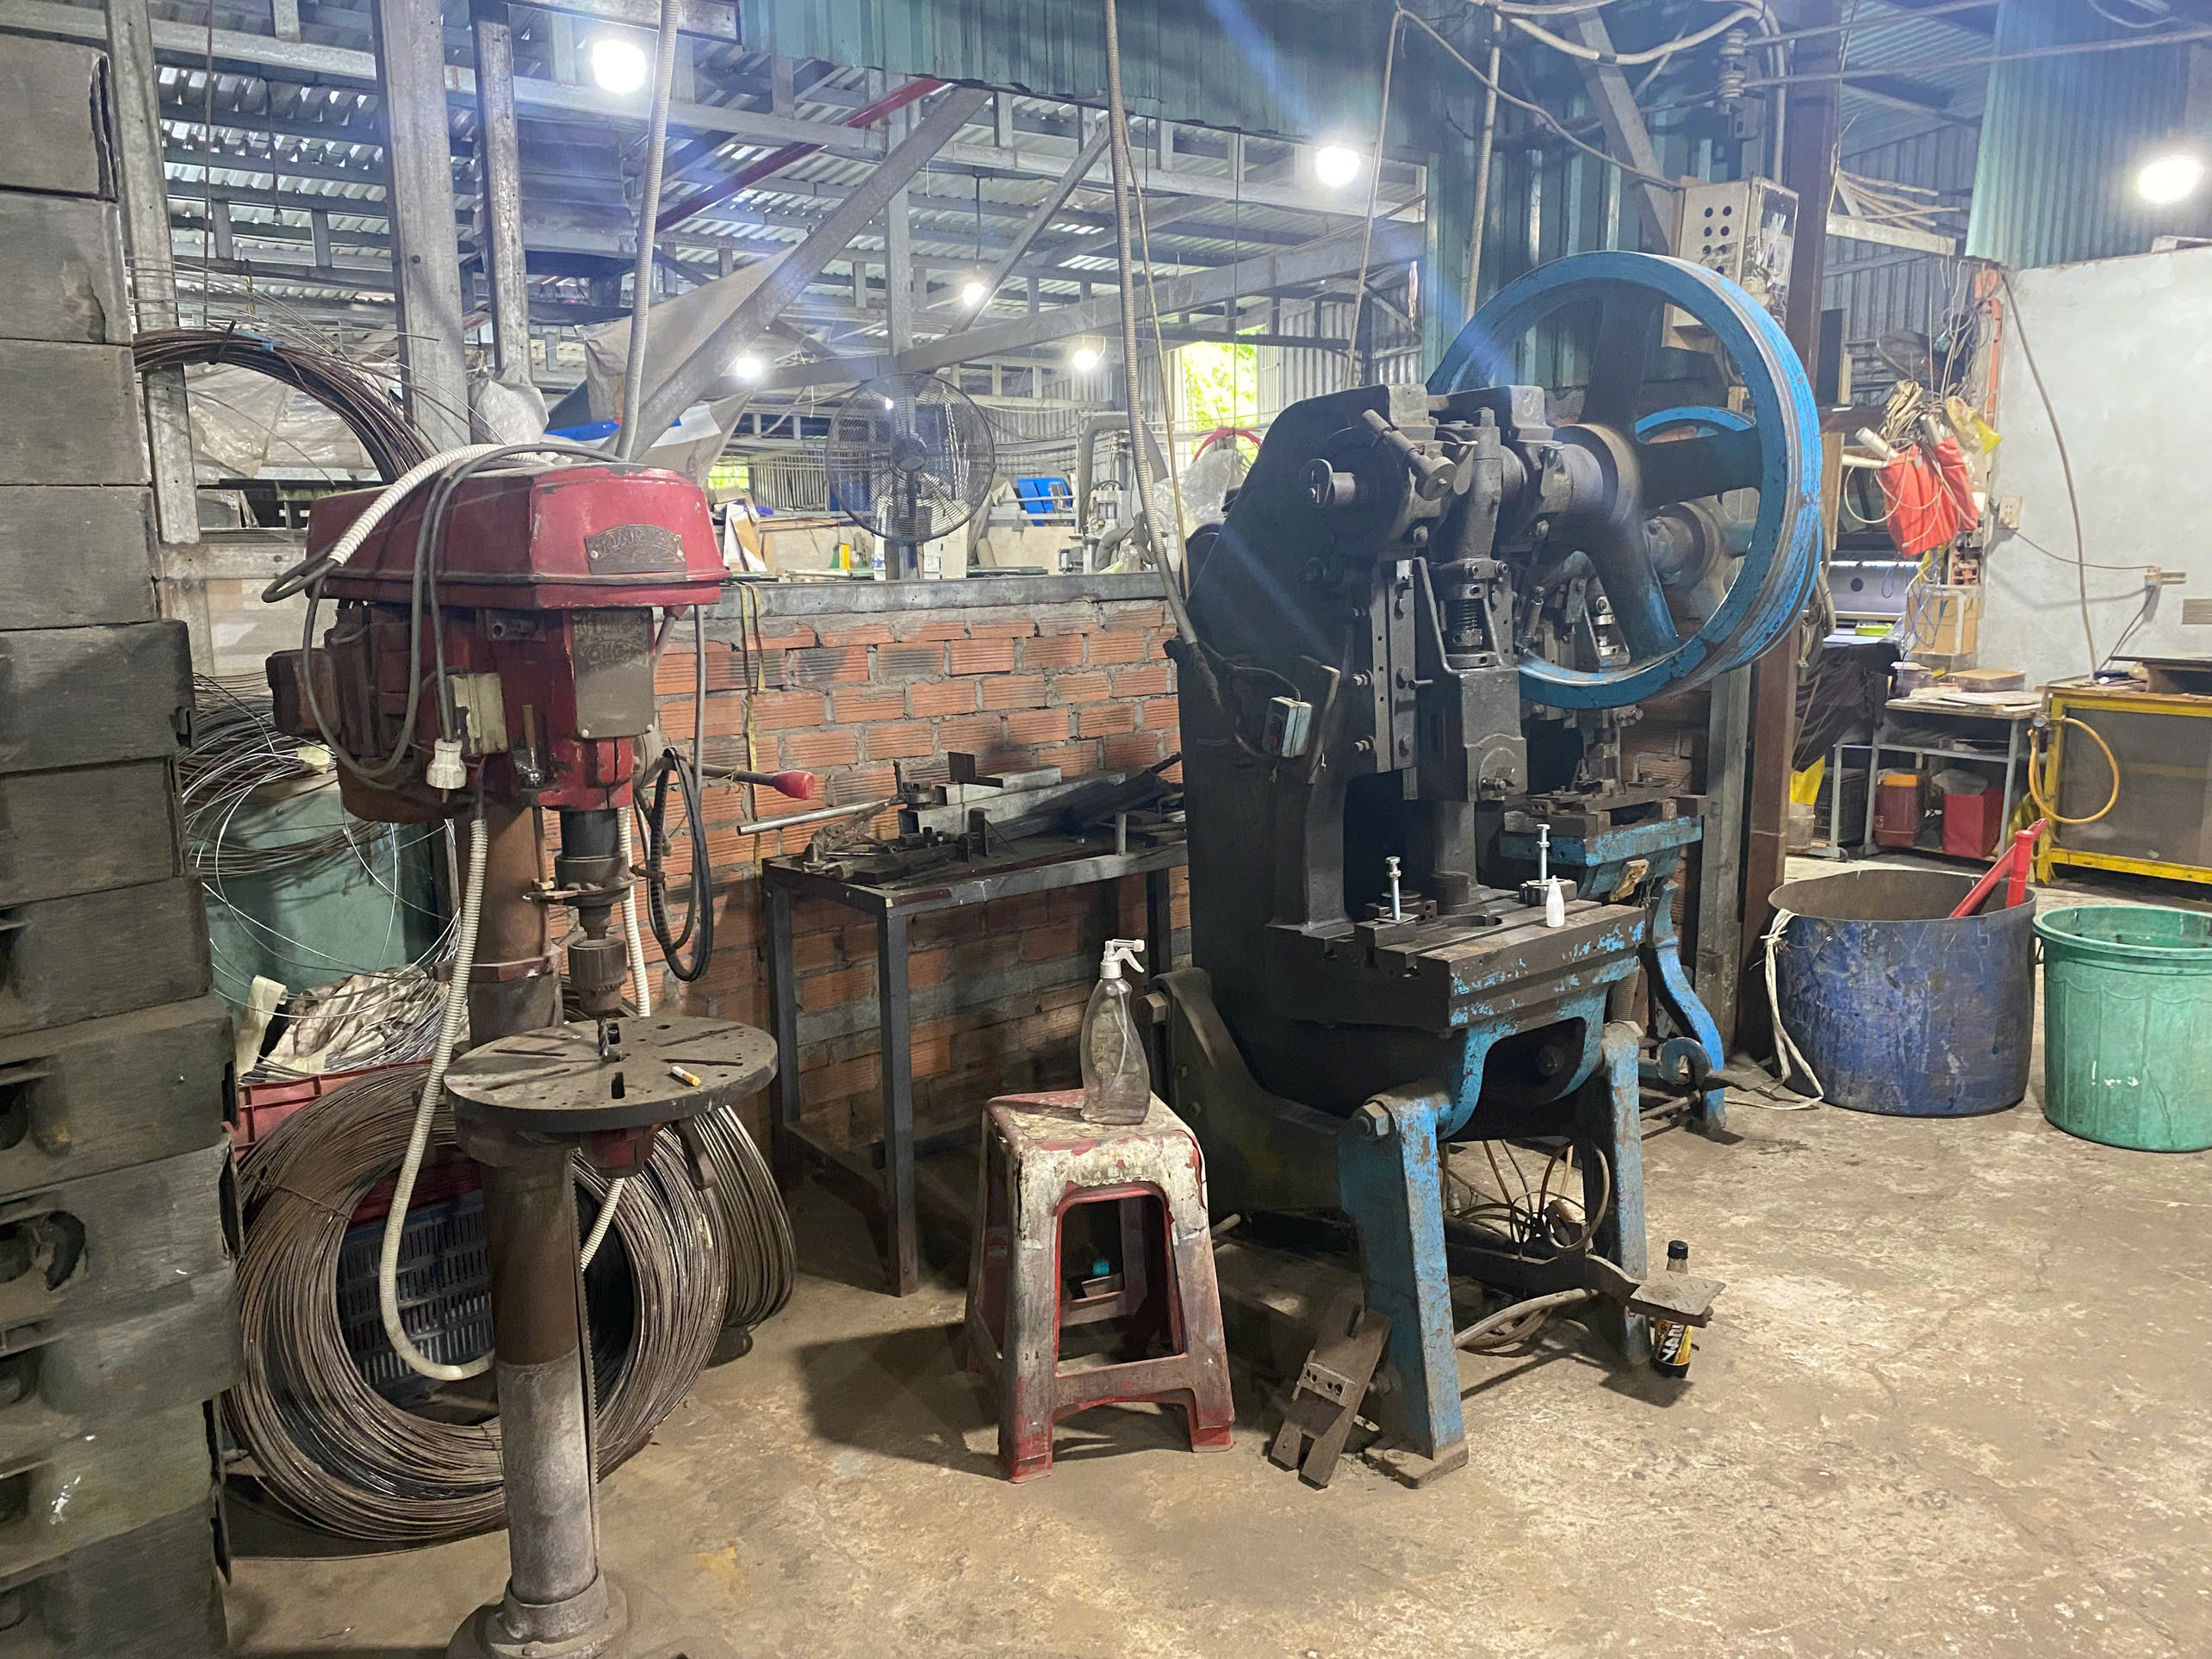
The right tool depends on your team size, supplier count, and IT infrastructure. Here is a practical comparison.
Tool Comparison for Stamping Scorecards
| Tool Type | Best For | Pros | Cons |
|---|---|---|---|
| Excel / Google Sheets | Small teams, < 10 suppliers | Free, customizable, easy to share | Manual data entry, version control issues, no automation |
| ERP Module (SAP, Oracle) | Mid-to-large companies with ERP already deployed | Automated data pull from POs, receipts, and quality records | Complex setup, requires IT support, expensive |
| Dedicated SRM Platform (Ivalua, Coupa, SAP Ariba) | Enterprises with 50+ suppliers | Real-time dashboards, automated alerts, vendor risk assessment 7 features | High licensing cost, long implementation cycle |
| BI Tool (Power BI, Tableau) | Data-driven teams wanting visualization | Strong trend analysis, connects to multiple data sources | Requires data engineering skills, not a standalone SRM |
| Custom Internal App | Companies with unique workflow needs | Tailored exactly to your process | Development and maintenance cost, dependency on internal IT |
What a Good Spreadsheet Template Includes
For most small-to-mid-size sourcing operations, a well-structured spreadsheet is enough. Here is what we include in ours:
- Supplier identification: Name, location, tier classification, primary contact.
- KPI columns: One column per metric (PPM, OTD, TCO, corrective action response time, tooling status, certification expiry).
- Scoring columns: Raw score (1–5) and weighted score for each KPI.
- Final weighted score: Auto-calculated sum.
- Trend indicator: A simple arrow or color code (green, yellow, red) showing direction compared to last period.
- Comments column: Free-text field for notes from quality engineers, operations staff, or our logistics coordinators.
- Action items: Open corrective action reports linked to specific KPIs.
Combining Hard Data with Stakeholder Feedback
One debate in procurement is whether scorecards should rely entirely on ERP data or include subjective input. Our experience supports a hybrid model—roughly 70% hard data and 30% stakeholder feedback 8. Hard data covers PPM, OTD, and cost. Stakeholder feedback captures things that numbers miss: how responsive is the supplier's engineering team when we request a design-for-manufacturing review 9? How quickly do they communicate when a delay is coming?
We collect stakeholder input through a simple quarterly survey sent to our quality engineers and project managers. They rate the supplier on communication, tooling maintenance speed, and engineering support using the same 1-to-5 scale. This feedback feeds directly into the "Service" category of the scorecard.
Closing the Data Gap
If a supplier does not have digital inspection records yet, do not wait for perfect data. Start with weekly quality logs filled in manually by your incoming inspection team. Track dimensional compliance on a sample basis. Even partial data is better than no data. Over time, push suppliers toward sharing real-time press telemetry 10 and stroke-count reports so you can monitor tooling wear proactively.
How Often Should I Review and Update My Supplier Scorecards for Stamping Parts?
During a recent project for a U.S. client sourcing Z-shaped spring clamps from a facility in Vietnam, we caught a quality drift that would have gone unnoticed under a quarterly review cycle. The supplier's die had reached 80% of its expected stroke life, and burr formation spiked over a two-week window. Because we were reviewing that supplier monthly, we flagged the issue and initiated a tooling refurbishment before any defective parts shipped.
Review stamping supplier scorecards monthly for high-risk and strategic suppliers, and quarterly for preferred or transactional suppliers. Conduct a comprehensive annual review to reassess weights, update benchmarks, and inform contract renewal or volume allocation decisions.

The review cadence should match the risk level and volume of each supplier relationship. A one-size-fits-all schedule wastes time on low-risk suppliers and under-monitors high-risk ones.
Recommended Review Cadence
- Monthly: Strategic and high-volume stamping suppliers. These are the partners where a quality escape or delivery miss directly threatens your client's production. Monthly reviews let you detect trends in lead time variability, PPM shifts, and tooling wear before they become crises.
- Quarterly: Preferred suppliers with stable performance histories. A quarterly check keeps them accountable without creating administrative overload.
- Annually: Transactional or low-volume suppliers. The annual review is also the time to recalibrate your scorecard itself—update KPI targets, adjust weights, and incorporate any new compliance requirements.
What Happens During a Review
A scorecard review is not just a number check. It is a structured conversation. Here is the agenda we follow:
- Data presentation: Share the updated scorecard with the supplier. Show their scores, trends, and how they compare to your benchmarks.
- Root-cause discussion: For any metric below target, ask the supplier to present a root-cause analysis. This is where corrective action reports become essential.
- Action plan: Agree on specific, time-bound corrective actions. For example: "Replace die insert by Week 12; submit PPAP samples by Week 14."
- Commercial implications: If a supplier consistently underperforms, the scorecard data supports volume reallocation or contract renegotiation. If they consistently outperform, reward them with additional business.
Turning Scorecard Data into Strategic Decisions
The real power of a supplier scorecard is not measurement—it is decision-making. Over the past several years managing stamping supply chains, I have seen scorecard data drive three types of strategic moves:
- Volume shifting: Moving 30% of order volume from an underperforming supplier to a higher-scoring alternative, based on OTD and quality trends.
- Price negotiation: Using TCO data to demonstrate that a supplier's low unit price is offset by high scrap rates and freight costs, then negotiating a more transparent pricing structure.
- Supplier development: Investing in a high-potential supplier's tooling capabilities or quality systems because the scorecard shows strong service and compliance scores, with quality as the only gap.
Sharing the scorecard methodology with suppliers upfront sets clear expectations. When suppliers know exactly how they are measured—and that the results affect their volume—behavior changes. In our experience, transparency around vendor risk assessment criteria motivates suppliers to invest in their own process controls, which benefits everyone.
Conclusion
A well-built supplier scorecard for stamping parts procurement turns scattered data into clear, actionable decisions. Define your stamping-specific KPIs, weight them by strategic importance, use tools your team will actually maintain, and review on a risk-based cadence. Start simple, iterate often, and let the scorecard drive real supplier improvements.
Frequently Asked Questions
What Metrics Should I Include in My Stamping Supplier Scorecard?
When we onboard a new stamping supplier in Vietnam or Taiwan, the first question our quality engineers ask is: "What exactly are we measuring, and does it match what can go wrong with stamped parts?" That distinction matters because stamping failures—die wear, burr formation, dimensional drift—are different from machining or casting failures.
How Do I Weight Quality, Delivery, and Cost When Scoring Stamping Suppliers?
One trade-off our procurement team debates regularly is how much weight to give delivery versus quality. A supplier with flawless parts but chronic late shipments still shuts down a production line. Conversely, a supplier who always delivers on time but ships borderline parts creates rework nightmares downstream.
Which Tools or Templates Can Help Me Track Supplier Performance Over Time?
A lesson we learned early in our Vietnam operations was that the best scorecard is useless if nobody updates it. Our first attempt was a beautifully designed Excel file. It sat untouched for three months. The problem was not the template—it was the workflow around it.
Footnotes
1. CIPS is the global professional body providing authoritative definitions of procurement and supply cycles. ↩︎
2. ASME Y14.5 is the authoritative standard governing dimensional tolerancing referenced in this metric. ↩︎
3. ASQ provides standards and resources for effective supplier quality evaluation and management. ↩︎
4. Defines the standard manufacturing metric for measuring quality through defective parts per million. ↩︎
5. Explains the engineering principles of tolerances and compliance in manufacturing processes. ↩︎
6. Explains the CAPA process which governs the generation and management of corrective action reports. ↩︎
7. ISO 31000 is the recognized standard framework for structured supplier and vendor risk assessment. ↩︎
8. Background concept link explaining how qualitative input integrates into supplier evaluation systems. ↩︎
9. Explains the DFM process referenced when assessing supplier engineering responsiveness. ↩︎
10. Provides background on IIoT-based monitoring technologies used for tooling wear tracking. ↩︎