When we started tracking the carbon footprint of sheet metal fabricated products across our Asian supply chain, the complexity almost stopped us cold — but the cost savings and compliance wins made it worth every effort.
To calculate and reduce the carbon footprint of sheet metal fabricated products, multiply each activity’s data (material weight, energy consumed, transport distance) by its emission factor across the full lifecycle, then target the largest hotspots — raw material extraction, manufacturing energy, and logistics — with recycled metals, process optimization, and supply chain decarbonization.
This guide walks through the practical steps we use every day — from selecting emission factor 1s and vetting fabrication partners in Vietnam and across Asia, to choosing lower-carbon materials and tightening quality control so parts are right the first time, every time.
How can I accurately calculate the total carbon footprint of my custom sheet metal components?
A purchasing manager we work with in the Midwest once asked us for a product carbon footprint 2 report on a batch of stainless steel mounting brackets — and that single request reshaped how our entire team approaches carbon accounting for custom parts.
To accurately calculate the total carbon footprint of custom sheet metal components, define your system boundary (cradle-to-gate or cradle-to-grave), collect primary data on materials, energy, and transport, then apply recognized emission factors to each activity and sum the CO₂-equivalent values across every lifecycle stage.
Step 1: Define Your System Boundary and Functional Unit
Before any numbers go into a spreadsheet, you need clear boundaries. Are you measuring cradle-to-gate 3 (raw material to finished part leaving the factory)? Or cradle-to-grave (all the way through end-of-life disposal or recycling)? For most B2B purchasing managers, cradle-to-gate is the practical starting point. It captures the factors you can actually control or influence.
Pick a functional unit 4. This is the reference point for all your data. For sheet metal, it is usually "1 kg of finished product" or "1 unit of a specific part number." Without a consistent functional unit, comparisons between designs or suppliers become meaningless.
Set your time frame. We typically scope it to one production year or one purchase order batch. And define the geography — energy grids in Vietnam, India, and Taiwan all have different carbon intensities.
Step 2: Collect Activity Data
This is the hardest part. You need real numbers, not guesses. Here is what to gather:
| Data Category | What to Collect | Example |
|---|---|---|
| Raw Materials | Metal type, weight, recycled content, origin | 50 kg of 304 stainless steel, 30% recycled, from South Korea |
| Energy Use | kWh per process step (cutting, bending, welding, finishing) | Laser cutting: 18 kWh per batch; welding: 12 kWh per batch |
| Transportation | Distance, mode (sea, truck, air), weight | 14,000 km by sea freight, 200 km by truck |
| Waste & Scrap | Scrap rate, disposal method | 8% scrap, returned to steel recycler |
| Finishing | Coating type, VOC level, energy for curing | Powder coating, zero VOC, 6 kWh oven curing |
Our team in Vietnam collects this primary data directly from the factory floor during production. We find that relying on default emission factors from databases introduces error — sometimes 20–30% off from actual values. Primary data always wins.
Step 3: Apply Emission Factors and Sum
Once you have the activity data, multiply each line by the right emission factor. Here are some common reference points for sheet metal:
| Activity | Emission Factor | Source |
|---|---|---|
| Primary steel (BF-BOF) | ~1.987 tonnes CO₂ / tonne steel | World Steel Association 5 |
| Recycled steel (EAF) | ~0.357 tonnes CO₂ / tonne steel | World Steel Association |
| Aluminum (primary) | ~8.0 tonnes CO₂ / tonne aluminum | IEA 6 |
| Aluminum (recycled) | ~0.5 tonnes CO₂ / tonne aluminum | IEA |
| Sea freight | ~7.9 g CO₂ / tonne-km | Industry average |
| Grid electricity (Vietnam) | ~0.72 kg CO₂ / kWh | IEA |
Sum all the CO₂-equivalent values. That total is your product carbon footprint for the defined boundary and functional unit. A life cycle assessment done this way gives you not just a number, but a map of where emissions are concentrated — and that map tells you where to cut.
Sensitivity Analysis Matters
Data gaps are inevitable. When we cannot get an exact kWh reading for a welding cell, we use a reasonable estimate and then run a sensitivity analysis. This means we test: "If our energy estimate is off by 15%, how much does the total footprint change?" If the answer is "a lot," we go back and get better data. If it barely moves the needle, we move on. This keeps the calculation honest without making it endlessly slow.
What criteria should I use to vet the environmental impact of my sheet metal fabrication partners in Asia?
Last year, one of our U.S. clients asked us to audit a potential press brake supplier in northern Vietnam — not just for dimensional accuracy, but for their energy sources and waste handling. That request taught us that vetting environmental impact requires the same rigor we apply to PPAP and first-article inspection.
To vet the environmental impact of sheet metal fabrication partners in Asia, evaluate their energy source mix (grid vs. renewable), scrap recycling rates, wastewater and chemical management practices, environmental certifications (ISO 14001), and willingness to share primary production data for life cycle assessment and carbon reporting.
What to Ask — and What to Verify On-Site
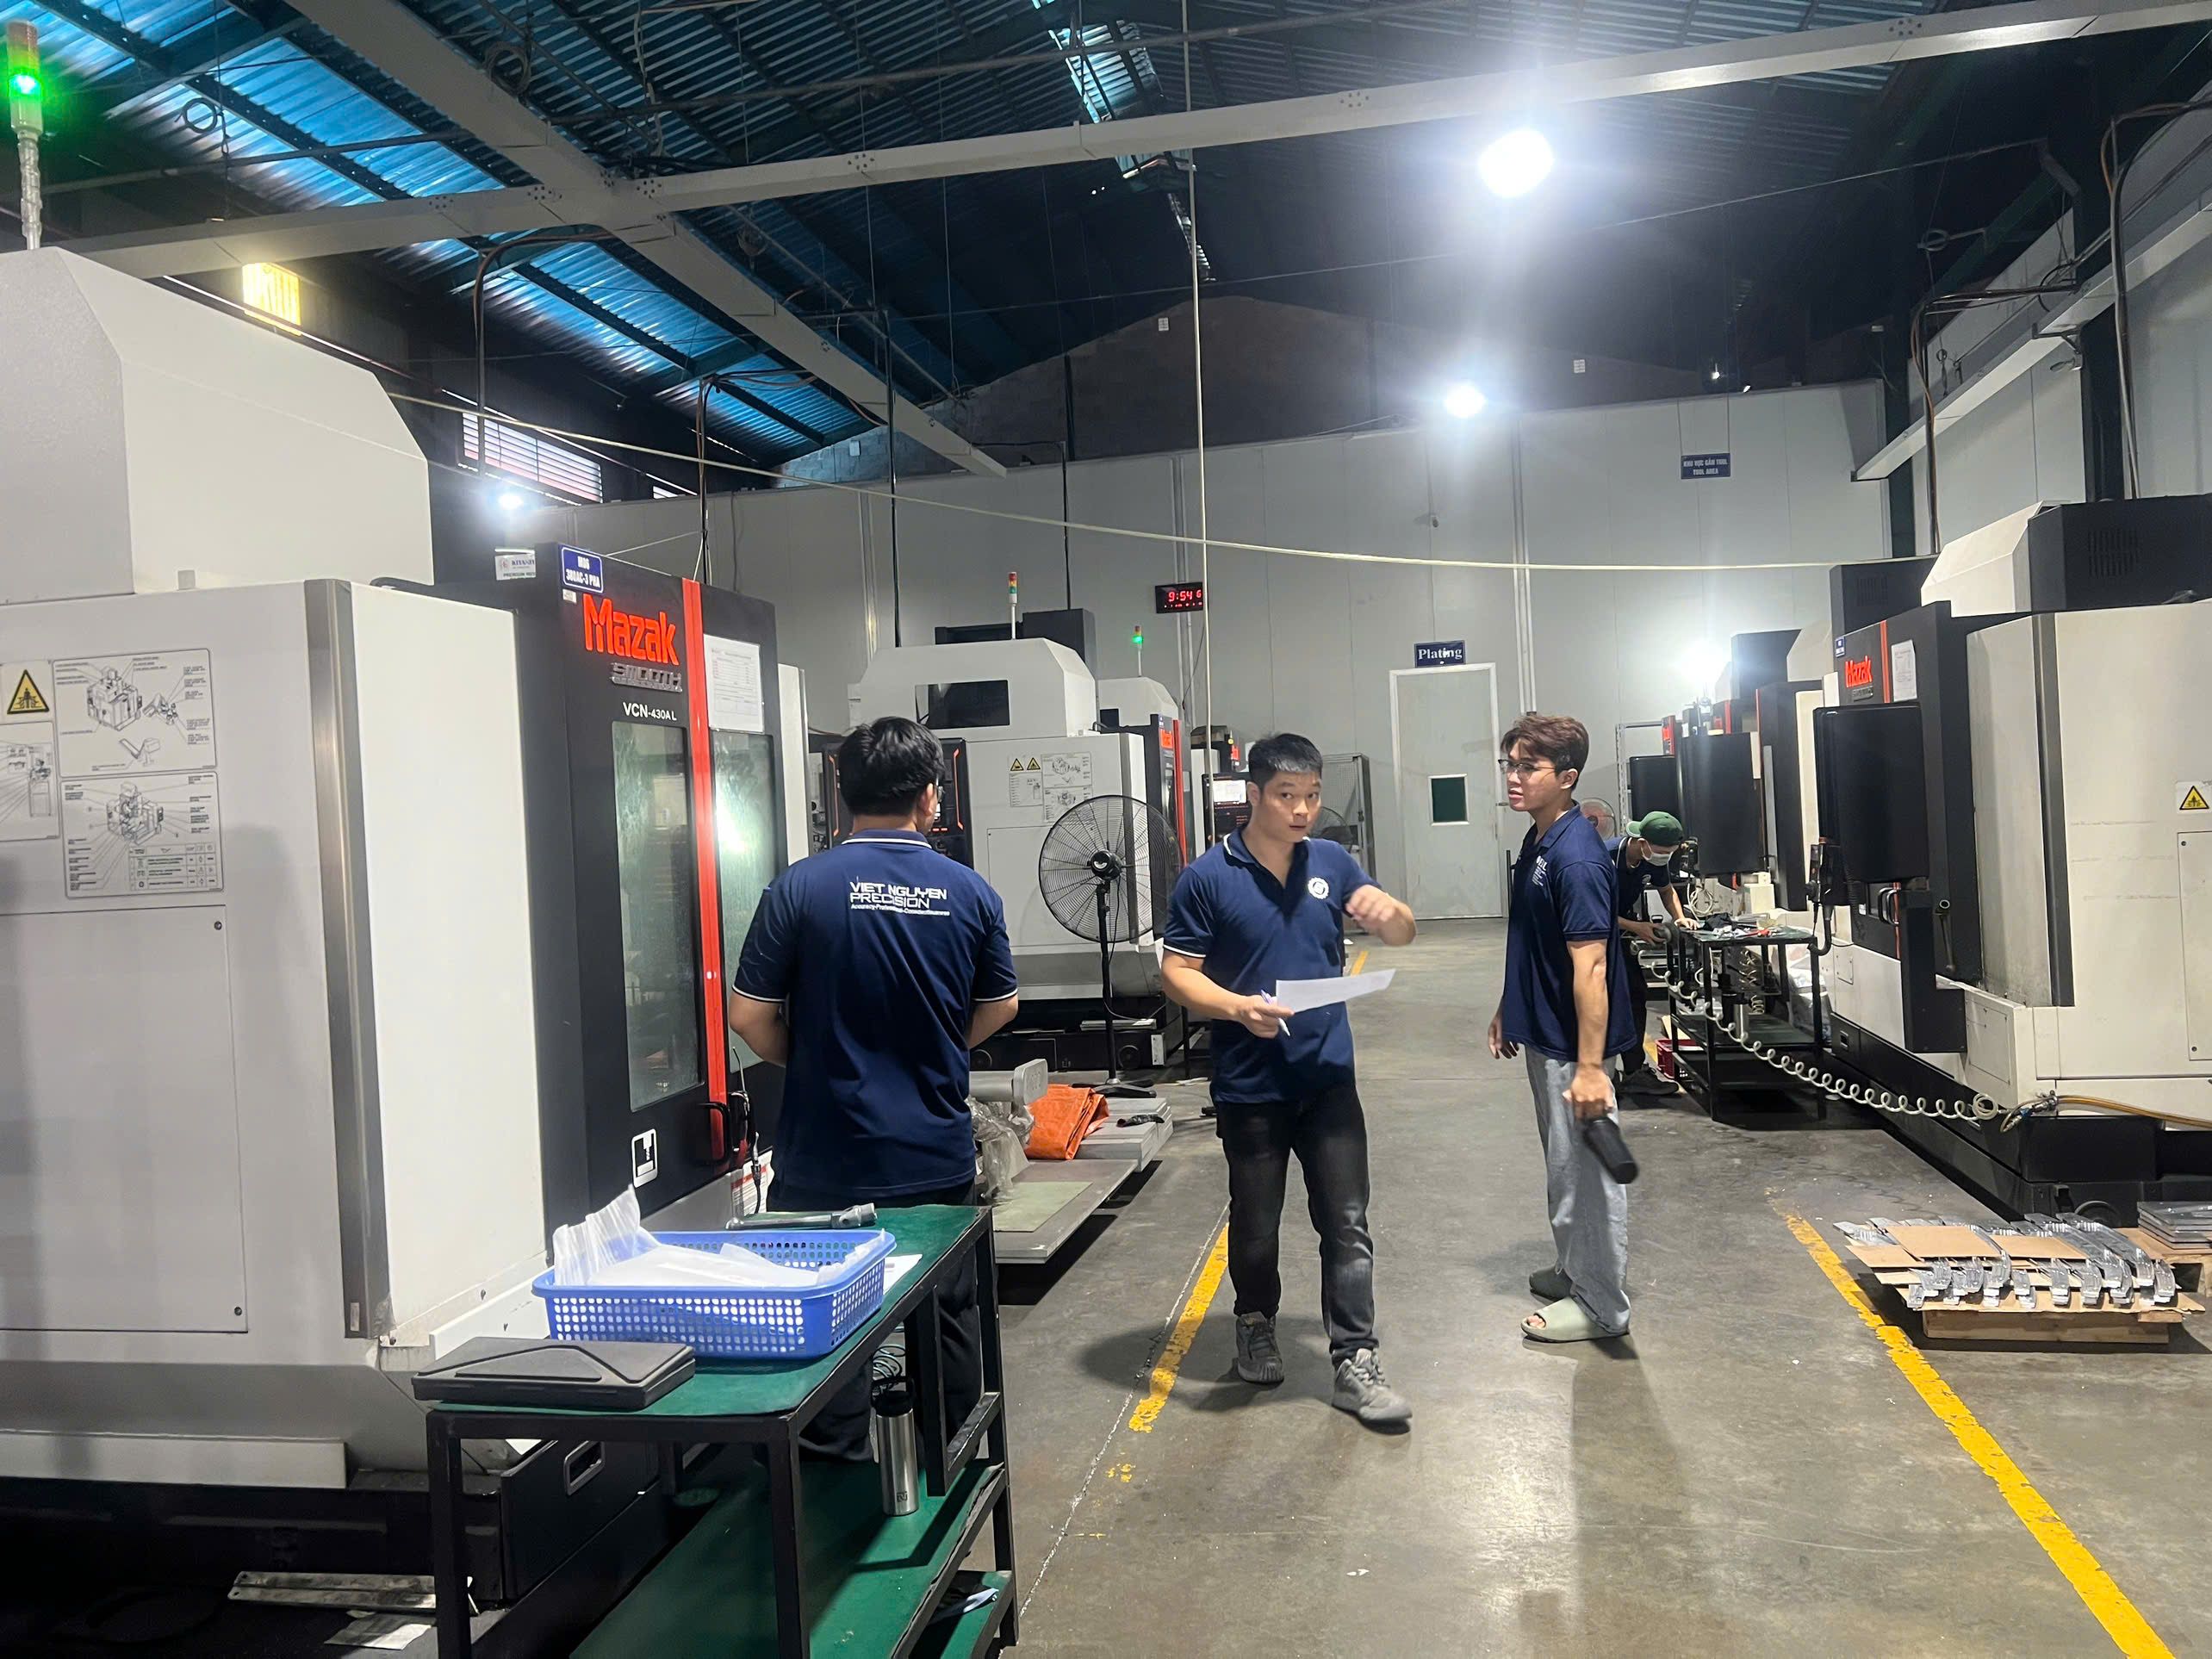
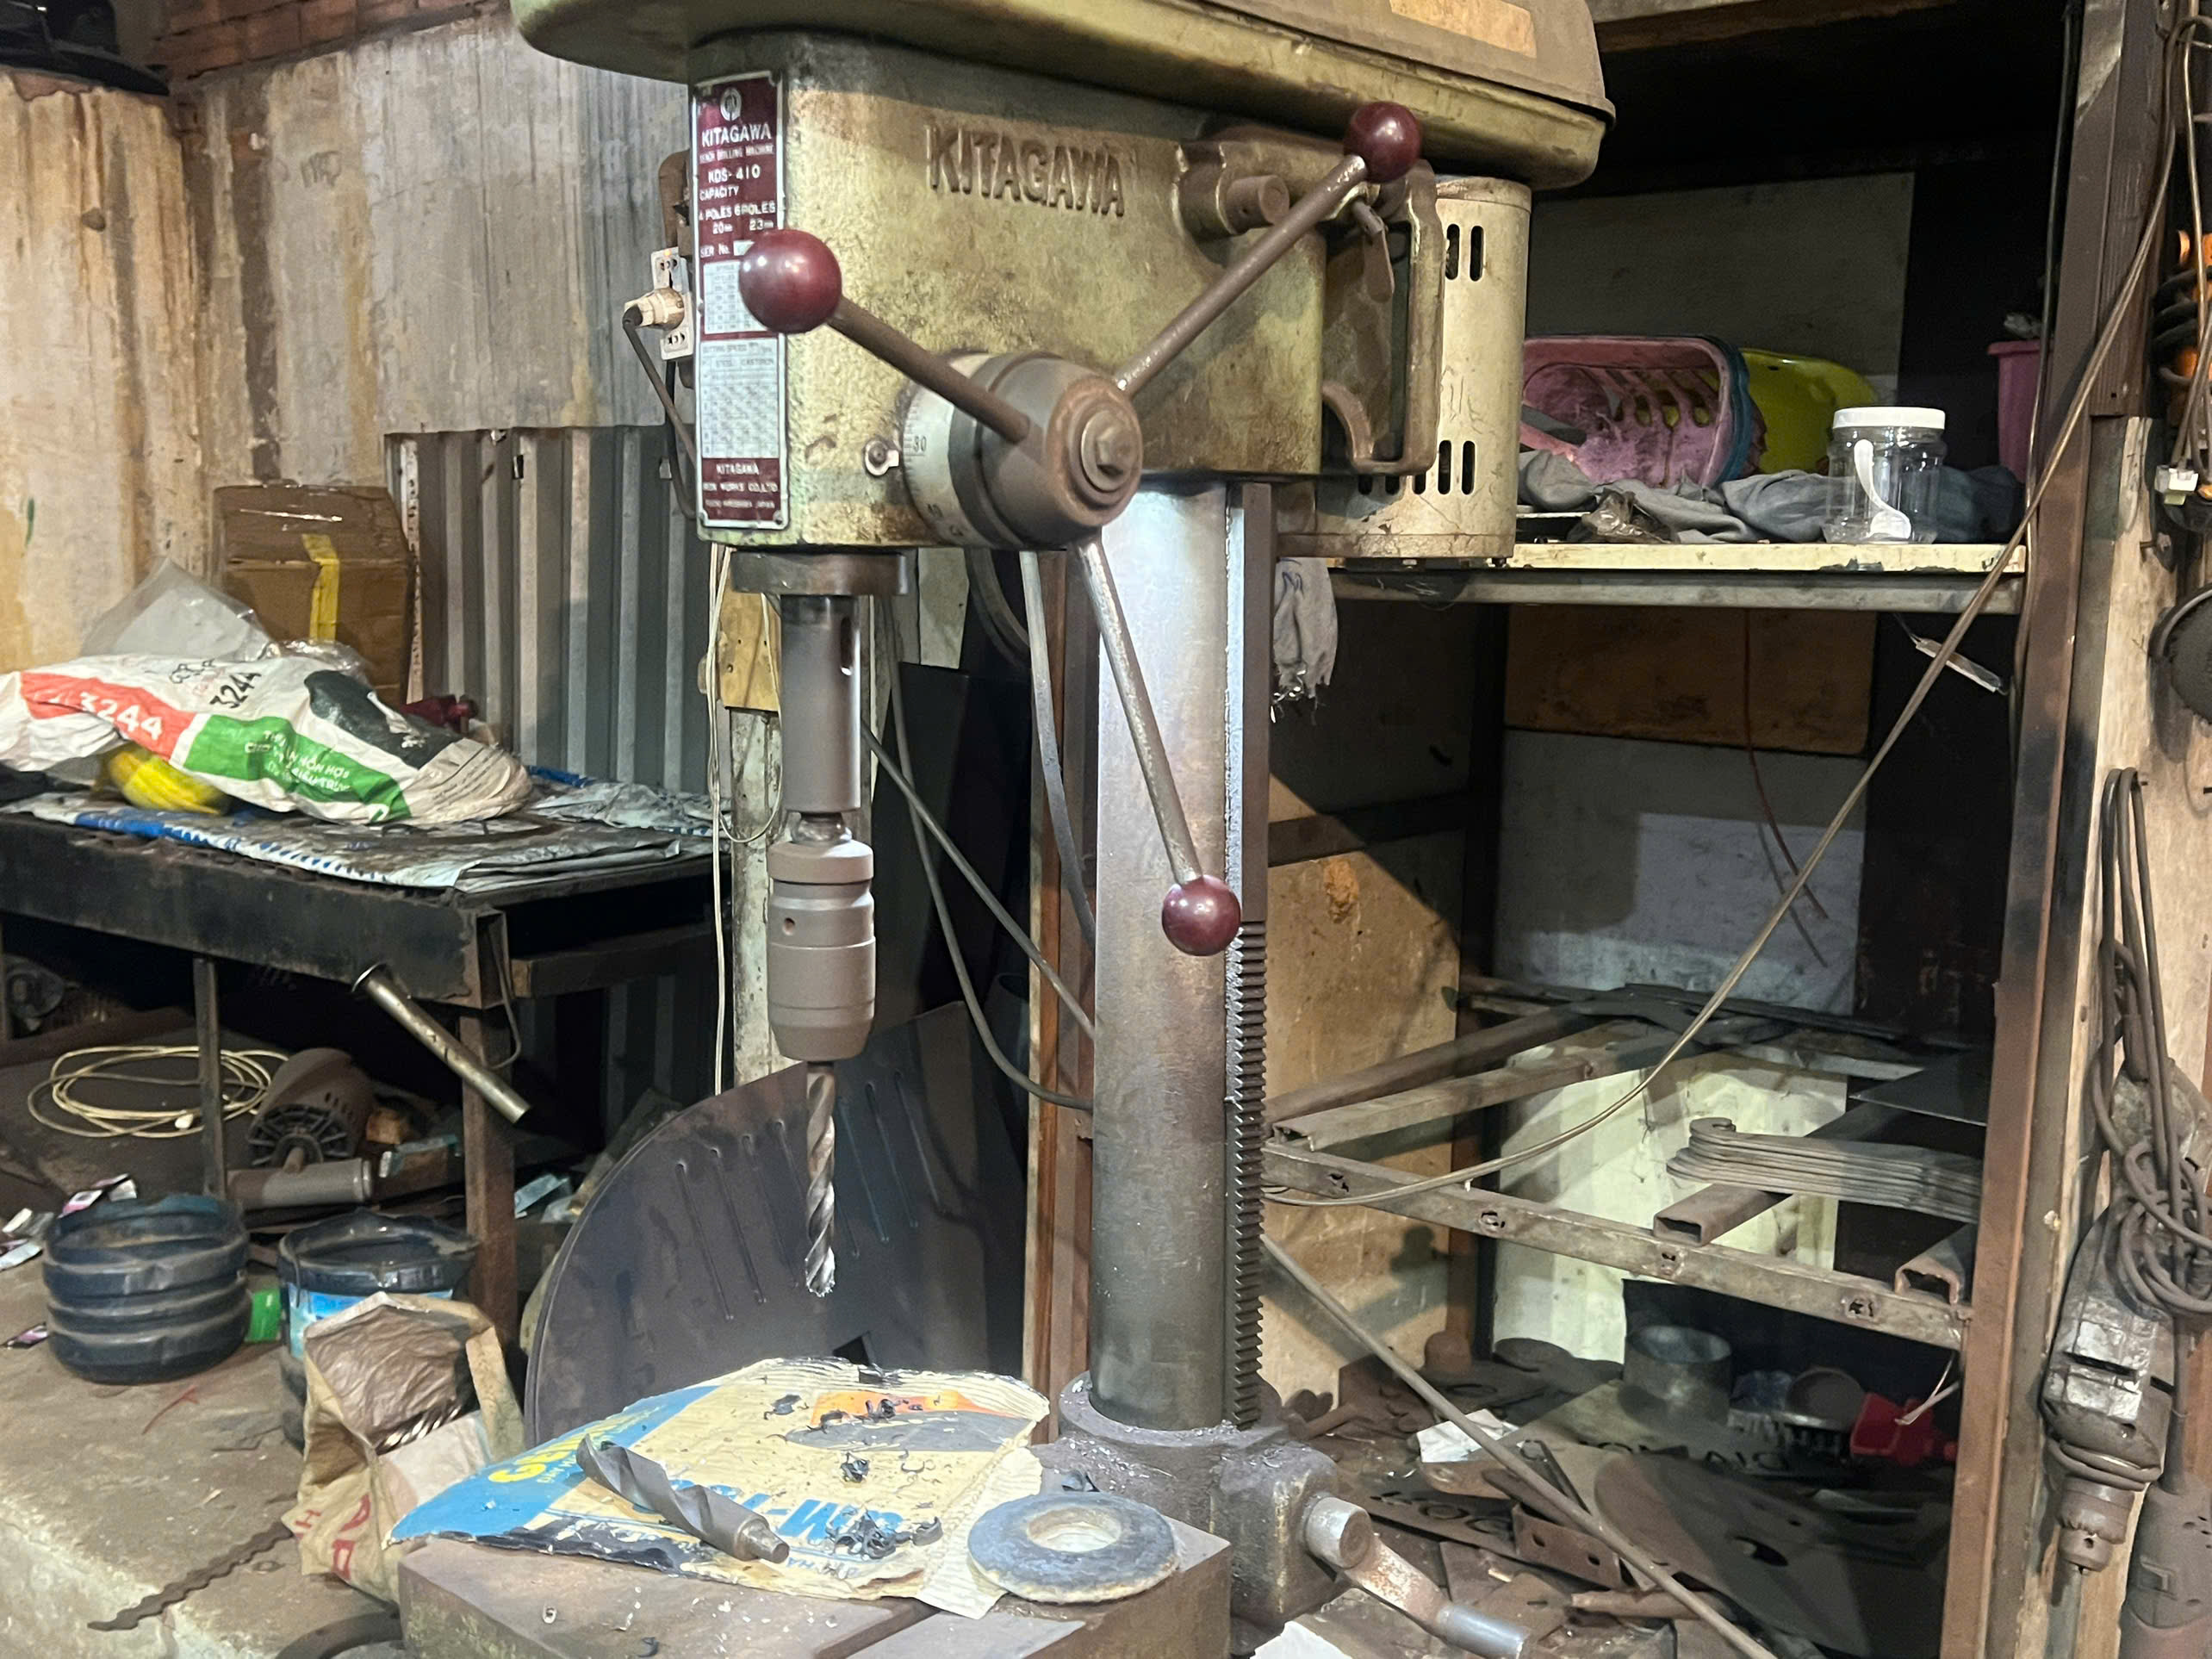
Sending a questionnaire is easy. Getting real answers requires boots on the ground. When our team in Vietnam or China visits a factory, we look at the same things every time:
Energy transparency. Does the factory know its electricity consumption per machine, per shift? Can it break out kWh by process step? Factories that track energy this way are almost always better managed overall. If the plant manager shrugs at this question, that is a red flag — for both sustainability and quality.
Scrap handling. We check the scrap bins. Is metal scrap separated by alloy? Is it sold back to a certified recycler, or does it go into a mixed-waste dumpster? Proper scrap segregation is a sign of material waste reduction discipline and directly affects the circular economy potential of every part produced there.
Chemical and wastewater management. Finishing processes like anodizing, plating, and some powder coating lines produce hazardous waste. We ask to see the factory's wastewater treatment setup and their discharge permits. Eco-friendly finishing processes like powder coating (zero VOC) score higher than wet paint or chrome plating.
Certifications. ISO 14001 7 is a baseline. It is not proof of green manufacturing, but it shows the factory has at least structured its environmental management. Some partners now pursue ISO 50001 (energy management), which signals a deeper commitment to energy efficiency.
Data sharing willingness. Can the supplier provide emission data for your specific order? This is increasingly important for supply chain decarbonization. If a partner refuses to share data, you cannot build an accurate product carbon footprint — and you cannot comply with regulations like the EU's Carbon Border Adjustment Mechanism 8 (CBAM).
A Simple Scoring Framework
We use a weighted checklist when we assess partners. Here is a simplified version:
| Criteria | Weight | What "Good" Looks Like |
|---|---|---|
| Energy tracking (per-process kWh data) | 20% | Metered per machine or cell; records available |
| Renewable energy use | 15% | On-site solar, or documented renewable procurement |
| Scrap recycling rate | 15% | >90% of metal scrap returned to certified recycler |
| Environmental certification (ISO 14001 / 50001) | 15% | Current, audited within last 12 months |
| Chemical / wastewater compliance | 15% | Permits current; treatment system operational |
| Willingness to share CO₂ data | 10% | Provides primary data within agreed timeline |
| Sustainable packaging / logistics | 10% | Reusable packaging; consolidation shipping |
We weigh energy tracking and scrap recycling highest because those two factors drive the largest share of embedded carbon in most sheet metal products. A factory that scores well here tends to score well on quality, too — the discipline is transferable.
The Quality Connection
Here is something we have learned through years of auditing: factories with strong environmental controls almost always have stronger process control. The same management rigor that prevents scrap from ending up in a landfill also prevents nonconforming parts from shipping. So when you vet for sustainability, you are also vetting for the kind of supplier who gets it right the first time — which matters enormously to purchasing managers who have been burned by rework and returns. For a deeper look at evaluating suppliers on these criteria, see our guide on how to select an eco-friendly sheet metal fabrication supplier.
Which material choices and manufacturing processes will help me reduce the embedded carbon in my sheet metal designs?
The biggest lesson we learned during a bracket redesign project was blunt: swapping from primary aluminum to recycled aluminum cut the part's embedded carbon by over 75% — without changing a single dimension on the drawing.
To reduce embedded carbon in sheet metal designs, specify recycled metals (EAF steel or recycled aluminum), minimize material thickness where structurally allowable, optimize nesting to cut scrap below 5%, adopt energy-efficient processes like fiber laser cutting, and use eco-friendly finishes such as powder coating.
Material Selection: The Single Biggest Lever
Raw material production dominates the carbon footprint of almost every sheet metal part. The difference between primary and recycled metal is dramatic. Here is a side-by-side view:
| Material | Primary Production CO₂ (per tonne) | Recycled Production CO₂ (per tonne) | Reduction |
|---|---|---|---|
| Carbon steel (BF-BOF vs. EAF) | ~1.987 t CO₂ | ~0.357 t CO₂ | ~82% |
| Aluminum | ~8.0 t CO₂ | ~0.5 t CO₂ | ~94% |
| Stainless steel (avg. vs. high-recycled) | ~6.0 t CO₂ | ~2.5 t CO₂ | ~58% |
Specifying EAF steel 9 or high-recycled-content stainless steel is the single most impactful sustainable fabrication practice you can adopt. The mechanical properties are equivalent. The cost difference is often negligible — and sometimes recycled content is cheaper because EAF mills have lower energy overhead.
When we co-develop a part with a client, we raise this question early in the design phase. Changing material after tooling is expensive. Changing it at the DFM stage costs nothing.
Process Optimization for Lower Emissions
Even after material selection, the way a part is cut, formed, and finished matters. Here is how different processes compare:
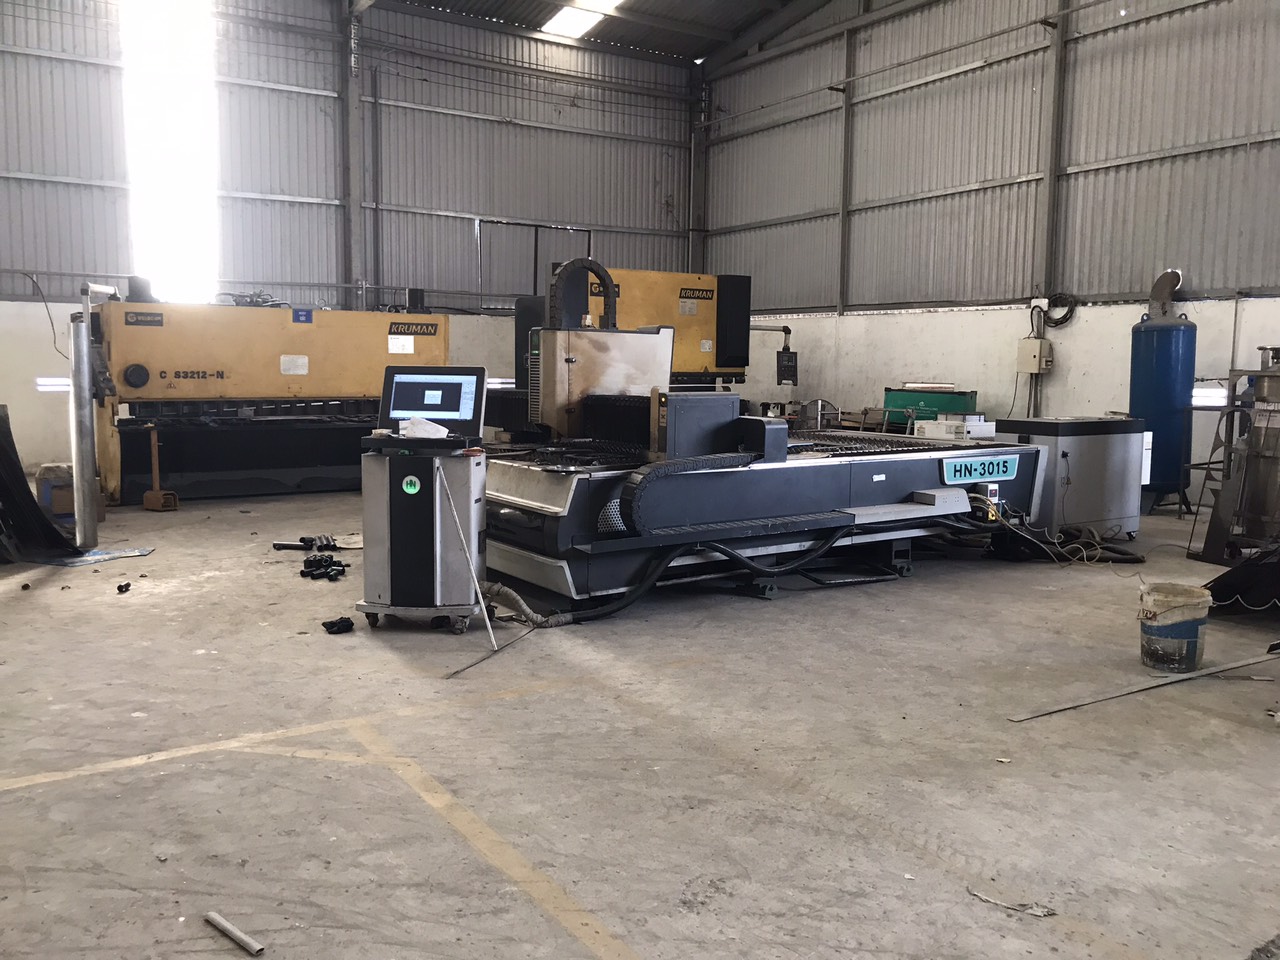
Cutting. Fiber laser cutting 10 uses roughly 50% less electricity than CO₂ laser cutting for the same job. CNC punching is also energy-efficient for high-volume simple geometries. We recommend fiber lasers for anything under 12 mm thickness.
Forming. Servo-electric press brakes consume energy only during the actual bend stroke, unlike hydraulic presses that run continuously. The energy savings can reach 50–70% per cycle.
Welding. Robotic welding cells deliver more consistent arc-on time and reduce overwelding — both of which lower energy use and filler material waste.
Finishing. Powder coating is a clear winner over wet paint. It produces zero VOC emissions, overspray is recoverable, and curing ovens can be optimized with better insulation and scheduling.
Nesting and Scrap Reduction
Advanced nesting software fits more parts per sheet, reducing material waste. A scrap rate below 5% is achievable for most geometries. Every kilogram of scrap avoided means you never had to produce, ship, or recycle that kilogram. This directly shrinks the product carbon footprint.
Our engineering team reviews nesting layouts before production begins. Sometimes a small rotation or mirror of a part saves an entire sheet's worth of material across a large order. This is process optimization at the design level — not the factory level — and it is one of the most underused tools in green manufacturing.
Recycled Metal Accounting Methods
One complexity worth understanding: how you account for recycled metal content changes your footprint number. Three main approaches exist:
| Method | How It Works | Best For |
|---|---|---|
| Cut-Off | Treats incoming scrap as zero-emission ("burden-free") | Simple reporting; incentivizes use of recycled input |
| Substitution | Credits upstream avoided emissions when scrap replaces primary metal | Showing full lifecycle benefit; aligns with circular economy principles |
| Co-Product Allocation | Assigns scrap the same footprint as the original product | High-traceability supply chains |
We recommend discussing the method with your compliance or sustainability team before reporting. Consistency matters more than which method you pick — just use the same one across all products.
How can I lower the carbon emissions of my sheet metal supply chain while maintaining strict quality control?
During a recent project shipping protective housings from Vietnam to the eastern U.S., we faced a real trade-off: a closer supplier had a lower transport carbon footprint, but their first-pass yield was 15 percentage points lower. The rework and air-freight corrections would have wiped out every gram of CO₂ saved on the initial shipment.
To lower carbon emissions across your sheet metal supply chain without sacrificing quality, consolidate shipments to reduce freight GHG emissions, localize sourcing where feasible, integrate carbon metrics into ERP and inspection workflows, and ensure first-time-right production through rigorous PPAP and in-process controls — because rework is the enemy of both quality and sustainability.
Why "Right First Time" Is the Best Carbon Strategy
Rework doubles the carbon. Think about it: if a batch fails final inspection and must be re-cut, re-formed, or re-welded, every kWh, every kilogram of material, and every transport mile gets spent twice. In our experience managing custom parts across Asia, the number one driver of excess carbon in the supply chain is poor quality — not poor logistics.
Our quality process starts before metal is cut. We run a full PPAP (Production Part Approval Process) with every new supplier and every new part. This includes dimensional studies, material certifications, and process capability analysis. We inspect at first article, in-process, and final stages. The goal is simple: no surprises. When we get it right the first time, we eliminate the rework loop — and with it, a hidden but significant chunk of GHG emissions.
Logistics: Consolidate, Optimize, Track
Sea freight produces roughly 7.9 g CO₂ per tonne-km. Air freight produces roughly 500 g CO₂ per tonne-km — over 60 times more. Every time a quality failure forces an air shipment to meet a deadline, the carbon footprint explodes.
Here is how we manage logistics to keep emissions down:
- Consolidation. We group multiple orders into full container loads (FCL) instead of shipping less-than-container (LCL). This reduces per-unit transport emissions and cost.
- Route optimization. Direct shipping lanes from Vietnam to the U.S. West Coast are shorter than routing through transshipment hubs.
- Packaging efficiency. Reusable steel stillages and properly designed inner packaging reduce damage — which reduces returns, which reduces re-shipments.
Digital Tools for Real-Time Footprint Visibility
We are increasingly integrating carbon tracking into our project management workflow. Tools like Climatiq API let us estimate emissions at the quoting stage — before a single sheet of metal is cut. This gives our clients the data they need for supply chain decarbonization reporting and for comparing design options.
Some forward-thinking companies are embedding carbon costing directly into their ERP and MRP systems. This means every purchase order automatically calculates an estimated CO₂ cost alongside the financial cost. It changes how people make decisions. When the carbon cost of air freight shows up next to the dollar cost, the purchasing manager pushes harder for on-time production — and that pushes the factory toward better process control.
Renewable Energy and Facility-Level Improvements
At the facility level, the shift toward renewable energy sources is accelerating across Southeast Asia. Several of our partner factories in Vietnam have installed rooftop solar panels, which offset 10–20% of their grid electricity consumption. Vietnam's grid is still heavily coal-dependent, so every kWh replaced by solar has an outsized impact on the product carbon footprint.
Other facility-level steps include LED lighting, variable-frequency drives on motors, and waste heat recovery from curing ovens. These seem small individually, but they compound. A factory that pursues energy efficiency across every process step can cut its manufacturing carbon intensity significantly over two to three years.
Balancing Cost, Carbon, and Quality
The real challenge is not choosing between low carbon and high quality. It is building a system where they reinforce each other. Factories that track energy and waste tend to track quality, too. Suppliers who invest in renewable energy tend to invest in better equipment. And purchasing managers who demand carbon data tend to get more transparent, more disciplined partners.
Our approach is straightforward: we treat carbon as another dimension of quality. We audit for it, measure it, and report it — just like we do for dimensional tolerances and surface finishes.
Conclusion
Calculating and reducing the carbon footprint of sheet metal fabricated products requires clear boundaries, real data, smart material choices, and disciplined quality control — because sustainable fabrication practices and right-first-time manufacturing are two sides of the same coin.
Frequently Asked Questions
How can I accurately calculate the total carbon footprint of my custom sheet metal components?
A purchasing manager we work with in the Midwest once asked us for a product carbon footprint 2 report on a batch of stainless steel mounting brackets — and that single request reshaped how our entire team approaches carbon accounting for custom parts.
What criteria should I use to vet the environmental impact of my sheet metal fabrication partners in Asia?
Last year, one of our U.S. clients asked us to audit a potential press brake supplier in northern Vietnam — not just for dimensional accuracy, but for their energy sources and waste handling. That request taught us that vetting environmental impact requires the same rigor we apply to PPAP and first-article inspection.
Which material choices and manufacturing processes will help me reduce the embedded carbon in my sheet metal designs?
The biggest lesson we learned during a bracket redesign project was blunt: swapping from primary aluminum to recycled aluminum cut the part's embedded carbon by over 75% — without changing a single dimension on the drawing.
Footnotes
1. Explains what emission factors are and their role in carbon accounting. ↩︎
2. Defines product carbon footprint and its importance in sustainability. ↩︎
3. Found a relevant and detailed explanation of cradle-to-gate from iPoint-systems, a similar domain to the original broken link. ↩︎
4. Clarifies the role of a functional unit in life cycle assessment for comparisons. ↩︎
5. Provides direct access to the official website of the World Steel Association. ↩︎
6. Links to the official website of the International Energy Agency. ↩︎
7. Explains the international standard for environmental management systems. ↩︎
8. Describes the EU’s mechanism for carbon pricing on imported goods. ↩︎
9. Explains Electric Arc Furnace steelmaking and its environmental benefits. ↩︎
10. Describes the technology and advantages of fiber laser cutting. ↩︎