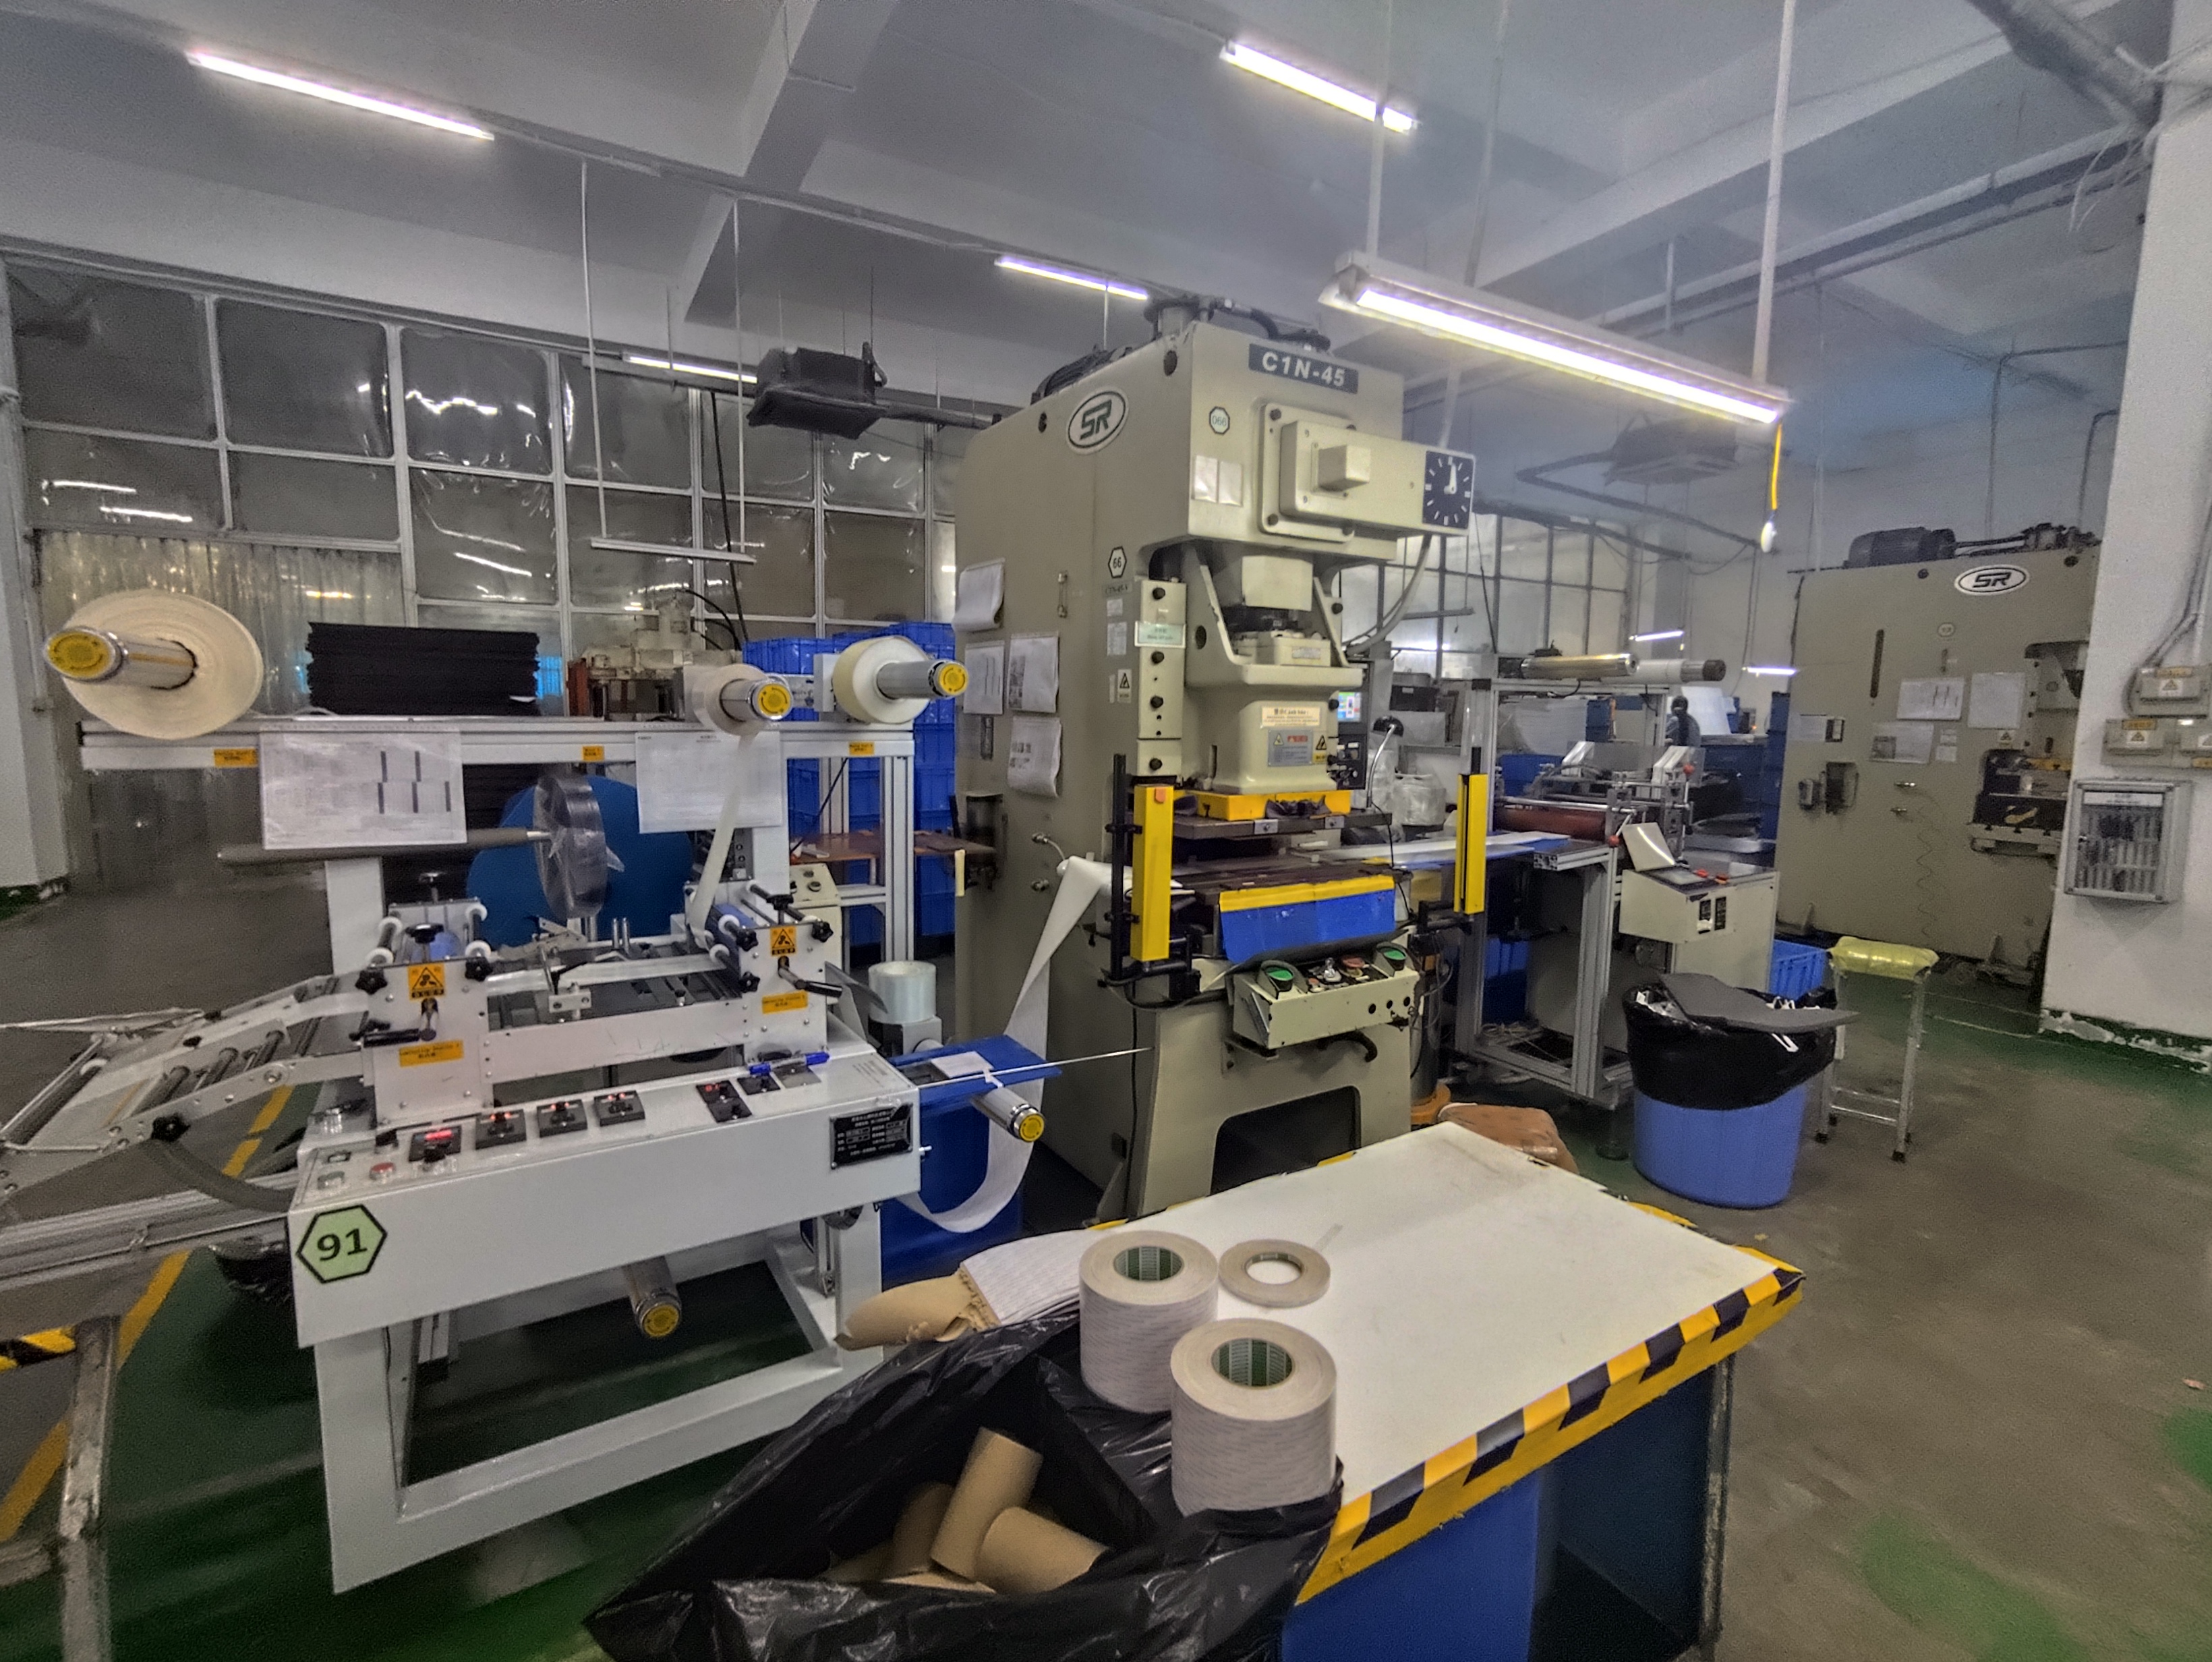
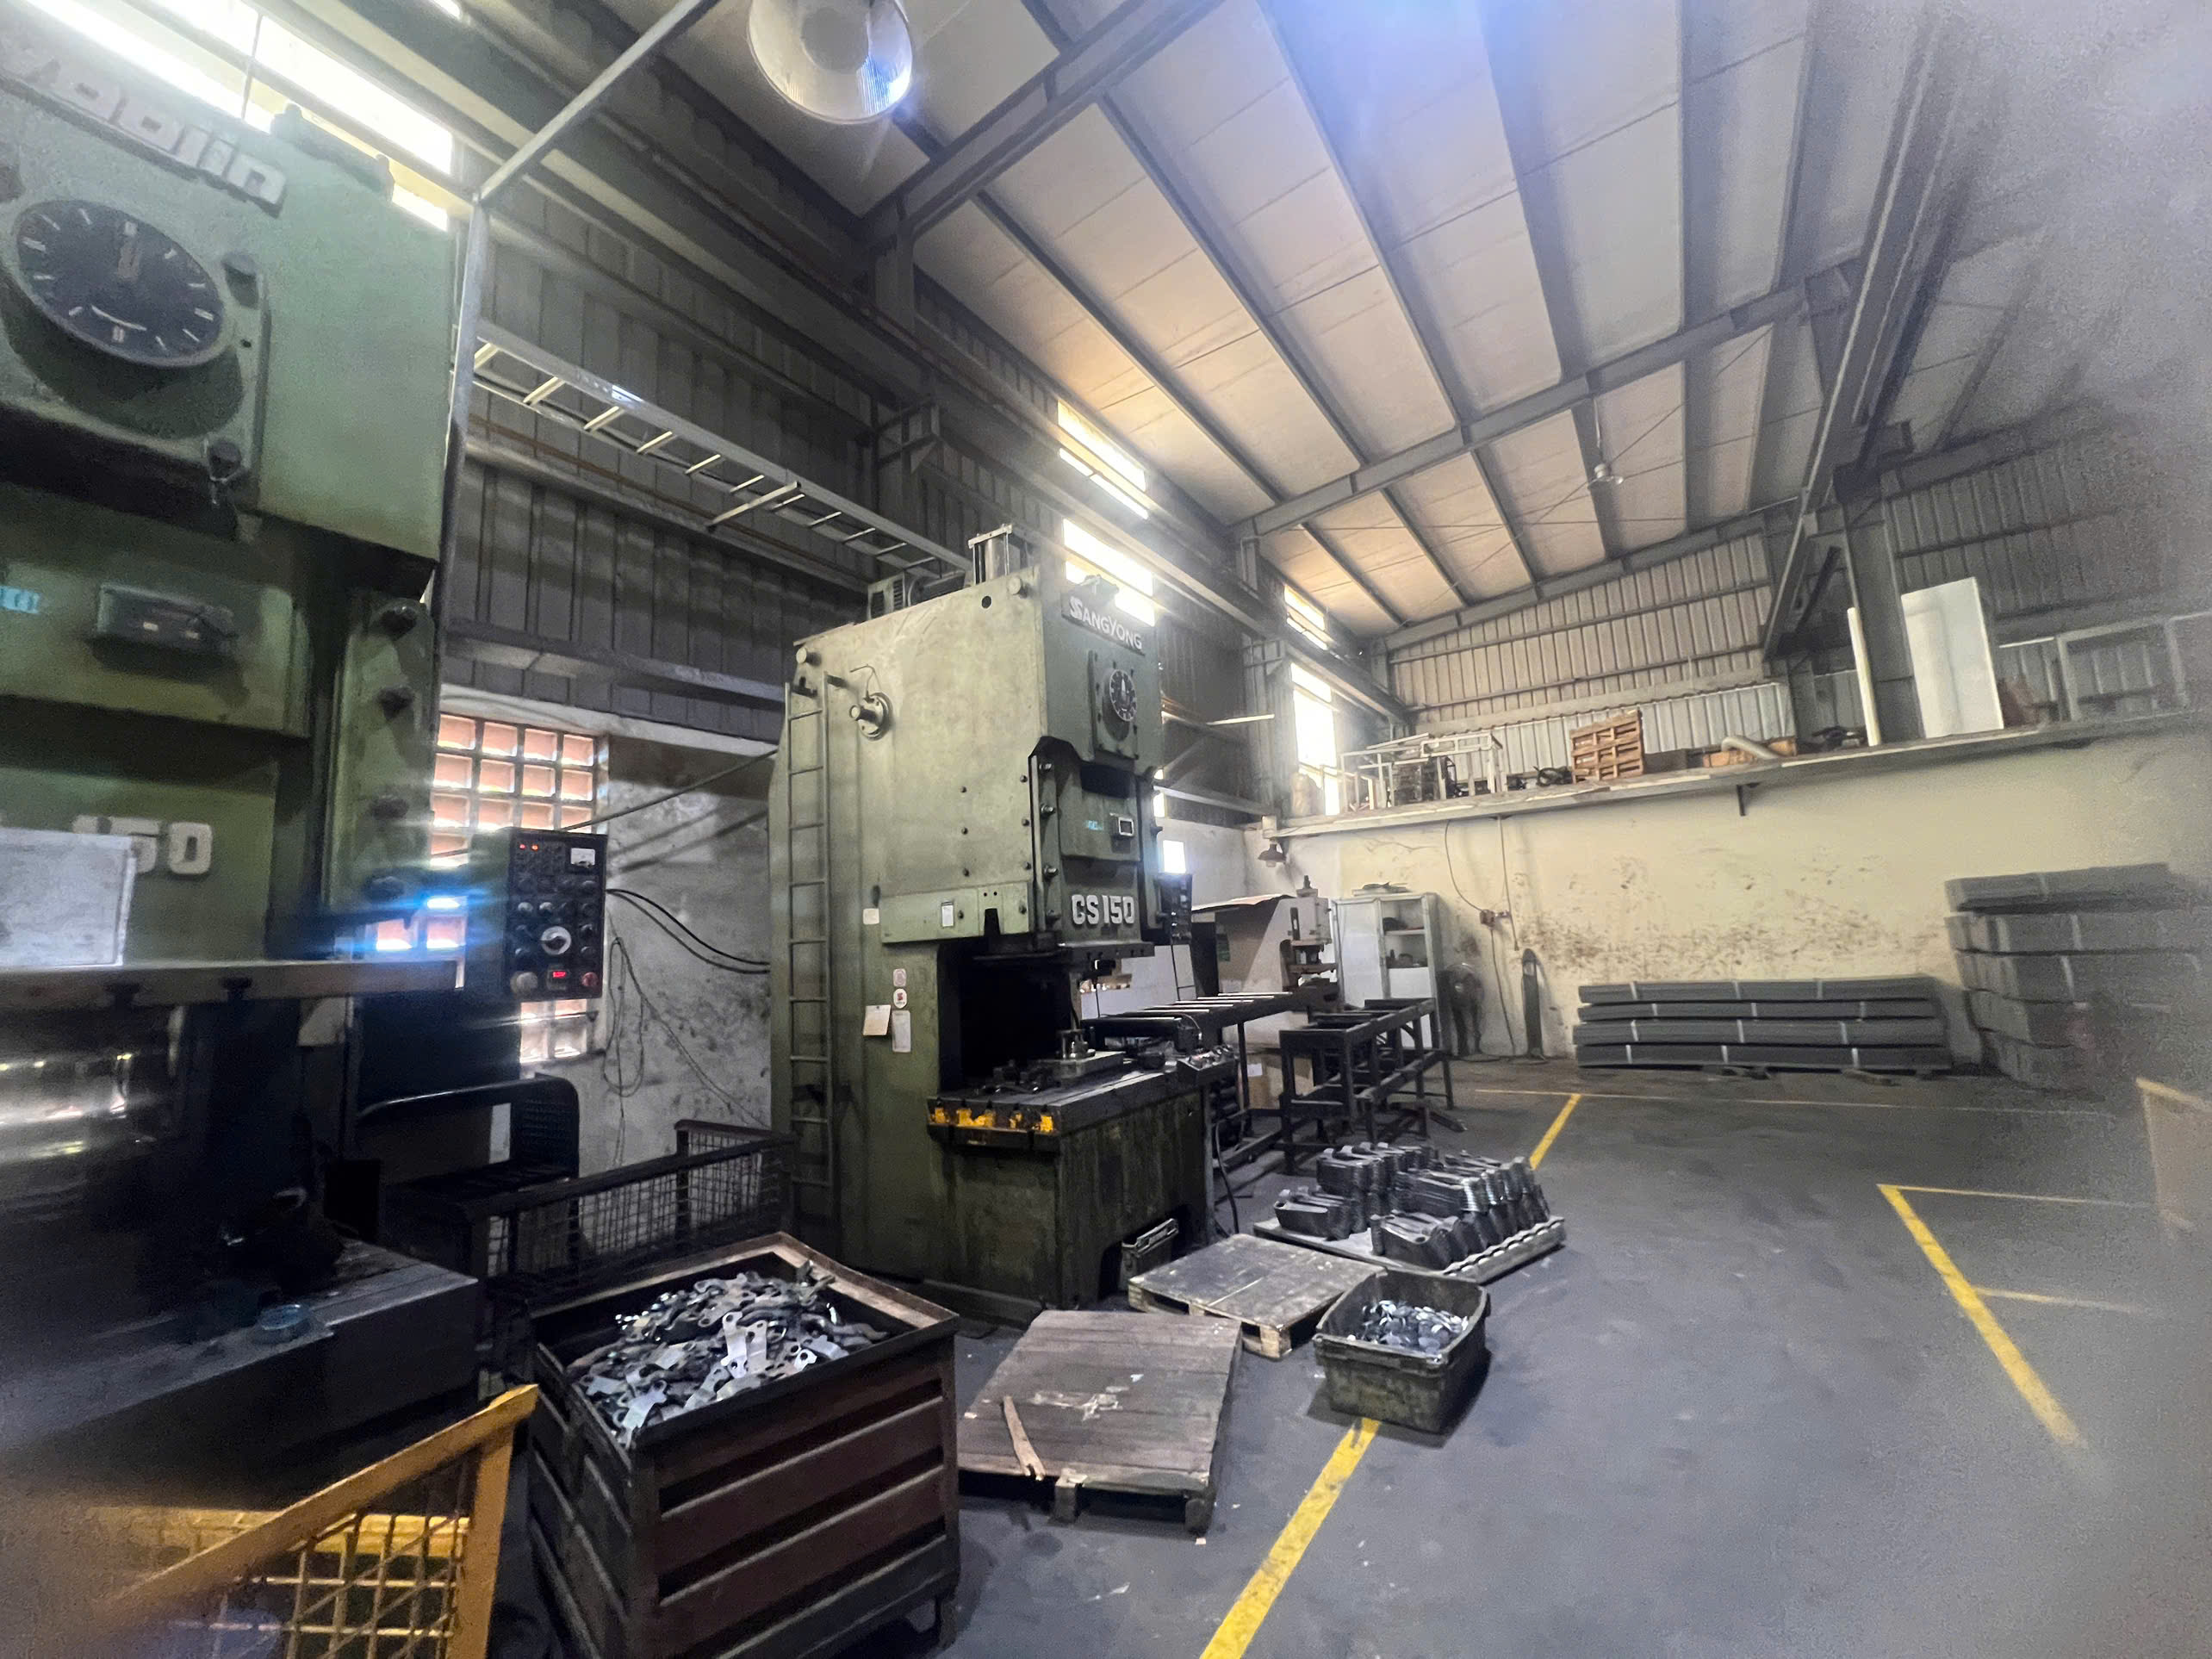
Every procurement budget I have reviewed for stamping parts has one thing in common — the first draft always underestimates the true cost supply chain optimization 1. Buyers fixate on the per-piece price, skip over tooling amortization 2, ignore logistics risks, and then scramble when invoices arrive 20–30% higher than planned. This gap between expectation and reality is where projects stall, relationships fracture, and margins evaporate.
A realistic procurement budget for sourcing stamping parts must capture total landed cost — not just piece price — by accounting for material (40–60% of total cost), tooling amortization, quality compliance, logistics, and a 10–15% buffer for raw material pricing volatility, with volume crossover analysis guiding the stamping-versus-fabrication decision.
Below, I will walk through the exact cost estimation methods and budget structures we use when helping U.S. clients source custom stamping parts from Asia. Each section tackles a specific budget pillar so you can build a procurement plan that holds up in the real world.
How do I accurately calculate the total landed cost for my custom stamping project?
A lesson we learned early in our sourcing work: two suppliers quoting the same part at wildly different prices often means they are quoting different scopes, not different margins.
To calculate total landed cost, sum five direct cost pillars — material, labor, tooling amortization, quality/inspection, and packaging/logistics — then add overhead expenses, import duties, and a contingency buffer; comparing suppliers on piece price alone will mislead your procurement budget every time.
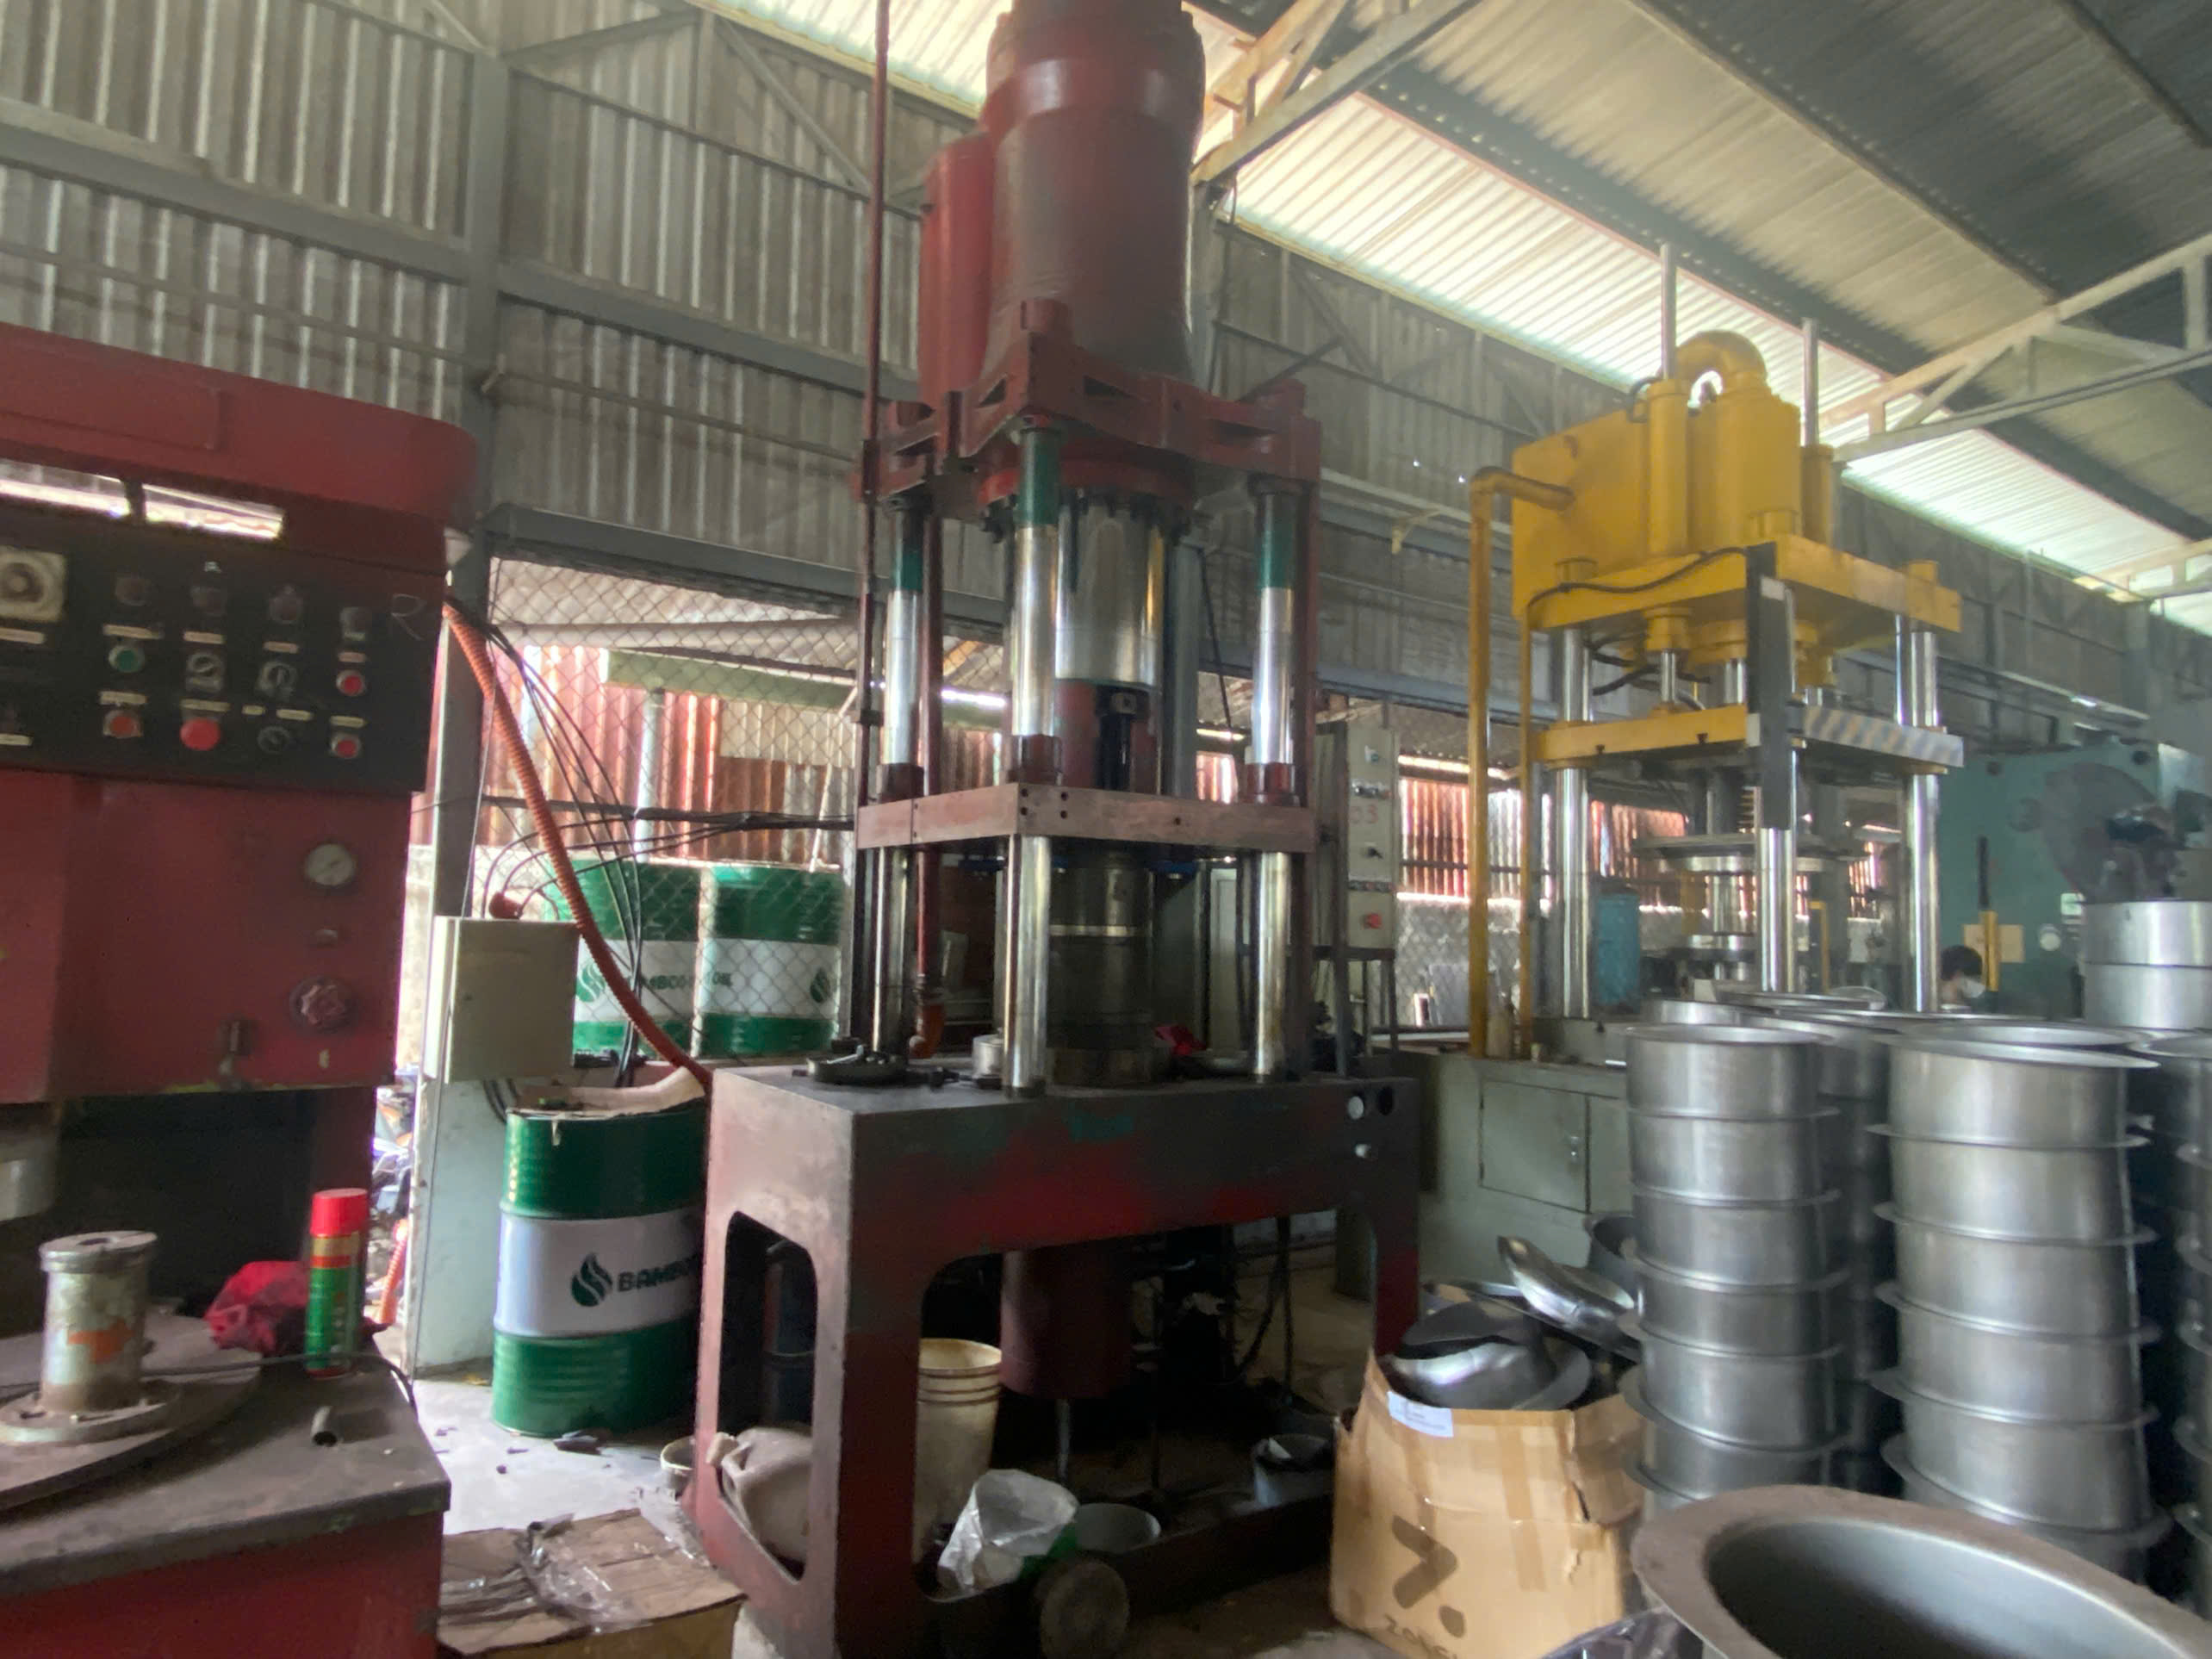
The Five Pillars of Direct Cost
Most buyers receive a single-line quote: "$0.35 per piece." That number hides a lot. Here is how we break it down internally before we even send an RFQ to a stamping supplier.
Material is the dominant cost driver. On a typical carbon steel bracket — say 2 mm thick, 80 mm × 60 mm blank — we calculate the theoretical weight first. Multiply the blank area by thickness, then by material density (7.85 g/cm³ for mild steel). That gives you the net weight. Then factor in material utilization — the percentage of the coil or sheet that actually becomes parts versus scrap. A well-designed progressive die 3 achieves 75–85% utilization. A poorly nested blank layout might waste 30% or more.
Labor covers press operation, feeding, and any manual secondary operations like deburring or bending. Automation reduces this cost sharply, but many mid-tier suppliers still rely on semi-automatic setups.
Tooling amortization spreads your upfront die investment across the production volume. A $25,000 progressive die amortized over 500,000 parts adds $0.05 per piece. The same die amortized over 50,000 parts adds $0.50 per piece. Volume changes everything.
Quality and inspection includes incoming material verification, in-process SPC checks, final inspection, and any documentation like PPAP submissions 4. These are real labor and equipment costs.
Packaging and logistics covers inner packaging (anti-rust paper, foam dividers), carton or crate packing, freight from factory to port, ocean freight, customs clearance, and final delivery.
A Sample Total Landed Cost Breakdown
| Cost Element | % of Total Landed Cost 5 | Example (USD) |
|---|---|---|
| Raw material | 40–60% | $0.18 |
| Labor (press + secondary ops) | 10–15% | $0.05 |
| Tooling amortization | 5–15% | $0.05 |
| Quality control & documentation | 3–5% | $0.02 |
| Packaging | 2–4% | $0.01 |
| Freight & logistics | 8–12% | $0.04 |
| Import duty & customs fees | 3–6% | $0.02 |
| Overhead & contingency | 5–8% | $0.03 |
| Total Landed Cost | 100% | $0.40 |
Notice the piece price from the supplier might be $0.31 (material + labor + tooling + quality + packaging). The remaining $0.09 — nearly 23% of the real cost — comes from logistics, duties, and overhead. Ignoring that gap is the most common budgeting mistake I see.
Quote Assumptions: The Silent Budget Killer
When we evaluate quotes on behalf of our clients, we compare the assumptions behind each number. One supplier may assume ±0.1 mm tolerance. Another assumes ±0.05 mm, which requires tighter die clearances and slower press speeds. Both say "$0.35," but the second supplier will deliver a more precise part at the same price — or the first supplier will ship parts that fail your incoming inspection.
We always request a detailed cost breakdown with every quote. If a supplier refuses, that is a red flag. Transparency in cost estimation methods is a basic supplier evaluation criterion.
What hidden tooling and prototyping expenses should I include in my initial stamping budget?
On a recent project involving a stainless steel mounting clip, our client's original budget allocated $8,000 for tooling. The actual tooling cost — including prototyping iterations, design revisions, and the final production die — came to $19,500. That gap nearly derailed the project timeline.
Your initial stamping budget must include prototype tooling (soft tools or 3D-printed samples), production die design and build, die trials and first-article adjustments, ongoing die maintenance reserves, and eventual die replacement — treating tooling as a lifecycle cost, not a one-time purchase.
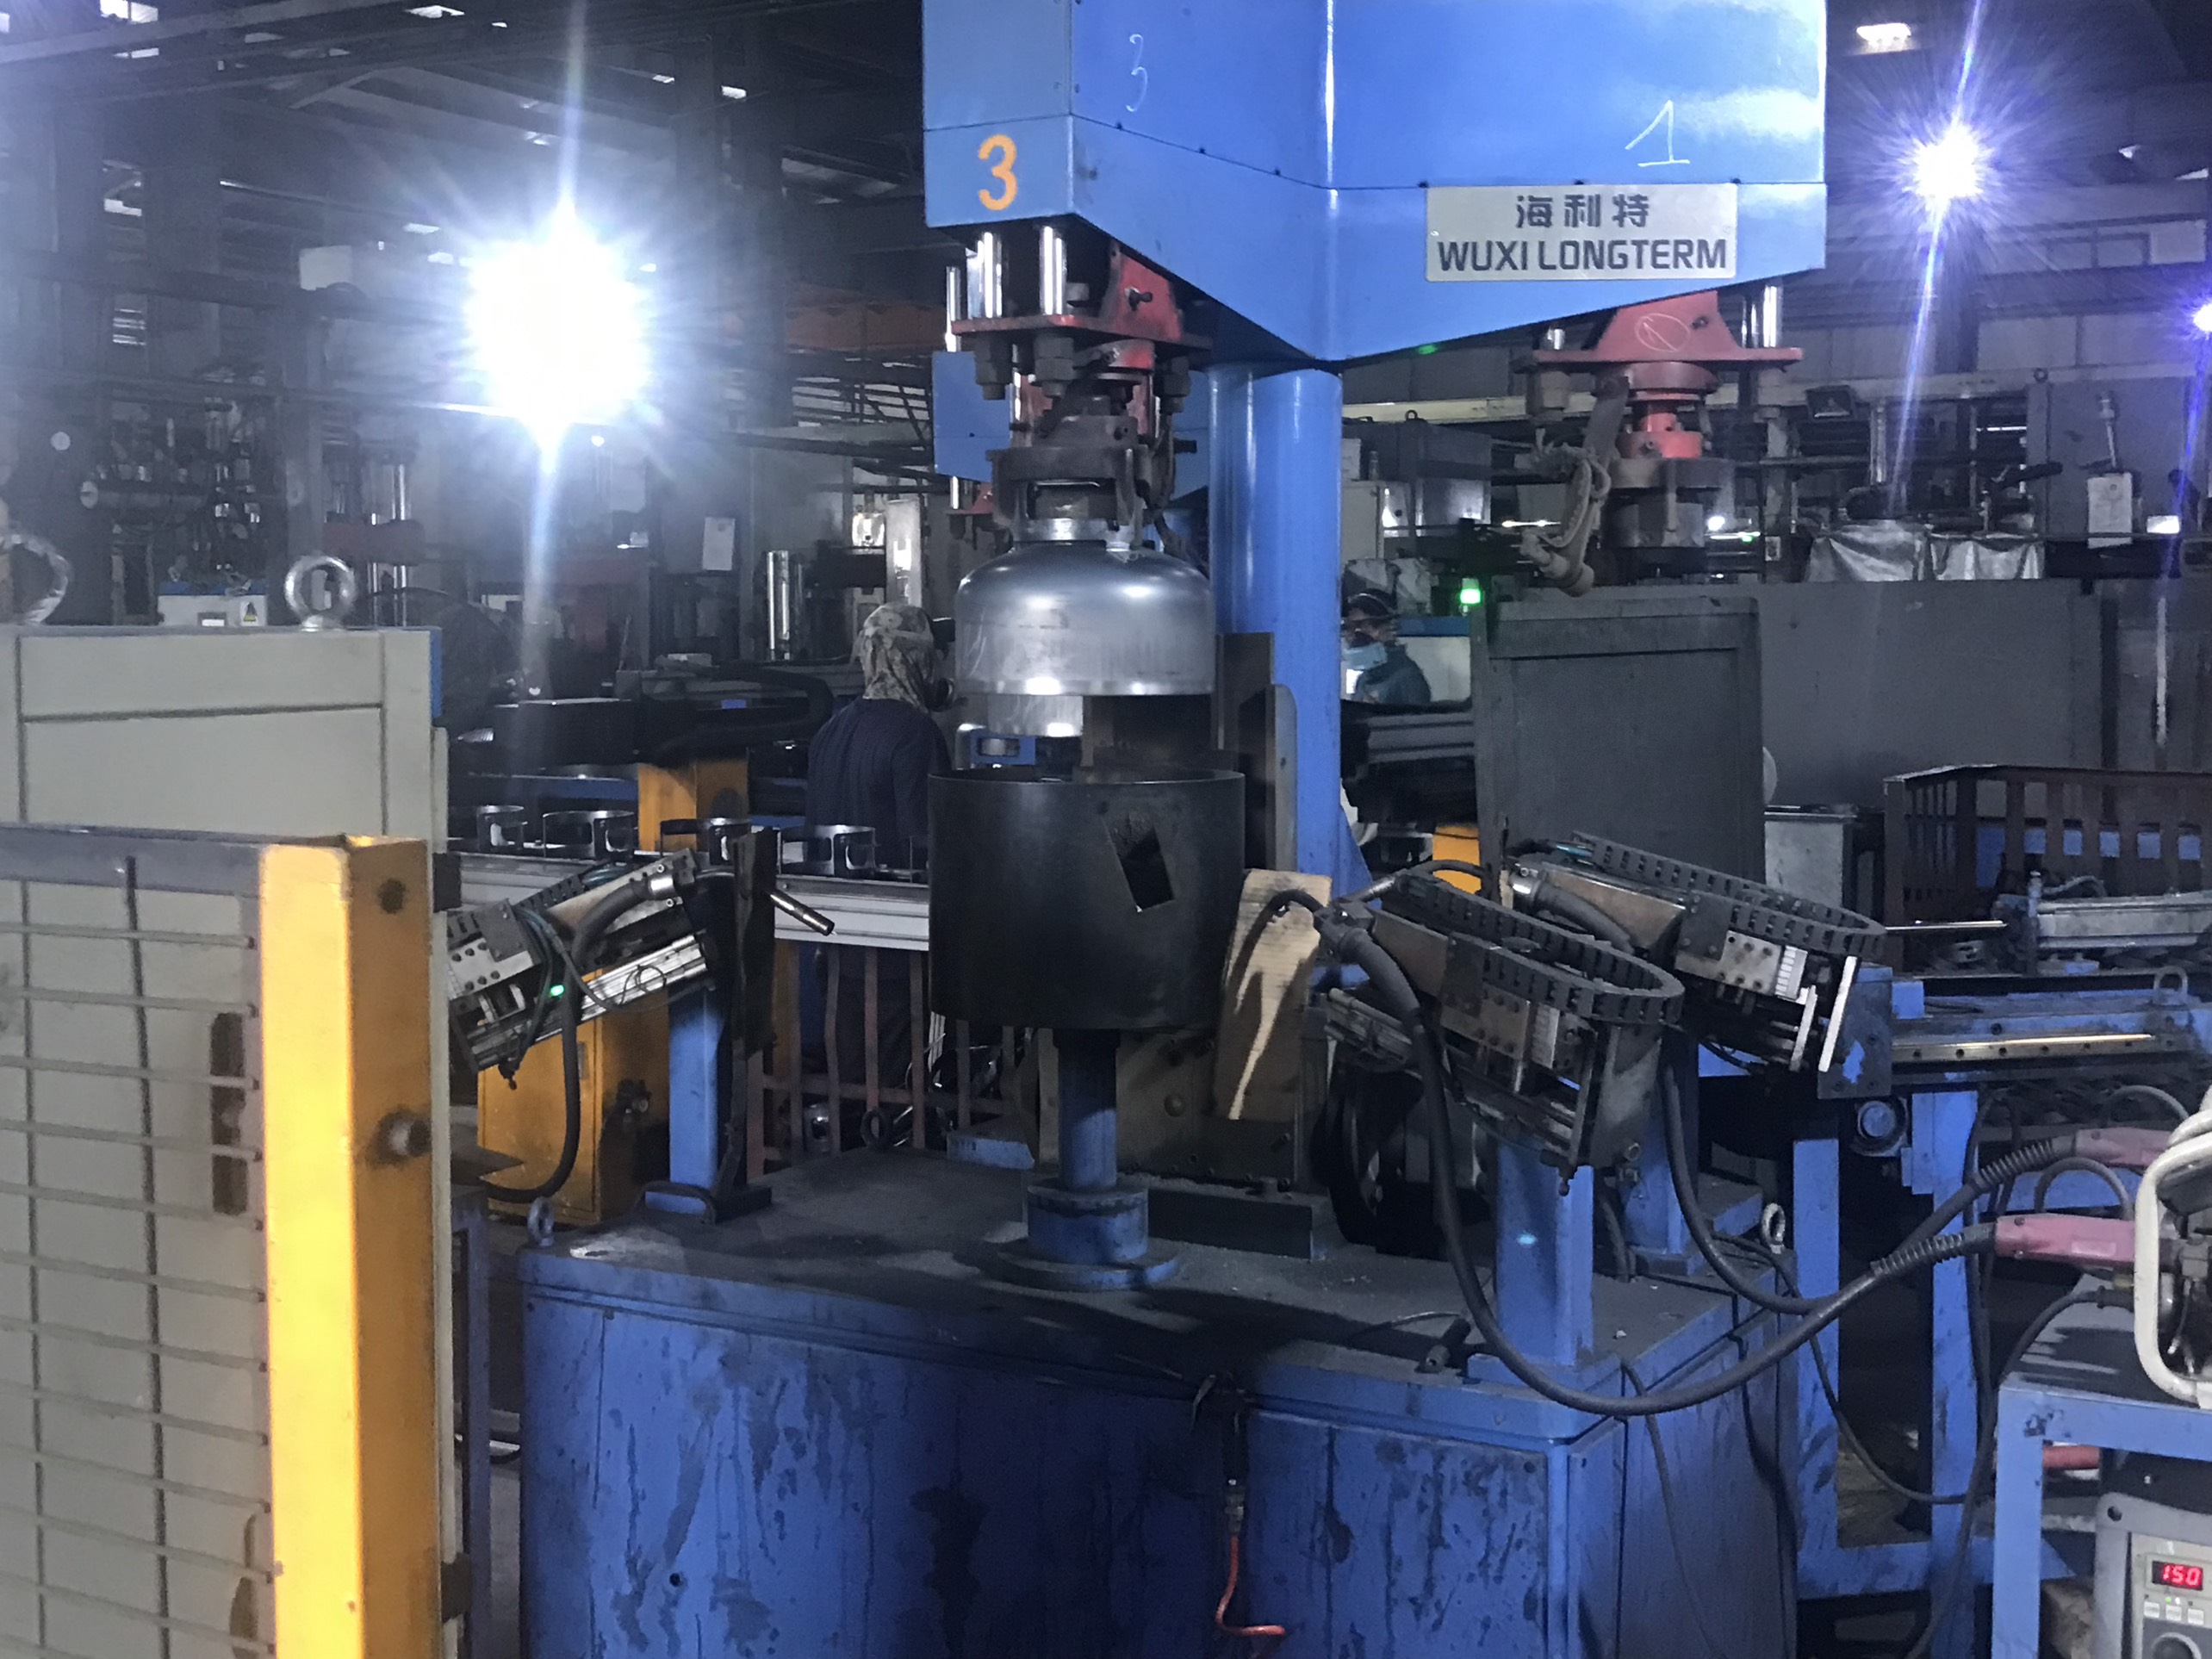
Engineering Dies vs. Progressive Dies
The type of die you need depends on your production volume and part complexity. This is where the production volume impact on your budget becomes most visible.
| Die Type | Best For | Typical Cost (USD) | Expected Lifespan (hits) | Per-Part Cost at 10K pcs | Per-Part Cost at 500K pcs |
|---|---|---|---|---|---|
| Engineering die (single-stage) | Low volume, simple parts | $3,000–$8,000 | 50,000–200,000 | $0.30–$0.80 | $0.006–$0.016 |
| Compound die | Medium volume, flat parts | $8,000–$20,000 | 200,000–500,000 | $0.80–$2.00 | $0.016–$0.04 |
| Progressive die | High volume, complex parts | $15,000–$60,000+ | 500,000–2,000,000+ | $1.50–$6.00 | $0.03–$0.12 |
At low volumes, a progressive die looks expensive. But at 500,000 parts, its per-part tooling cost drops to a few cents. This is the crossover logic. For most stamped parts, the volume crossover point falls between 3,000 and 7,000 parts per year. Below that threshold, fabrication methods like laser cutting and CNC bending often cost less on a total-cost basis. Above it, stamping wins — and the advantage grows exponentially. After tooling payoff, stamping can reduce ongoing production costs by up to 99.3% compared to fabrication.
Prototyping: Budget for Iteration
Most projects need at least two rounds of prototyping before production tooling begins. Soft tooling or 3D-printed samples cost $500–$3,000 depending on complexity. Wire-EDM prototypes cost more but give you parts closer to production quality.
I always recommend budgeting for at least one design revision during prototyping. Design for manufacturability 6 feedback from the stamping supplier often reveals features that are expensive to produce — thin sections that accelerate die wear, asymmetric forms that cause strip-feeding issues, or tolerances tighter than the application actually requires. Our engineering team in Vietnam and China reviews every drawing before quoting to catch these issues early. Early supplier involvement in the design phase can save 10–20% on final production costs.
Die Maintenance Is Not Optional
A die is not a "buy it and forget it" asset. Preventive maintenance 7 — sharpening cutting edges, replacing worn inserts, re-aligning guide pins — is essential. We typically advise clients to budget 5–8% of the original tooling cost per year for maintenance. For a $30,000 progressive die running 1 million hits per year, that is $1,500–$2,400 annually.
Skipping maintenance leads to burr formation, dimensional drift, and eventually catastrophic die failure. That is far more expensive than scheduled upkeep.
The Economic Viability Threshold
Stamping becomes economically viable when annual volumes exceed 50,000 pieces or when the current method costs $2–$3 per part. If your current fabrication cost is $2.50 per piece and you need 20,000 parts per year, a progressive die investment will likely pay for itself within the first production run.
How can I structure my procurement costs to ensure strict quality control and PPAP compliance?
During a recent supplier audit at a stamping facility in Vietnam, we discovered that the factory had no documented inspection plan for a bracket they had been producing for six months. The parts looked fine — until our client's incoming QC team measured flatness and found 12% of the lot out of spec. That single quality escape cost more than the entire production run's profit margin.
Structure your procurement costs with dedicated line items for incoming material inspection, in-process SPC, final inspection labor, PPAP documentation (including PFMEA, control plans, and dimensional reports), and gauge calibration — quality control is not overhead; it is a direct production cost that prevents far more expensive failures downstream.
What Does Quality Actually Cost?
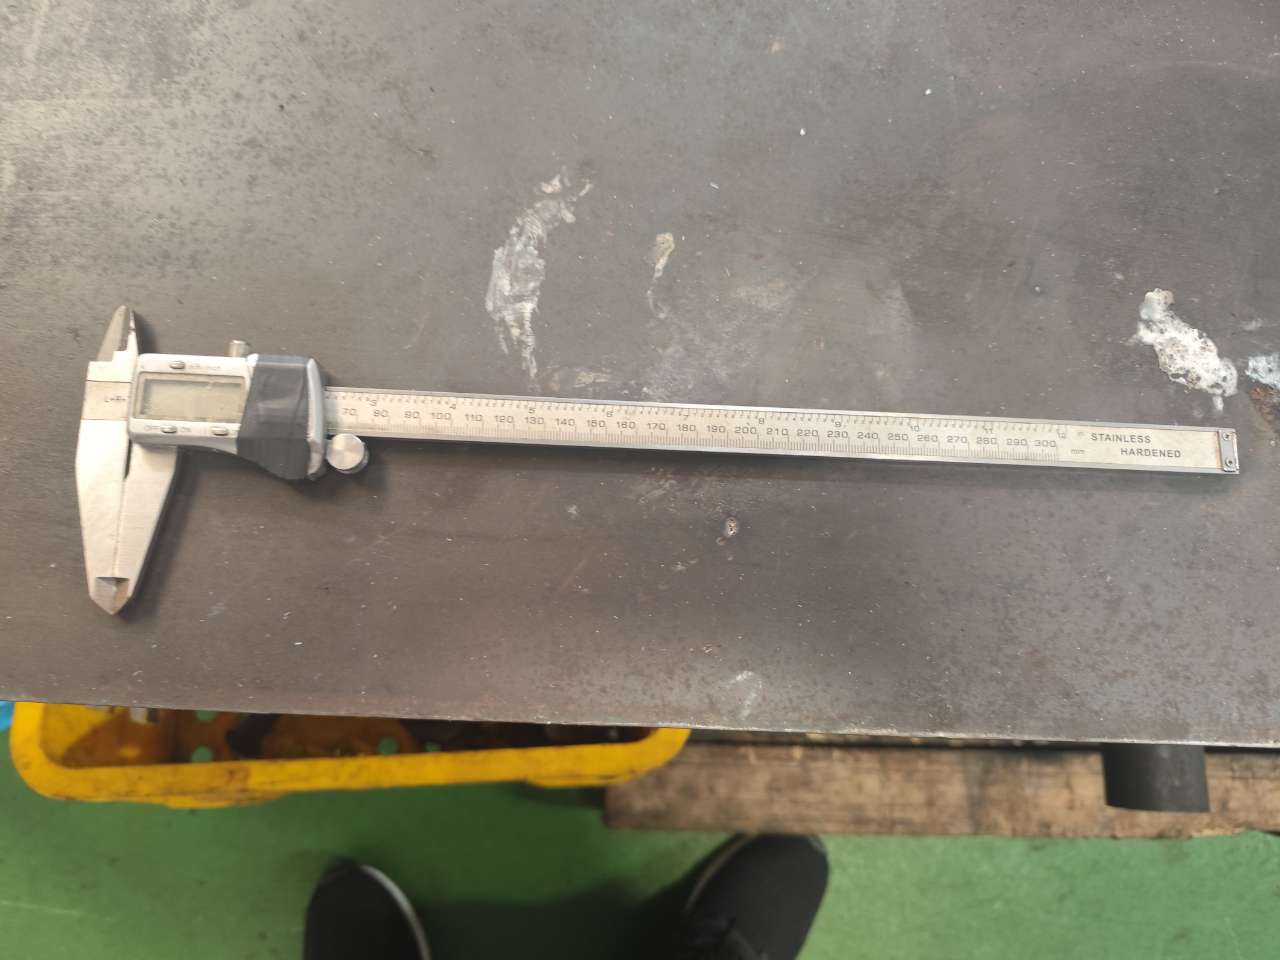
Quality control standards in stamping go far beyond a visual check at the end of the line. Here is what a proper quality program includes and what each element costs.
| Quality Activity | Frequency | Typical Cost Impact |
|---|---|---|
| Incoming material certification review | Every coil/batch | $50–$150 per batch |
| First-article dimensional inspection | Every die setup | $100–$300 per setup |
| In-process SPC (Cpk monitoring) | Continuous or hourly | $0.005–$0.02 per part |
| Final inspection (AQL sampling) | Every shipment | $150–$500 per lot |
| PPAP Level 3 package preparation | One-time per part number | $1,000–$5,000 |
| Gauge R&R and calibration | Annual | $300–$1,000 per gauge |
| PFMEA development | One-time per process | $500–$2,000 |
These are real costs. If a supplier does not include them, they are either not doing them or hiding them in the piece price without accountability.
PPAP: The Price of Getting It Right the First Time
Our U.S. clients increasingly require Level 3 PPAP submissions. This includes dimensional results on initial samples, material certifications, process flow diagrams, control plans, PFMEA documentation 8, and capability studies. Preparing this package properly takes 40–80 hours of engineering and quality labor.
I see some suppliers treat PPAP as a checkbox exercise — copying templates, inflating Cpk numbers, skipping gauge R&R studies. That approach fails the moment the customer audits the data. We manage the PPAP process directly through our quality teams in Vietnam and China. We verify every data point before it goes to the client. That is what "right first time" actually requires.
Structuring Quality Costs in Your Budget
Do not lump quality into "overhead expenses." Break it out. Here is a simple structure:
- Pre-production quality: Prototype inspection, PPAP preparation, gauge procurement. Budget this as a one-time project cost.
- Production quality: In-process SPC, operator training, final inspection labor. Budget this as a per-piece or per-lot cost.
- Ongoing compliance: Gauge calibration, annual PFMEA reviews, customer audit preparation. Budget this as an annual fixed cost.
When quality is a visible line item, everyone — buyer, supplier, and quality team — takes it seriously. When it is buried in overhead, it is the first thing that gets cut when margins tighten. And that is when defects start shipping.
Our approach is to embed quality costs directly into the production cost model. This transparency is one of the supplier evaluation criteria that distinguishes reliable partners from price-focused shops.
How do I account for material price fluctuations and logistics risks in my long-term sourcing plan?
In early 2022, we had a client locked into a fixed-price annual contract for stamped stainless steel components. Then nickel prices spiked 250% in a single week. The supplier requested an immediate price increase. The client's contract had no price adjustment clause. The dispute took three months to resolve and disrupted production for an entire quarter.
Account for material price fluctuations by building a 10–15% cost buffer into your budget, linking contract pricing to published raw material pricing indices, using blanket purchase orders with scheduled releases, and diversifying logistics routes — supply chain optimization requires planning for volatility, not assuming stability.
Material Volatility: Plan for It, Do Not Ignore It
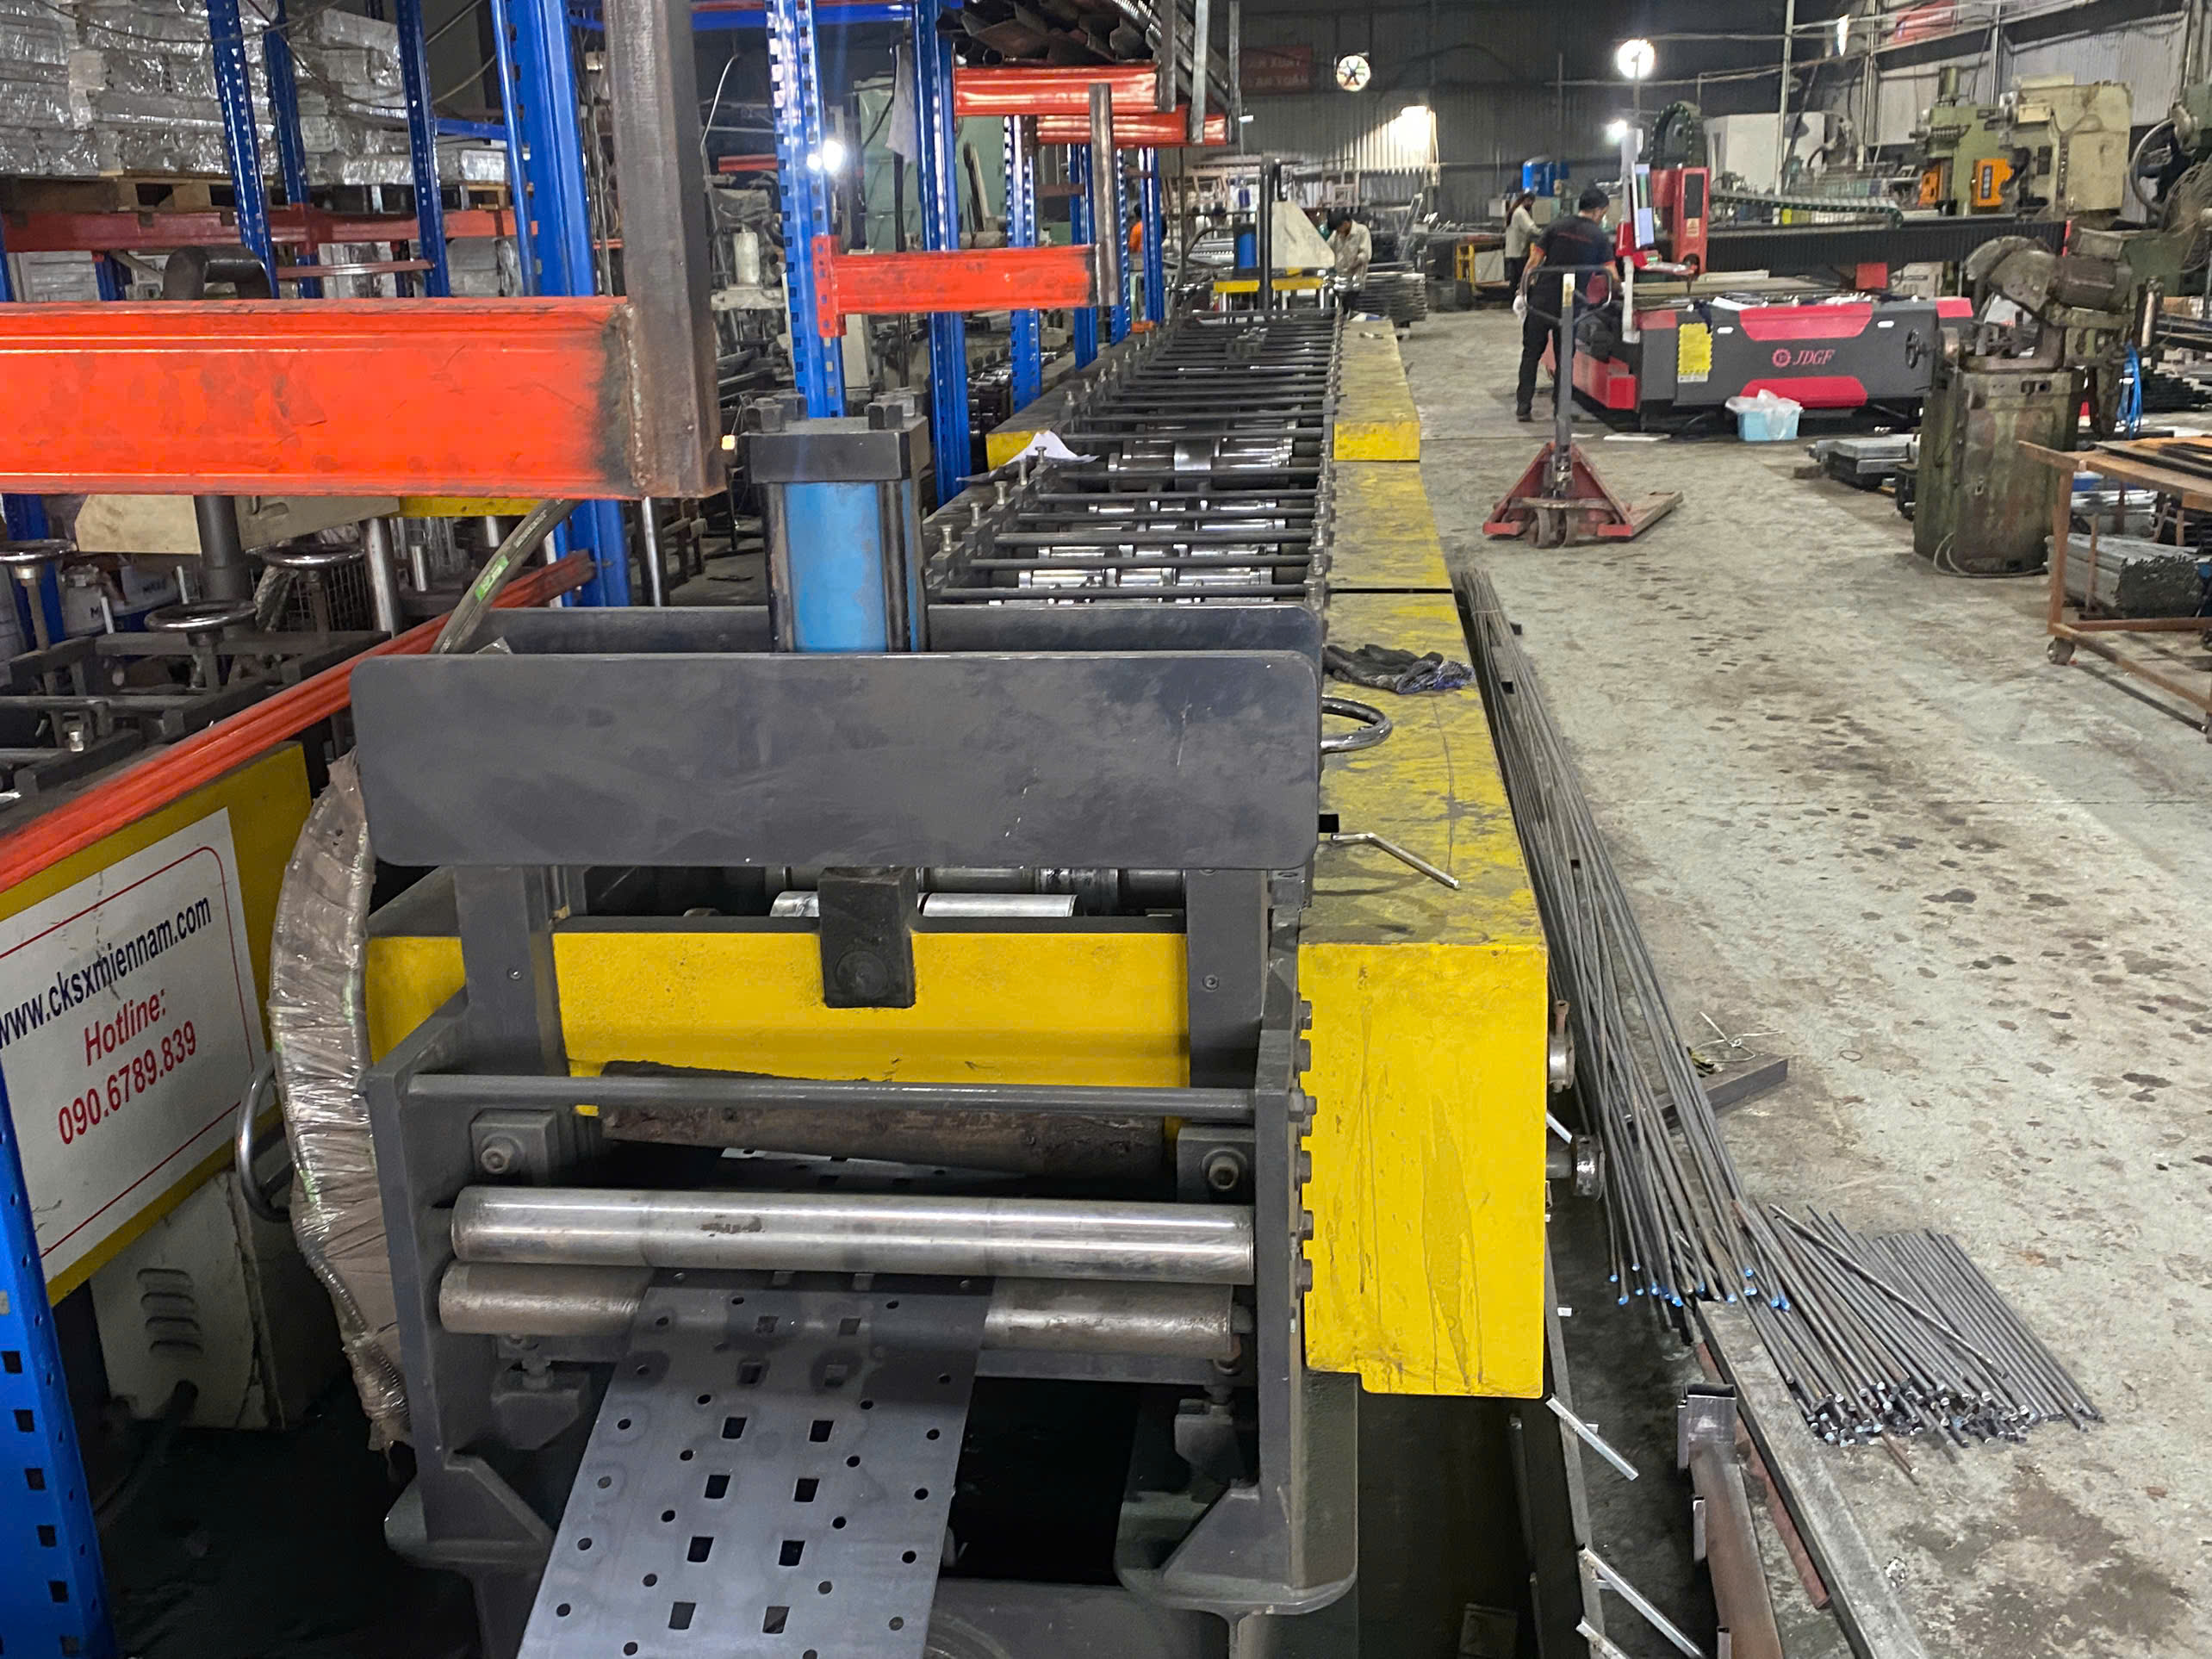
Steel, aluminum, copper, and stainless steel prices fluctuate based on global supply, energy costs, trade policies, and currency movements. A procurement budget built on today's spot price will be wrong in six months. The question is whether it will be wrong by 5% or by 40%.
We recommend three strategies, used together:
Index-linked pricing. Tie your contract price to a published material index — for example, the LME (London Metal Exchange) price for copper or the CRU index for hot-rolled steel. raw material pricing indices 9 When the index moves, your piece price adjusts proportionally. This protects both buyer and supplier.
Blanket purchase orders with scheduled releases. Place a blanket order for the annual volume. blanket purchase orders 10 The supplier buys material in bulk when prices are favorable. You release shipments monthly or quarterly. This locks in material cost without locking in delivery schedules. Lead time management becomes more predictable.
Budget buffer of 10–15%. Even with index-linked pricing, there are lags and rounding effects. A buffer absorbs minor fluctuations without triggering contract renegotiations.
Logistics Risks: The Costs You Cannot See in a Quote
International sourcing adds logistics layers that domestic procurement does not face. Here are the risks and how to budget for them.
Shipping delays are common. Ocean freight transit times from Southeast Asia to the U.S. West Coast range from 18 to 30 days. Port congestion, container shortages, or weather events can add 10–20 days. Budget for safety stock equal to at least one additional shipment cycle.
Tooling maintenance delays are a hidden risk with overseas suppliers. If a die breaks, the repair happens 8,000 miles away. Turnaround time can be 2–4 weeks. We mitigate this by managing tooling maintenance schedules proactively through our local teams.
Geopolitical risks affect tariffs, trade restrictions, and supply continuity. Diversifying your supplier base across multiple countries — not just multiple factories in one country — reduces exposure. This is why several of our clients source from both Vietnam and other Asian markets outside China, spreading risk while maintaining cost competitiveness. For a deeper look at this strategy, see our guide on choosing between single and multi-source procurement.
Building a Risk-Aware Budget Model
A practical approach is scenario planning. Model three scenarios: best case, expected case, and worst case. Assign probabilities and calculate the weighted average cost.
For example, if material costs might be $0.15/part (30% probability), $0.18/part (50% probability), or $0.24/part (20% probability), your weighted material cost is $0.183/part. Budget for $0.20 and you have a built-in cushion.
Advanced teams also use digital twin technology and simulation software to model material utilization and production efficiency before committing to a die design. This reduces the risk of discovering cost problems after tooling is built.
Sustainability factors also merit attention. Recycled steel or aluminum may cost slightly more per kilogram but can reduce scrap disposal costs and align with corporate ESG goals. The cost-benefit analysis often favors recycled materials for high-volume metal stamping processes, especially when end customers value sustainability credentials.
Conclusion
A realistic procurement budget for stamcing parts demands total landed cost thinking, honest tooling lifecycle planning, visible quality cost structures, and disciplined risk buffers — move beyond piece-price comparisons to build a sourcing plan that delivers consistent quality, on-time delivery, and long-term value.
Frequently Asked Questions
What Does Quality Actually Cost?
Quality control standards in stamping go far beyond a visual check at the end of the line. Here is what a proper quality program includes and what each element costs.
How do I accurately calculate the total landed cost for my custom stamping project?
A lesson we learned early in our sourcing work: two suppliers quoting the same part at wildly different prices often means they are quoting different scopes, not different margins.
What hidden tooling and prototyping expenses should I include in my initial stamping budget?
On a recent project involving a stainless steel mounting clip, our client's original budget allocated $8,000 for tooling. The actual tooling cost — including prototyping iterations, design revisions, and the final production die — came to $19,500. That gap nearly derailed the project timeline.
Footnotes
1. Defines the strategic process of improving supply chain efficiency and effectiveness. ↩︎
2. Explains the accounting concept of spreading asset cost over time. ↩︎
3. Describes the design and function of a progressive die in metal stamping. ↩︎
4. Official source for Production Part Approval Process (PPAP) standards and requirements. ↩︎
5. Provides a comprehensive definition of total landed cost in supply chain management. ↩︎
6. Explains the engineering practice of designing products for easier and more cost-effective manufacturing. ↩︎
7. Defines the systematic approach to maintaining equipment to prevent failures and extend lifespan. ↩︎
8. Provides information on Failure Mode and Effects Analysis (FMEA), including Process FMEA. ↩︎
9. The LME is a major global exchange for industrial metals pricing and indices. ↩︎
10. Explains the concept and benefits of blanket purchase orders in procurement. ↩︎