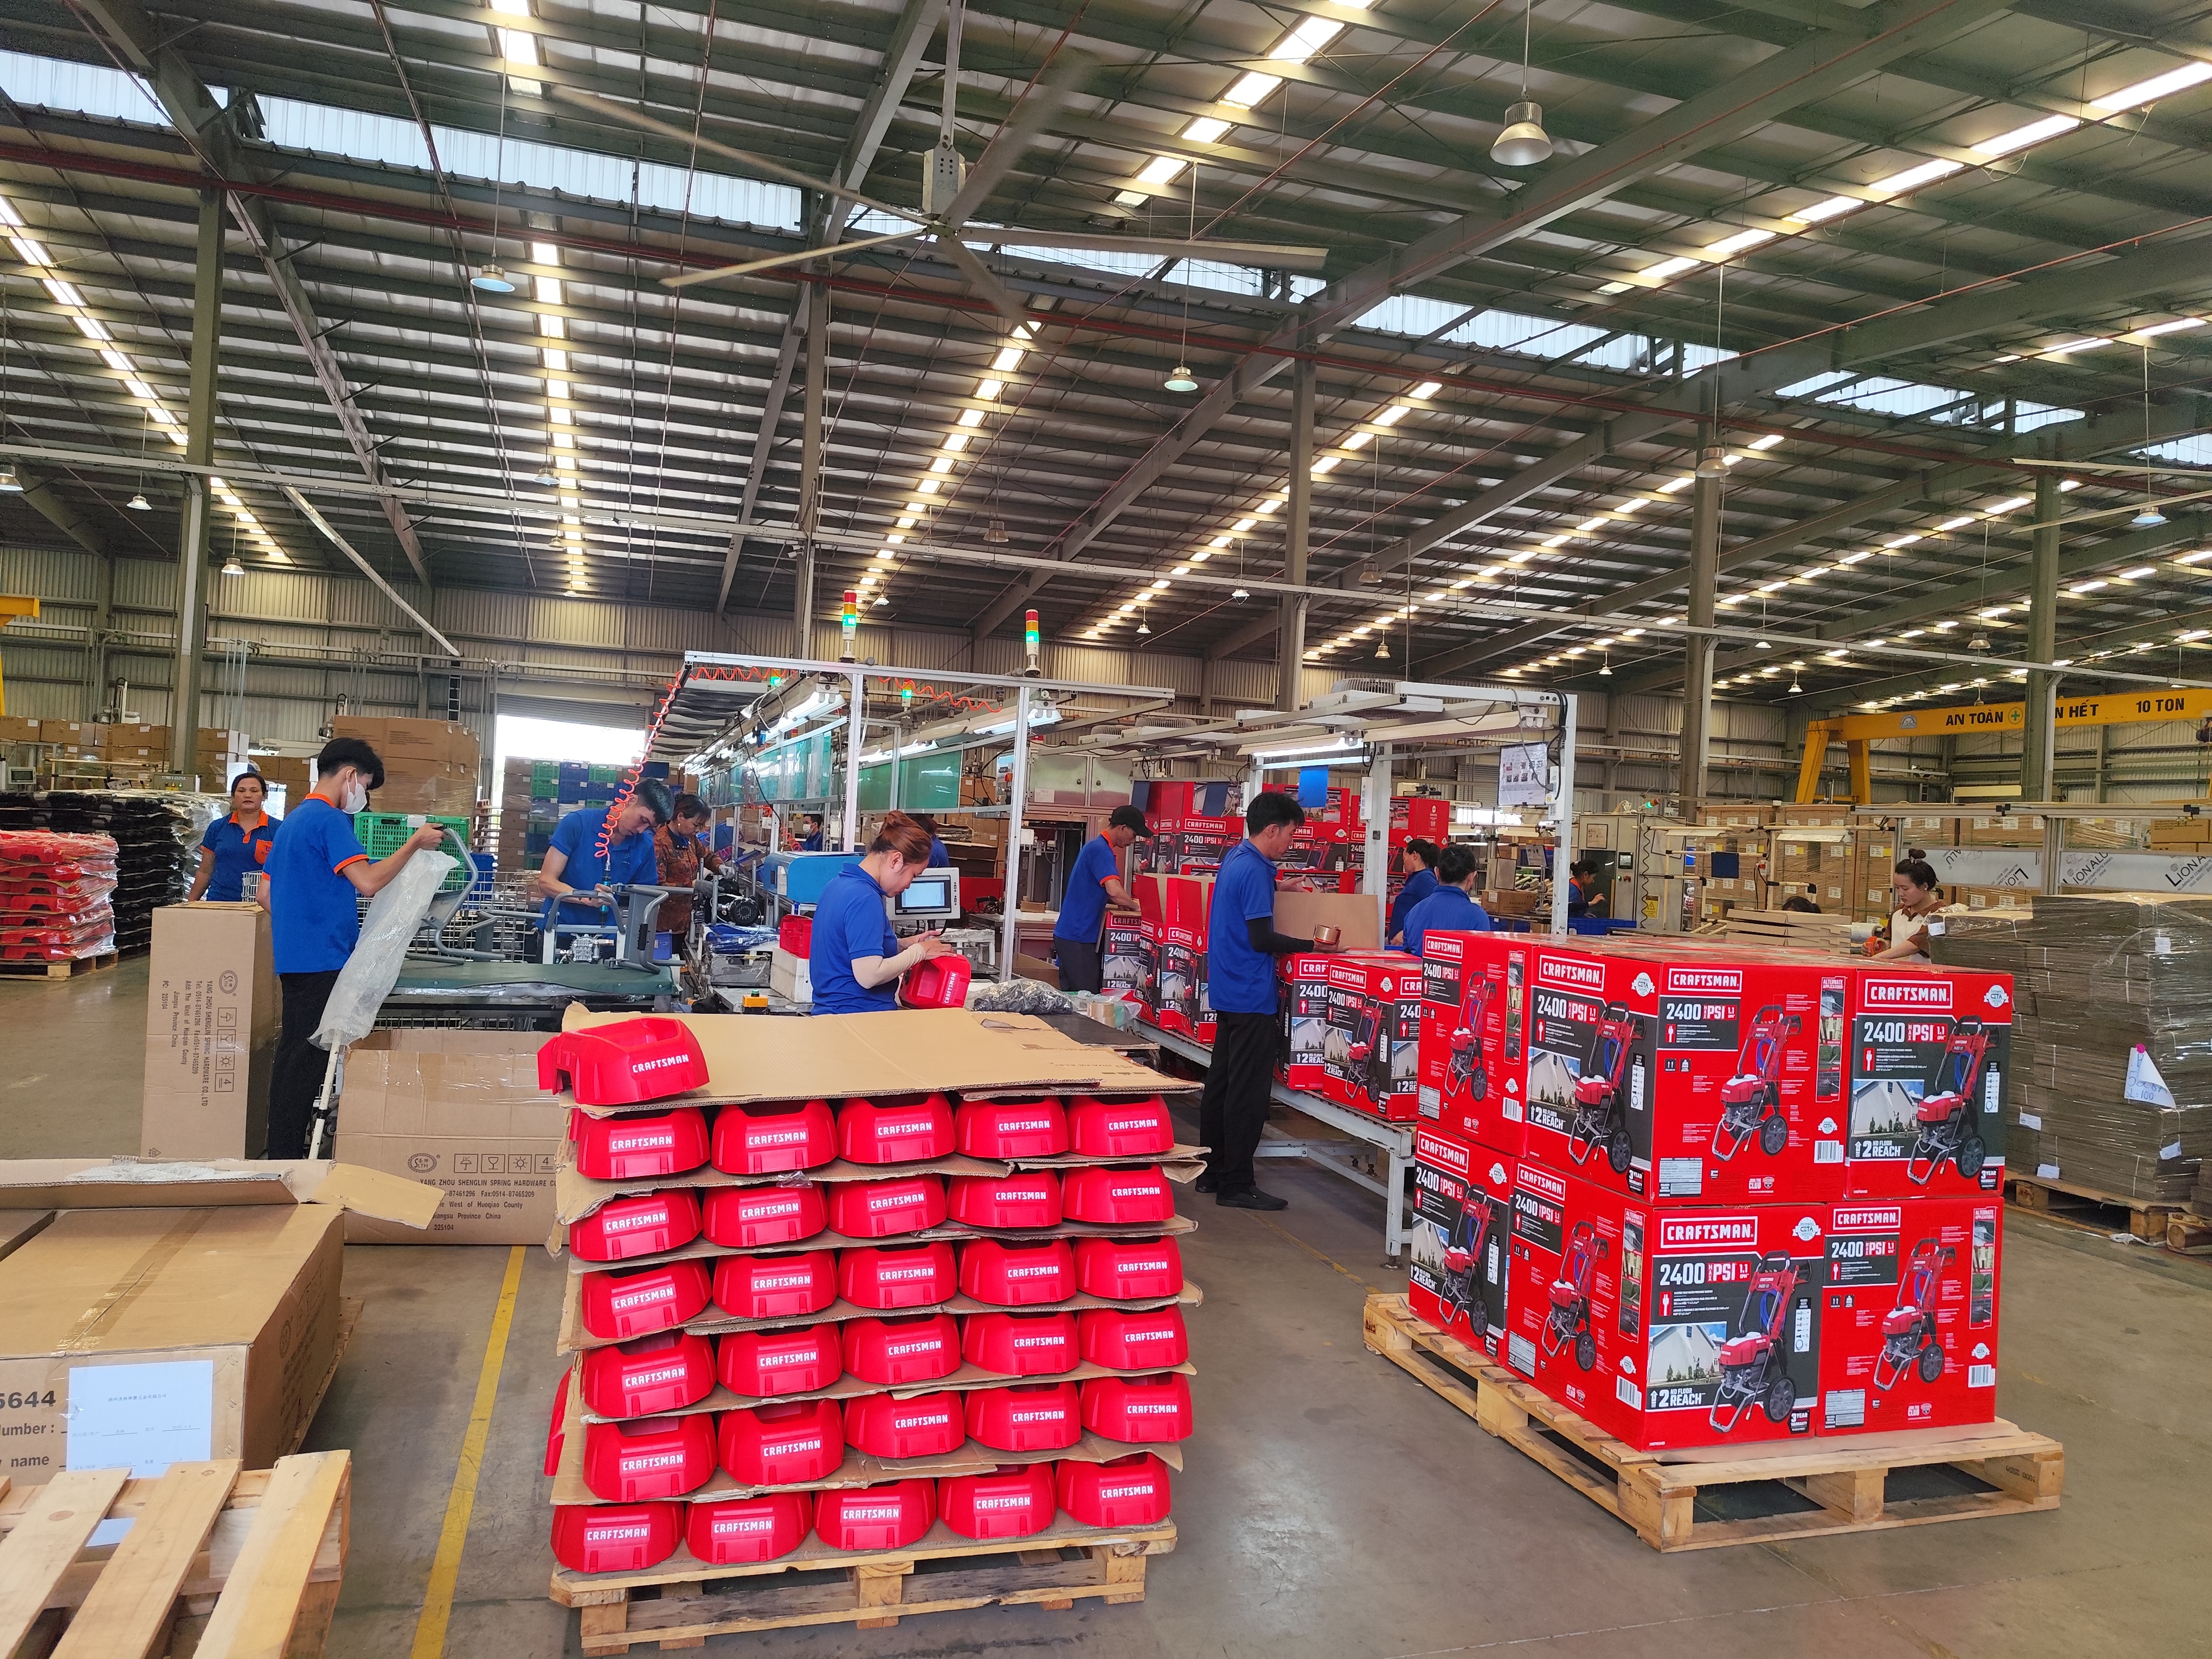
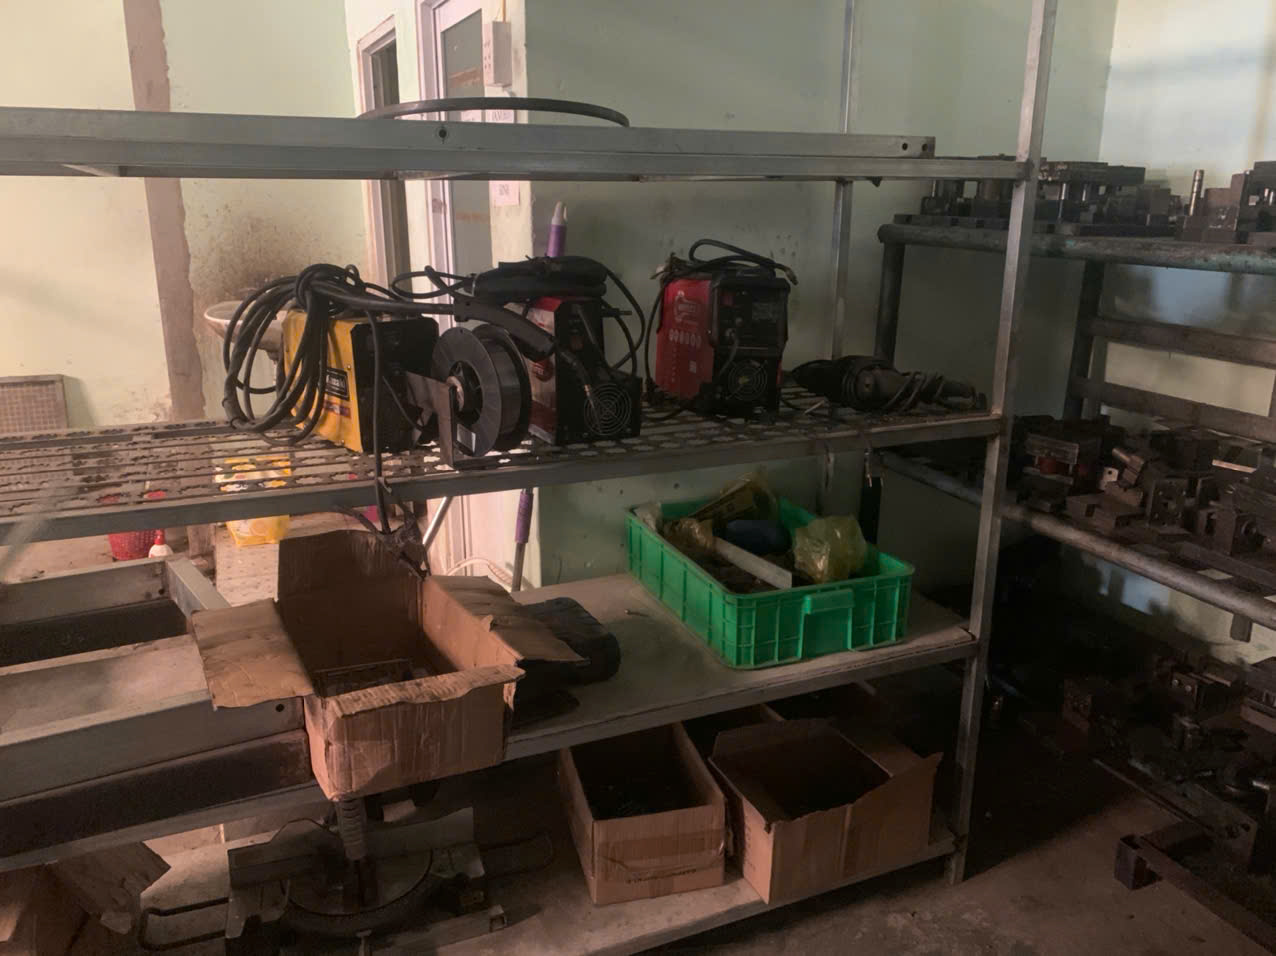
Developing supplier performance KPIs for sourcing welding parts became a priority after we lost three weeks on a rework cycle that should never have happened Procedure Qualification Records (PQR) 1. The brackets failed inspection—weld penetration was off, mounting holes were misaligned, and the supplier had no documentation trail. That single project cost more in delays and airfreight than the parts themselves total cost of ownership (TCO) 2. If you source custom welding assemblies from Asia, you know this pain. The stakes are high. Structural welding defects 3 don’t just cause returns—they cause liability. And without clear, measurable KPIs tied to your specific welding requirements, you’re flying blind every time you place a purchase order.
To develop supplier performance KPIs for sourcing welding parts, define measurable expectations across quality, delivery, cost, and responsiveness, then track metrics like defect rate, on-time delivery rate, first-pass yield, and total cost of ownership at the PO line level to drive continuous improvement.
The sections below break down each KPI category with formulas, tables, and practical guidance drawn from real sourcing projects. Whether you buy steel frames, brackets, or fabricated hardware, these metrics will help you hold suppliers accountable and build a more reliable supply chain.
How can I measure if my welding supplier is meeting critical drawing tolerances and weld quality standards?
A lesson we learned early in our Vietnam operations: a supplier can have the right welding equipment technology and still miss the mark on your drawing. One project involved a multi-level steel frame assembly with over forty welded joints. The supplier's welders were certified, but nobody on their floor actually read the GD&T callouts 4. We caught it only because our inspector flagged weld bead inconsistencies during a final audit.
To measure whether your welding supplier meets drawing tolerances and weld quality standards, track defect rate, first-pass yield, non-conformance rate, and material certification compliance at the individual PO line level—not as supplier-wide averages—to pinpoint exactly where failures occur.
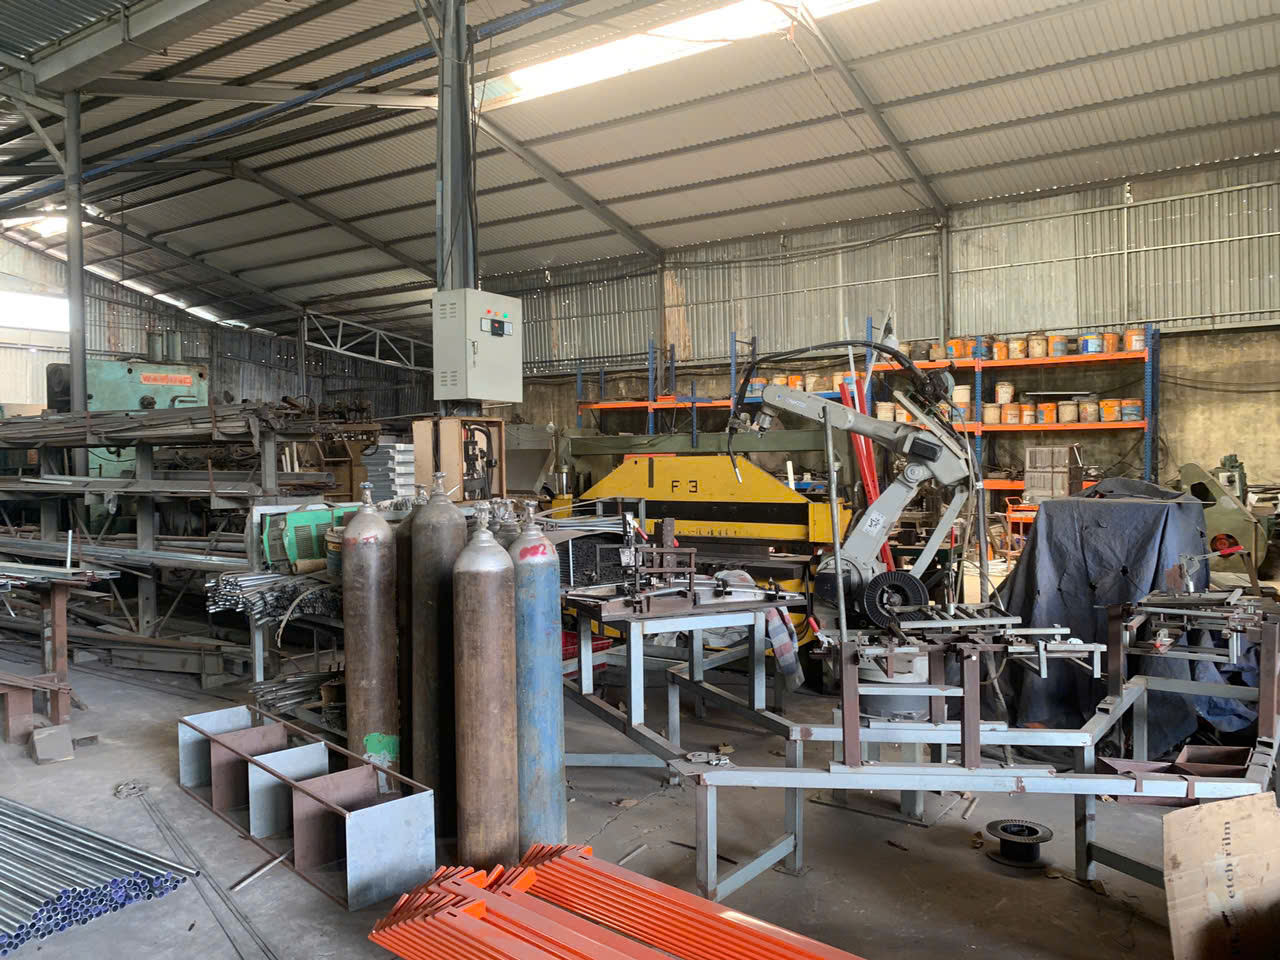
Why PO Line-Level Tracking Matters
Most buyers look at a supplier's overall defect rate and call it a day. That is a mistake. If you order ten different welding parts and only one consistently fails, a supplier-level average will hide the problem. You need to measure quality at the PO line level—each part number, each order line, each shipment.
Our quality control protocols require inspectors to log every non-conformance against the specific PO line item. This makes root-cause analysis much faster. You can see if the problem is a specific part geometry, a particular welder, or a raw material batch.
Core Quality KPIs for Welding Parts
Here are the metrics we track on every welding project:
| KPI | Formula | Target | Why It Matters for Welding |
|---|---|---|---|
| Defect Rate | (Defective units / Total units) × 100 | < 1% | Weld defects can cause structural failure |
| First-Pass Yield 5 | (Units accepted without rework / Total units) × 100 | > 95% | Rework on welded parts weakens joints |
| Non-Conformance Rate | (Non-conforming PO lines / Total PO lines) × 100 | < 2% | Tracks how often specs are missed |
| Material Cert Compliance | (Orders with valid MTRs / Total orders) × 100 | 100% | Material traceability is non-negotiable for structural parts |
Weld-Specific Quality Checks
Generic manufacturing KPIs miss some critical welding issues. You also need to verify:
- Weld penetration depth against drawing specs. Shallow welds look fine on the surface but fail under load.
- Weld bead consistency across all joints. Uneven beads signal unstable arc or wrong parameters.
- Post-weld heat treatment records when required by ASTM or ASME standards.
- Welder qualification records. Every welder on your job should hold current welding certifications for the process and material used—MIG, TIG, stick, or flux-core. Welder qualification records 6
During a supplier audit, we always ask to see the Welding Procedure Specification (WPS) 7 and the corresponding Procedure Qualification Records (PQR). If a supplier cannot produce these on request, that is a red flag. We also verify that the actual welding parameters on the floor match what the WPS says. Deviations here are where defects hide.
Quality Data Packages
For critical welding parts—especially brackets, base plates, and structural frames—we require suppliers to ship a Quality Data Package with every lot. This includes material test reports, dimensional inspection results, weld test reports, and photos of representative weld joints. Contract compliance on documentation is just as important as the parts themselves. Without it, your downstream customer has no assurance the parts are safe.
What KPIs will help me track and improve on-time delivery performance for my custom welding projects?
A buyer we work with in the Midwest once told me his biggest frustration was not bad parts—it was late parts. His production line sat idle for four days because a batch of welded mounting brackets missed the shipping window. The cost of that downtime dwarfed the value of the parts themselves. We took that feedback seriously and built a delivery tracking system that goes beyond just "did it arrive on time."
To track and improve on-time delivery for custom welding projects, measure on-time delivery rate, OTIF (on-time in-full), lead time adherence, and PO acknowledgment rate—and use leading indicators like unacknowledged PO aging to predict delays before they happen.
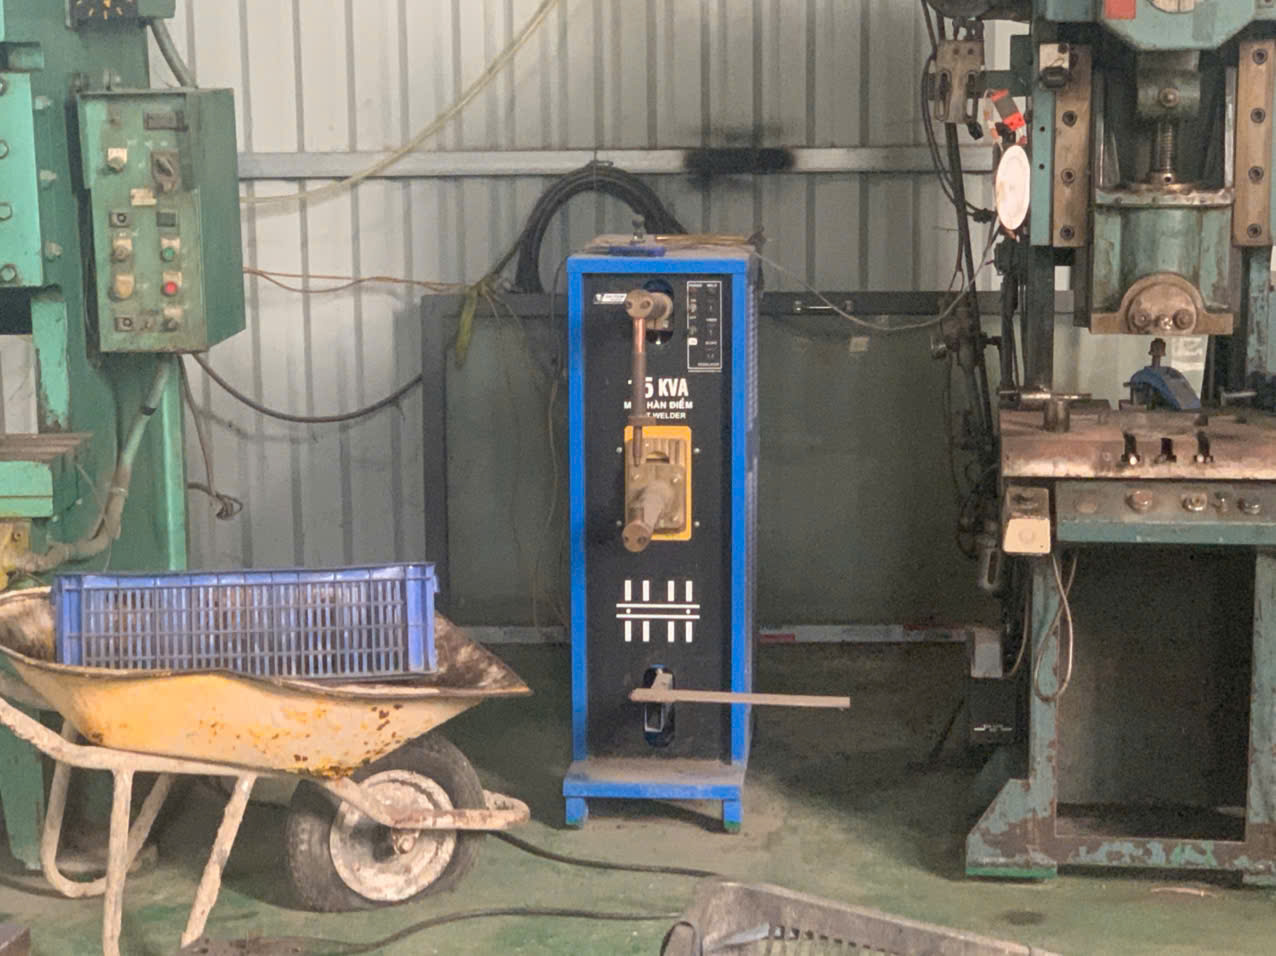
The Delivery KPI Table
| KPI | Formula | Target | Notes |
|---|---|---|---|
| On-Time Delivery (OTD) | (On-time deliveries / Total deliveries) × 100 | > 95% | Measured against the confirmed ship date |
| OTIF | (Orders on-time AND 100% quantity / Total orders) × 100 | > 92% | Partial shipments count as a miss |
| Lead Time Adherence | Actual lead time – Quoted lead time | ± 2 days | Tracks consistency, not just speed |
| PO Acknowledgment Rate | (POs confirmed within 24 hrs / Total POs) × 100 | > 98% | Early warning for communication gaps |
| Unacknowledged PO Aging | Count of POs not confirmed after 48 hours | 0 | Leading indicator of future late deliveries |
Why OTIF Beats Simple OTD
On-time delivery rate alone does not tell the full story. A supplier can ship on time but send only 80% of the quantity. Or they split the order into two shipments, each arriving on different days. OTIF captures both timing and completeness in one metric. OTIF (on-time in-full) 8 For welding projects where you need a full set of brackets or a complete frame assembly, a partial shipment is almost as bad as a late shipment.
Leading Indicators: Catch Problems Early
We learned to watch for leading indicators rather than just reacting to late deliveries after the fact. The most powerful one is unacknowledged PO aging. If a supplier has not confirmed your purchase order within 48 hours, that is a signal. Maybe they are overloaded. Maybe they have a material shortage. Either way, it is time to pick up the phone.
Another useful leading indicator is open PO aging—how many days your oldest unshipped PO has been open. If that number starts climbing, your supply chain stability is at risk.
Building a Delivery Improvement Process
Tracking KPIs is step one. Improvement requires action. Here is the cycle we follow:
- Set expectations upfront. The PO must include a confirmed delivery date, and the supplier must acknowledge within 24 hours.
- Monitor weekly. We run a report every Monday showing OTD, OTIF, and open PO aging for each supplier.
- Escalate early. If a PO is aging past 70% of its lead time without a shipping notice, we escalate.
- Review monthly. Monthly scorecard reviews with the supplier, covering trends—not just individual misses.
- Adjust allocation. Suppliers with consistently poor lead time adherence get fewer new orders. We shift volume to more reliable partners.
This cycle has helped our clients reduce late deliveries by a significant margin. The key is consistency. You cannot review scorecards once a quarter and expect change.
How do I assess my supplier's responsiveness and technical expertise during the welding co-development process?
The trade-off between price and partnership quality is one we weigh on almost every new project. A cheaper supplier who takes five days to answer a technical question about weld joint design will cost you more in the long run than a slightly pricier partner who responds within hours with a marked-up drawing. During co-development of a complex steel frame assembly—one with multi-level geometry, V-shaped brackets, and pre-drilled mounting holes—responsiveness is not a soft metric. It directly impacts your timeline and your final part quality.
To assess a welding supplier's responsiveness and technical expertise, track inquiry response time, RFQ turnaround speed, engineering change order handling time, and the quality of technical feedback—measuring both speed and depth of engagement during the co-development process.
What Responsiveness Really Means
Responsiveness is more than reply speed. It includes:
- Inquiry response time: How fast does the supplier reply to your emails or RFQs?
- Technical depth: Does the reply actually address your question, or is it a generic acknowledgment?
- Proactive communication: Does the supplier flag potential issues before you ask?
- Engineering change handling: When you revise a drawing, how quickly does the supplier confirm feasibility and update the quote?
A Practical Scoring Method
We use a simple 1–5 scoring system during the co-development phase. Here is the rubric:
| Criteria | Score 5 (Excellent) | Score 3 (Acceptable) | Score 1 (Poor) |
|---|---|---|---|
| Inquiry Response Time | Within 4 business hours | Within 24 hours | Over 48 hours |
| Technical Depth | Provides alternatives and DFM suggestions | Answers the question asked | Vague or incomplete answers |
| Proactive Communication | Flags risks and suggests improvements | Communicates when asked | Silent until problems escalate |
| ECO Turnaround | Updated quote within 2 business days | Within 5 business days | Over 7 business days |
| Documentation Quality | Clear, organized, complete | Adequate but needs follow-up | Missing key documents |
We average the scores across multiple interactions during the quoting and sampling phase. A supplier scoring below 3.0 on average typically causes problems in production. This is not about being harsh—it is about supplier risk management 9. You want to identify weak partners before you commit volume.
Technical Expertise: How to Test It
During the RFQ stage, we deliberately include a few challenging features in the drawing—tight tolerances on a hole pattern near a weld zone, or a flatness callout on a welded base plate that will distort without proper fixturing. How the supplier responds tells us everything.
A technically strong supplier will call out the challenge, explain the risk of weld distortion, and propose a solution—maybe a post-weld machining step or a stress-relief process. A weak supplier will simply quote the part without comment, and you will discover the problem only after the first article fails inspection.
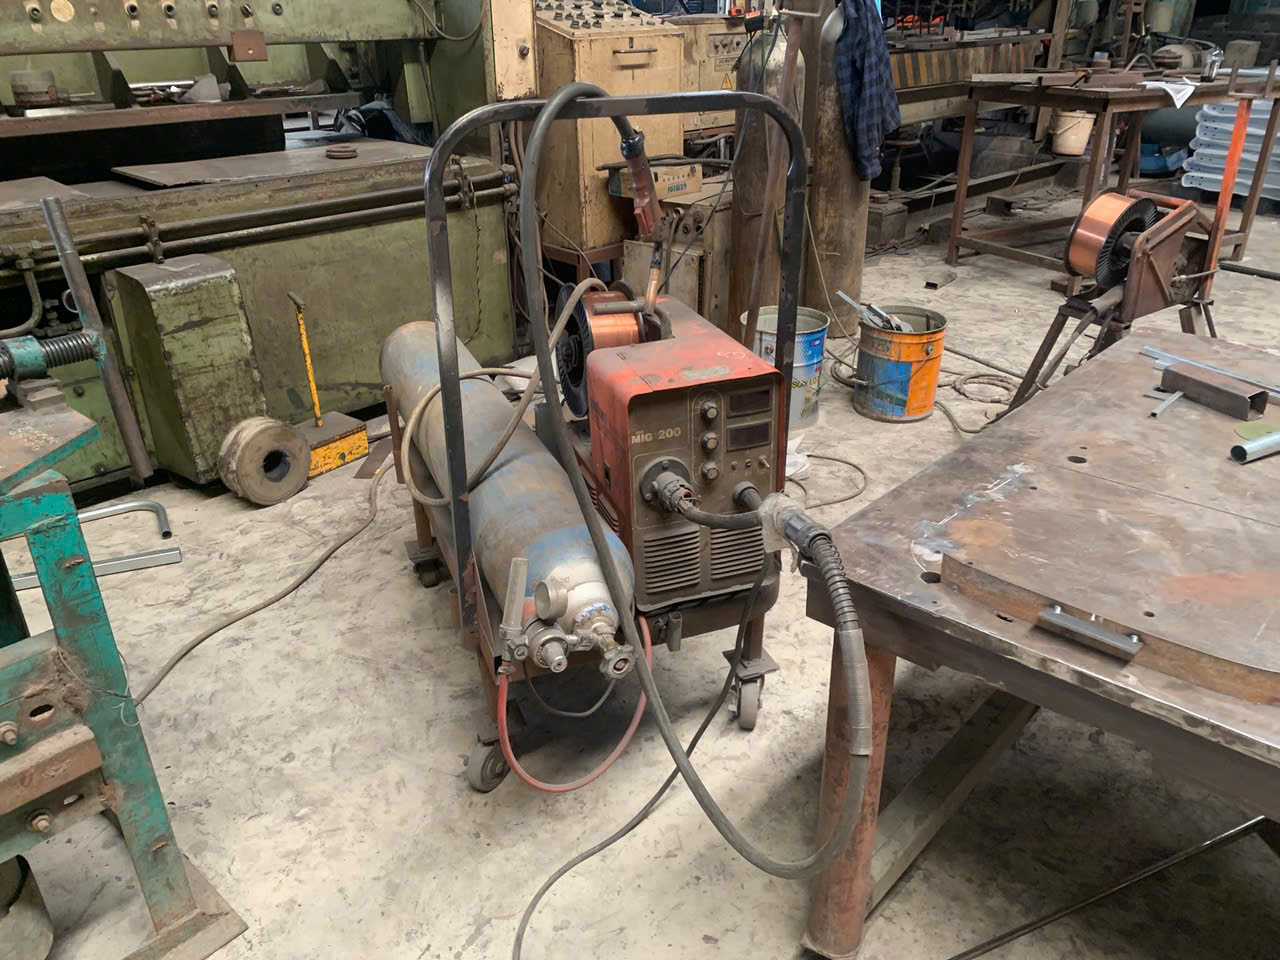
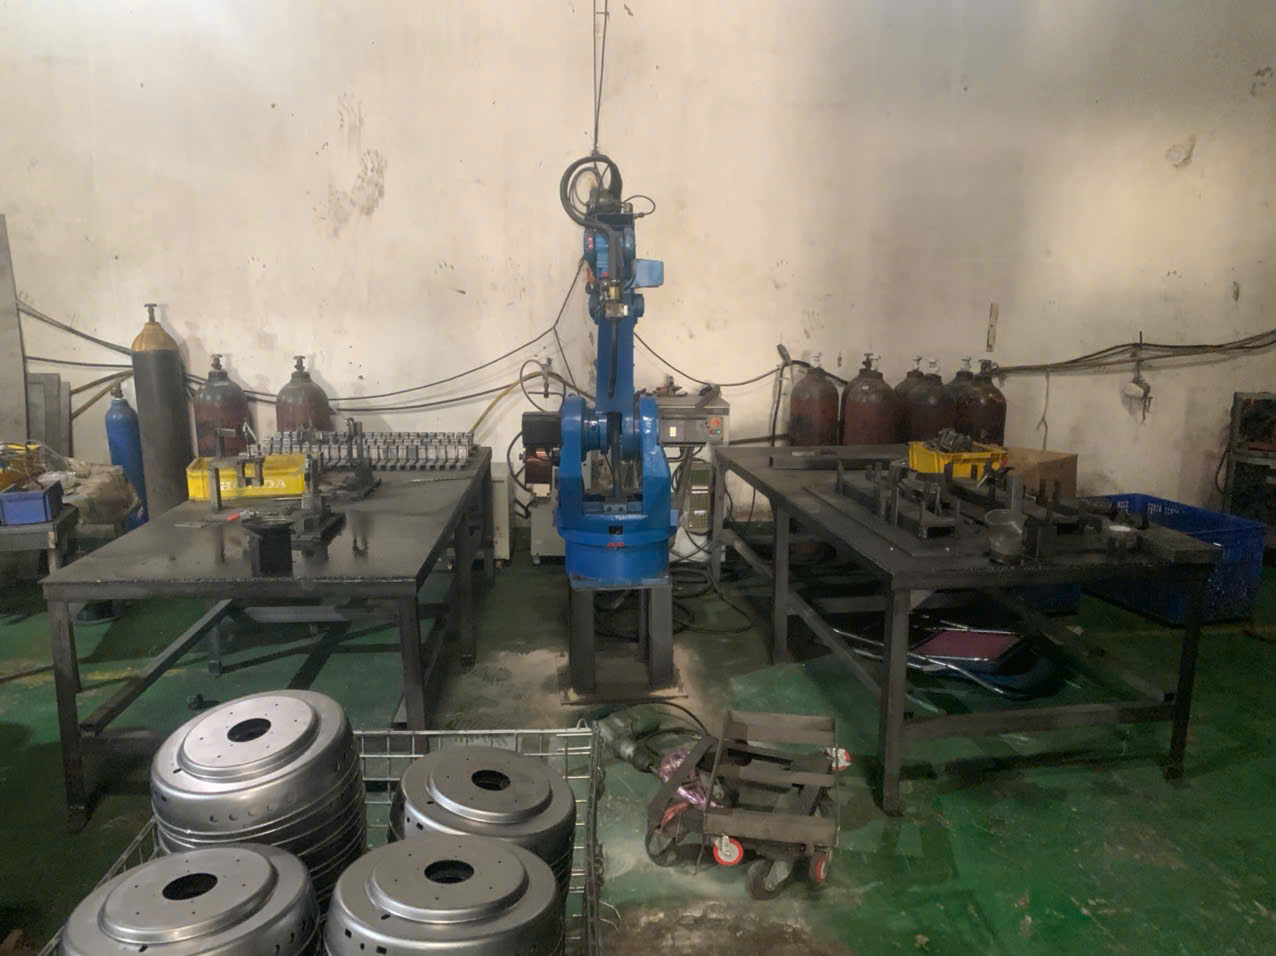
We also ask suppliers about their welding equipment technology—what machines they run, what gas mixtures they use, and whether they have automated or robotic welding capability for repeat production. These questions reveal the gap between a supplier who welds as a side service and one who treats it as a core competency.
Which metrics should I use to evaluate the total cost of quality and the impact of rework on my welding supply chain?
Here is a scenario from a project we managed last year. A client chose the lowest-priced supplier for a set of heavy-duty L-shaped mounting brackets. The unit price was 12% lower than the next bidder. But within the first three shipments, the client faced two rounds of rework due to weld porosity, one lot rejection for wrong material grade, and an emergency airfreight shipment to avoid shutting down their customer's assembly line. The "savings" evaporated. The total cost ended up 20% higher than the more expensive supplier would have charged.
To evaluate total cost of quality and rework impact, track cost of poor quality (COPQ), total cost of ownership (TCO), purchase price variance (PPV), rework rate, and warranty claim rate—combining visible costs like unit price with hidden costs like inspection, rework, freight, and production downtime.
Breaking Down Total Cost of Ownership
The unit price on a quote is just the tip of the iceberg. For welding parts, the hidden costs are disproportionately large because weld defects are expensive to fix. You cannot simply re-stamp a bracket. You have to grind out the bad weld, re-weld, re-inspect, and often re-treat the surface. Each step adds cost and weakens the part.
Here is how we structure TCO for welding parts:
| Cost Component | What It Includes | Typical Impact |
|---|---|---|
| Unit Price | Supplier's quoted price per part | Base cost—often 50–60% of TCO |
| Inbound Freight | Ocean/air freight, customs, duties | 5–15% of TCO |
| Incoming Inspection | Labor and equipment for receiving QC | 3–8% of TCO |
| Rework Costs | Grinding, re-welding, re-inspection | 5–25% of TCO when defects occur |
| Scrap Costs | Unrepairable parts written off | Variable—can spike on structural failures |
| Expediting & Airfreight | Rush shipping to recover from delays | 10–30% per incident |
| Administrative Cost | PO management, NCR processing, supplier communication | 2–5% of TCO |
| Warranty / Field Failure | Costs if defective parts reach the end user | Catastrophic—liability exposure |
The Cost of Poor Quality (COPQ) Formula
We calculate COPQ as the sum of all costs incurred because a part did not meet specifications the first time. This includes:
- Internal rework labor
- Scrap value of rejected parts
- Re-inspection costs
- Expedited freight for replacement parts
- Production downtime at the customer's facility
- Administrative time for NCR processing and supplier corrective actions
A rough formula: COPQ = Rework Cost + Scrap Cost + Expediting Cost + Downtime Cost + Admin Cost
For welding parts, rework cost dominates. A 1% defect rate in welding can easily translate to a 5–10% COPQ because each defective weld requires skilled labor to repair and re-certify.
Cost Reduction Strategies That Actually Work
The best cost reduction strategies for welding parts do not start with squeezing the unit price. They start with eliminating waste in the quality loop:
- Invest in PPAP. A thorough Production Part Approval Process 10 catches problems before volume production. It costs time upfront but saves multiples in rework later.
- Require process control plans. The supplier should document every welding parameter—amperage, voltage, travel speed, gas flow—and monitor them during production.
- Track rework rate as a KPI. If rework rate exceeds 3%, trigger a formal corrective action request.
- Use TCO in supplier selection. When comparing bids, add estimated inspection, rework, and logistics costs to the unit price. The cheapest quote is rarely the cheapest outcome.
This approach aligns with a broader shift in procurement toward balancing price and quality when selecting OEM welding parts suppliers. Price competitiveness still matters, but not at the expense of supply chain reliability.
Conclusion
Developing supplier performance KPIs for welding parts is not optional—it is the foundation of a safe, reliable, and cost-effective supply chain. Track quality, delivery, responsiveness, and total cost at the PO line level, and use the data to drive collaborative improvement with your suppliers.
Frequently Asked Questions
How can I measure if my welding supplier is meeting critical drawing tolerances and weld quality standards?
A lesson we learned early in our Vietnam operations: a supplier can have the right welding equipment technology and still miss the mark on your drawing. One project involved a multi-level steel frame assembly with over forty welded joints. The supplier's welders were certified, but nobody on their floor actually read the GD&T callouts 4 . We caught it only because our inspector flagged weld bead inconsistencies during a final audit.
What KPIs will help me track and improve on-time delivery performance for my custom welding projects?
A buyer we work with in the Midwest once told me his biggest frustration was not bad parts—it was late parts. His production line sat idle for four days because a batch of welded mounting brackets missed the shipping window. The cost of that downtime dwarfed the value of the parts themselves. We took that feedback seriously and built a delivery tracking system that goes beyond just "did it arrive on time."
How do I assess my supplier's responsiveness and technical expertise during the welding co-development process?
The trade-off between price and partnership quality is one we weigh on almost every new project. A cheaper supplier who takes five days to answer a technical question about weld joint design will cost you more in the long run than a slightly pricier partner who responds within hours with a marked-up drawing. During co-development of a complex steel frame assembly—one with multi-level geometry, V-shaped brackets, and pre-drilled mounting holes—responsiveness is not a soft metric. It directly impacts your timeline and your final part quality.
Footnotes
1. Explains PQR as a certified document recording actual welding parameters and test results. ↩︎
2. Explains TCO as a comprehensive financial estimate of direct and indirect costs over an asset’s lifecycle. ↩︎
3. Explains common welding defects, their causes, and prevention methods. ↩︎
4. Provides a comprehensive guide to Geometric Dimensioning and Tolerancing symbols and their meanings. ↩︎
5. Replaced HTTP 404 with an authoritative definition and explanation of First-Pass Yield from Wikipedia. ↩︎
6. Details the requirements and documentation for welder performance qualification and certification. ↩︎
7. Defines WPS as a formal document outlining parameters for consistent, quality welds. ↩︎
8. Explains OTIF as a comprehensive metric for measuring delivery performance, including timeliness and completeness. ↩︎
9. Replaced HTTP 404 with an authoritative guide on supply chain risk mitigation strategies, including supplier risk, from Purdue University (.edu). ↩︎
10. Replaced HTTP 404 with an authoritative explanation of Production Part Approval Process (PPAP) from Wikipedia. ↩︎