Evaluating supplier delivery and capacity stability for stamping parts 1 is a lesson our team learned the hard way — after a critical bracket order arrived three weeks late, forcing our U.S. client to halt assembly.
To evaluate supplier delivery and capacity stability for stamping parts, procurement teams must analyze production capacity data, on-time delivery rates, yield records, tooling strategies, quality certifications, and risk resilience plans — moving beyond promises to verifiable, data-driven metrics that predict real-world performance.
This guide breaks down the exact indicators, processes, and red flags we use when auditing stamping suppliers across Southeast Asia production capacity data 2. Each section tackles a specific question buyers ask us most often.
How do I verify that a stamping supplier's actual production capacity can handle my specific volume requirements?
A trade-off we weigh on every new project is whether a supplier's quoted capacity reflects real, sustainable output — or just the theoretical maximum of their press tonnage on paper on-time delivery rates 3.
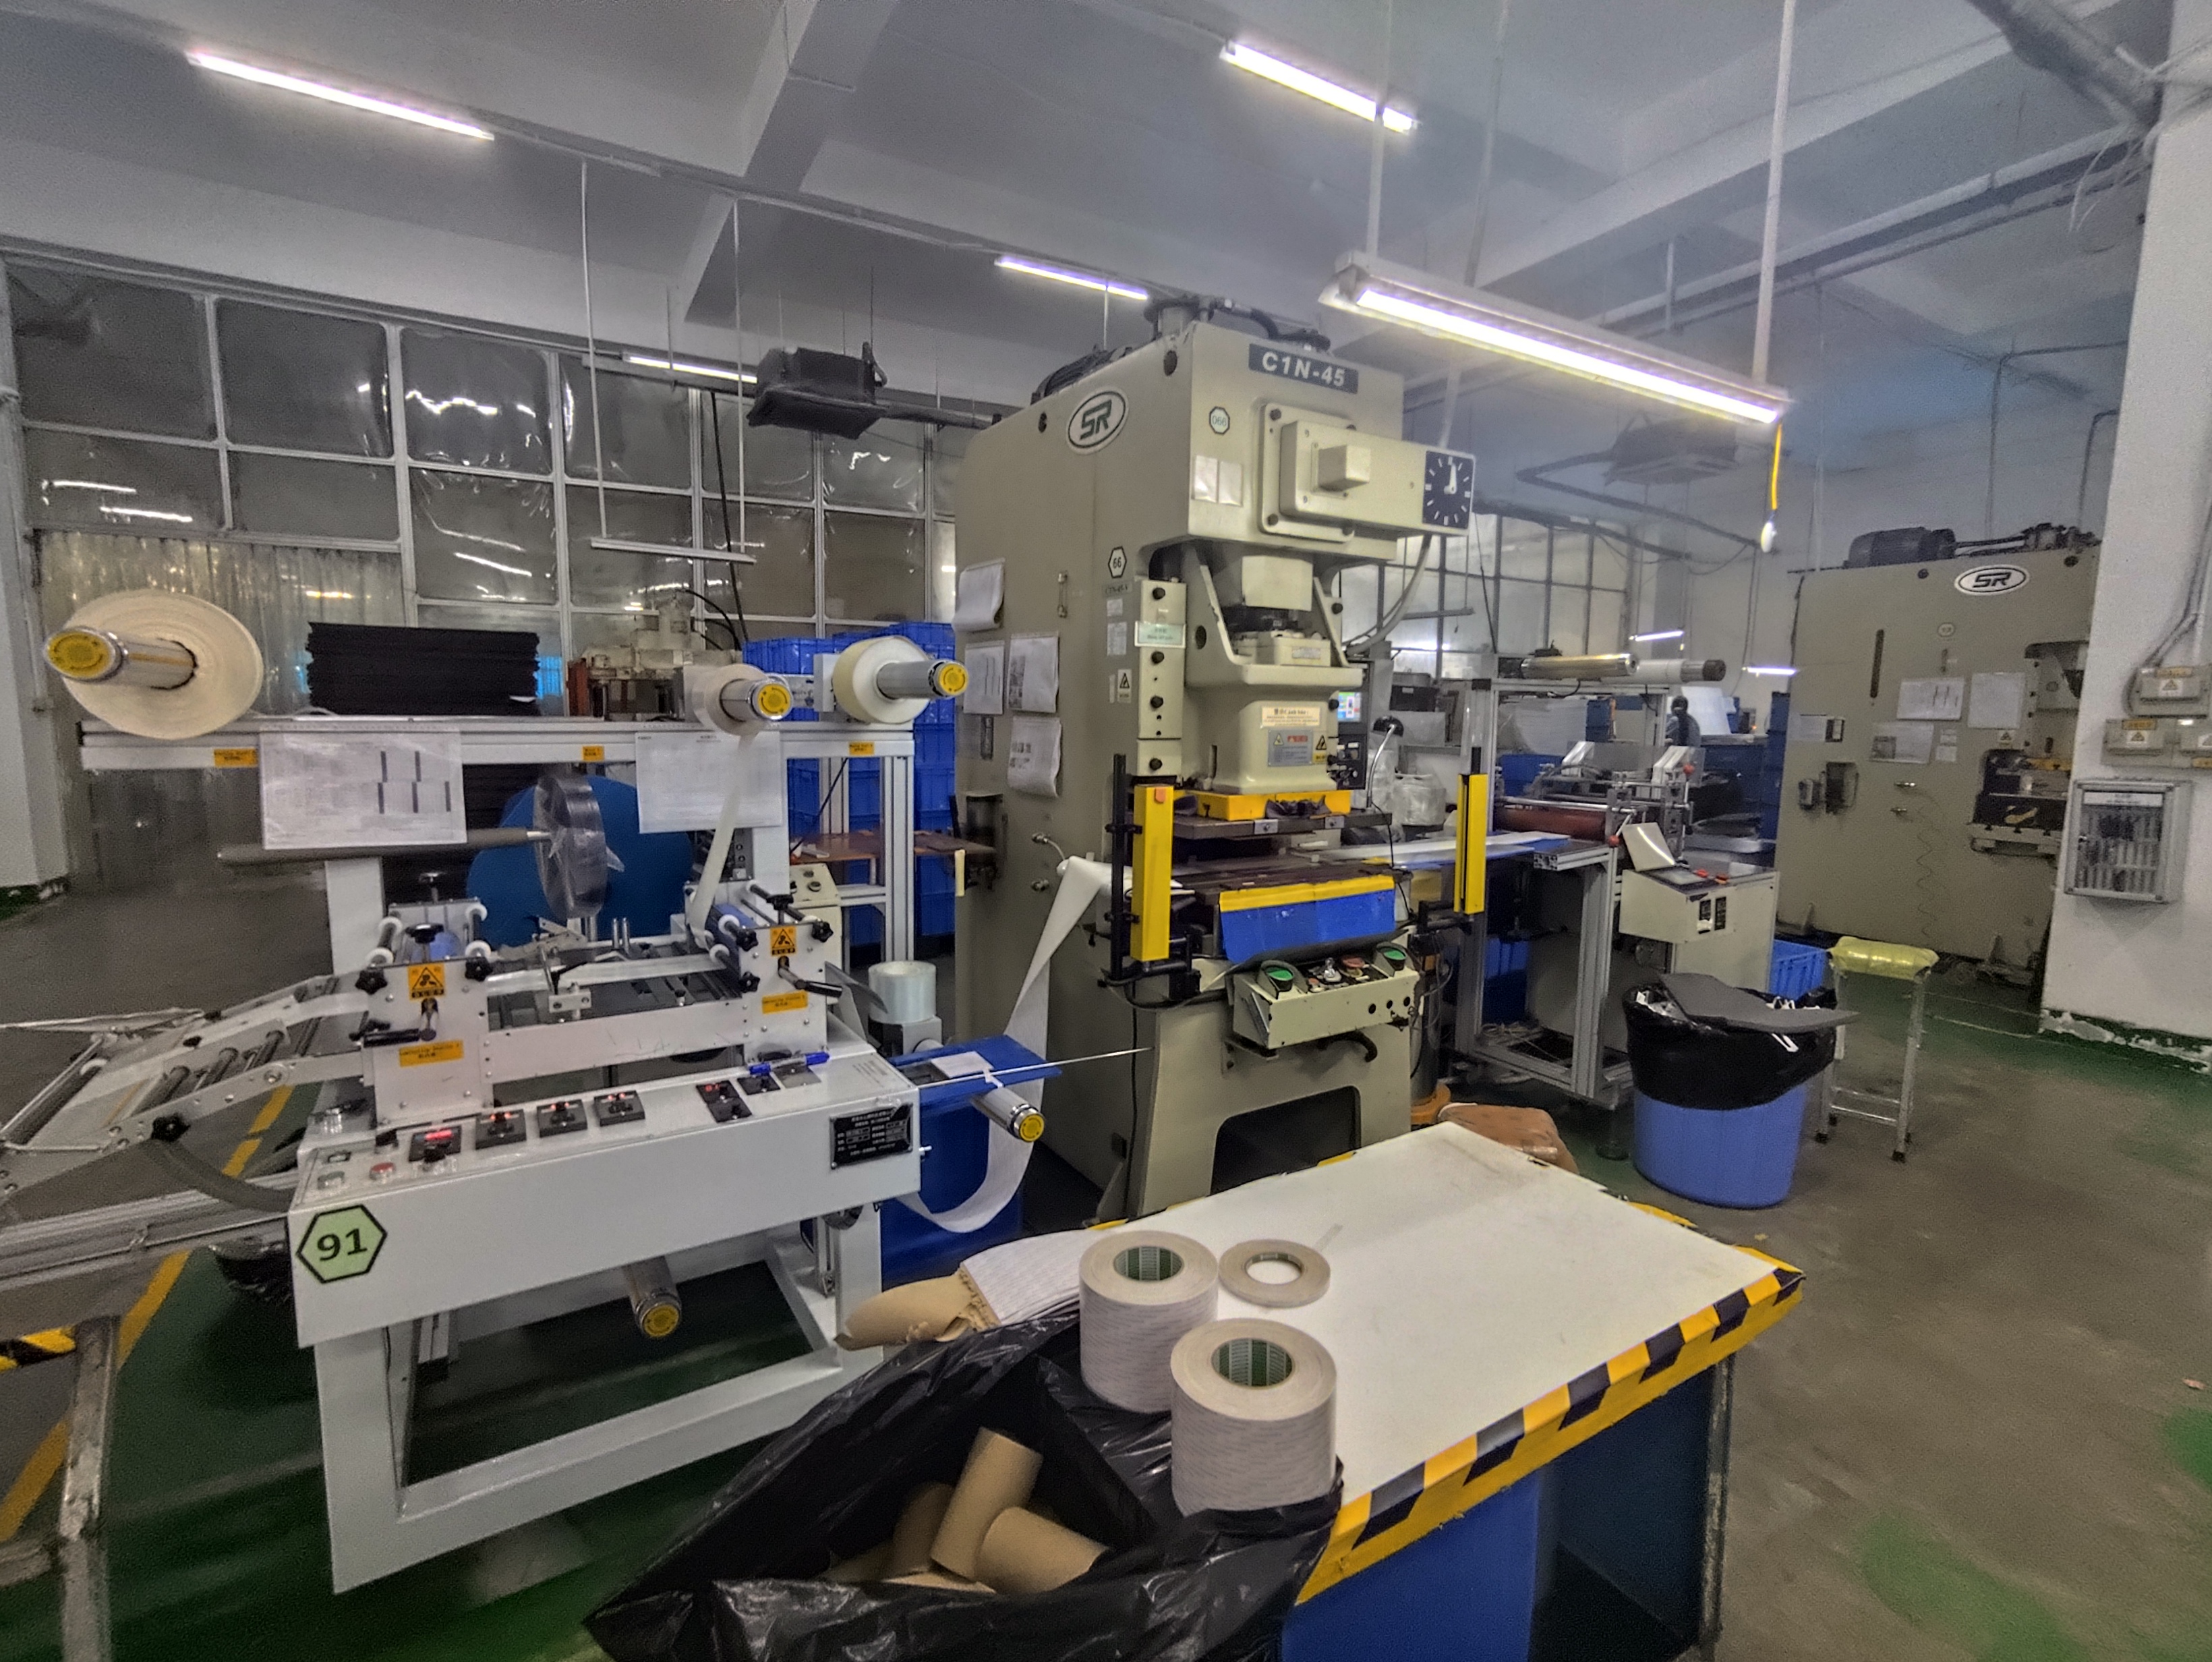
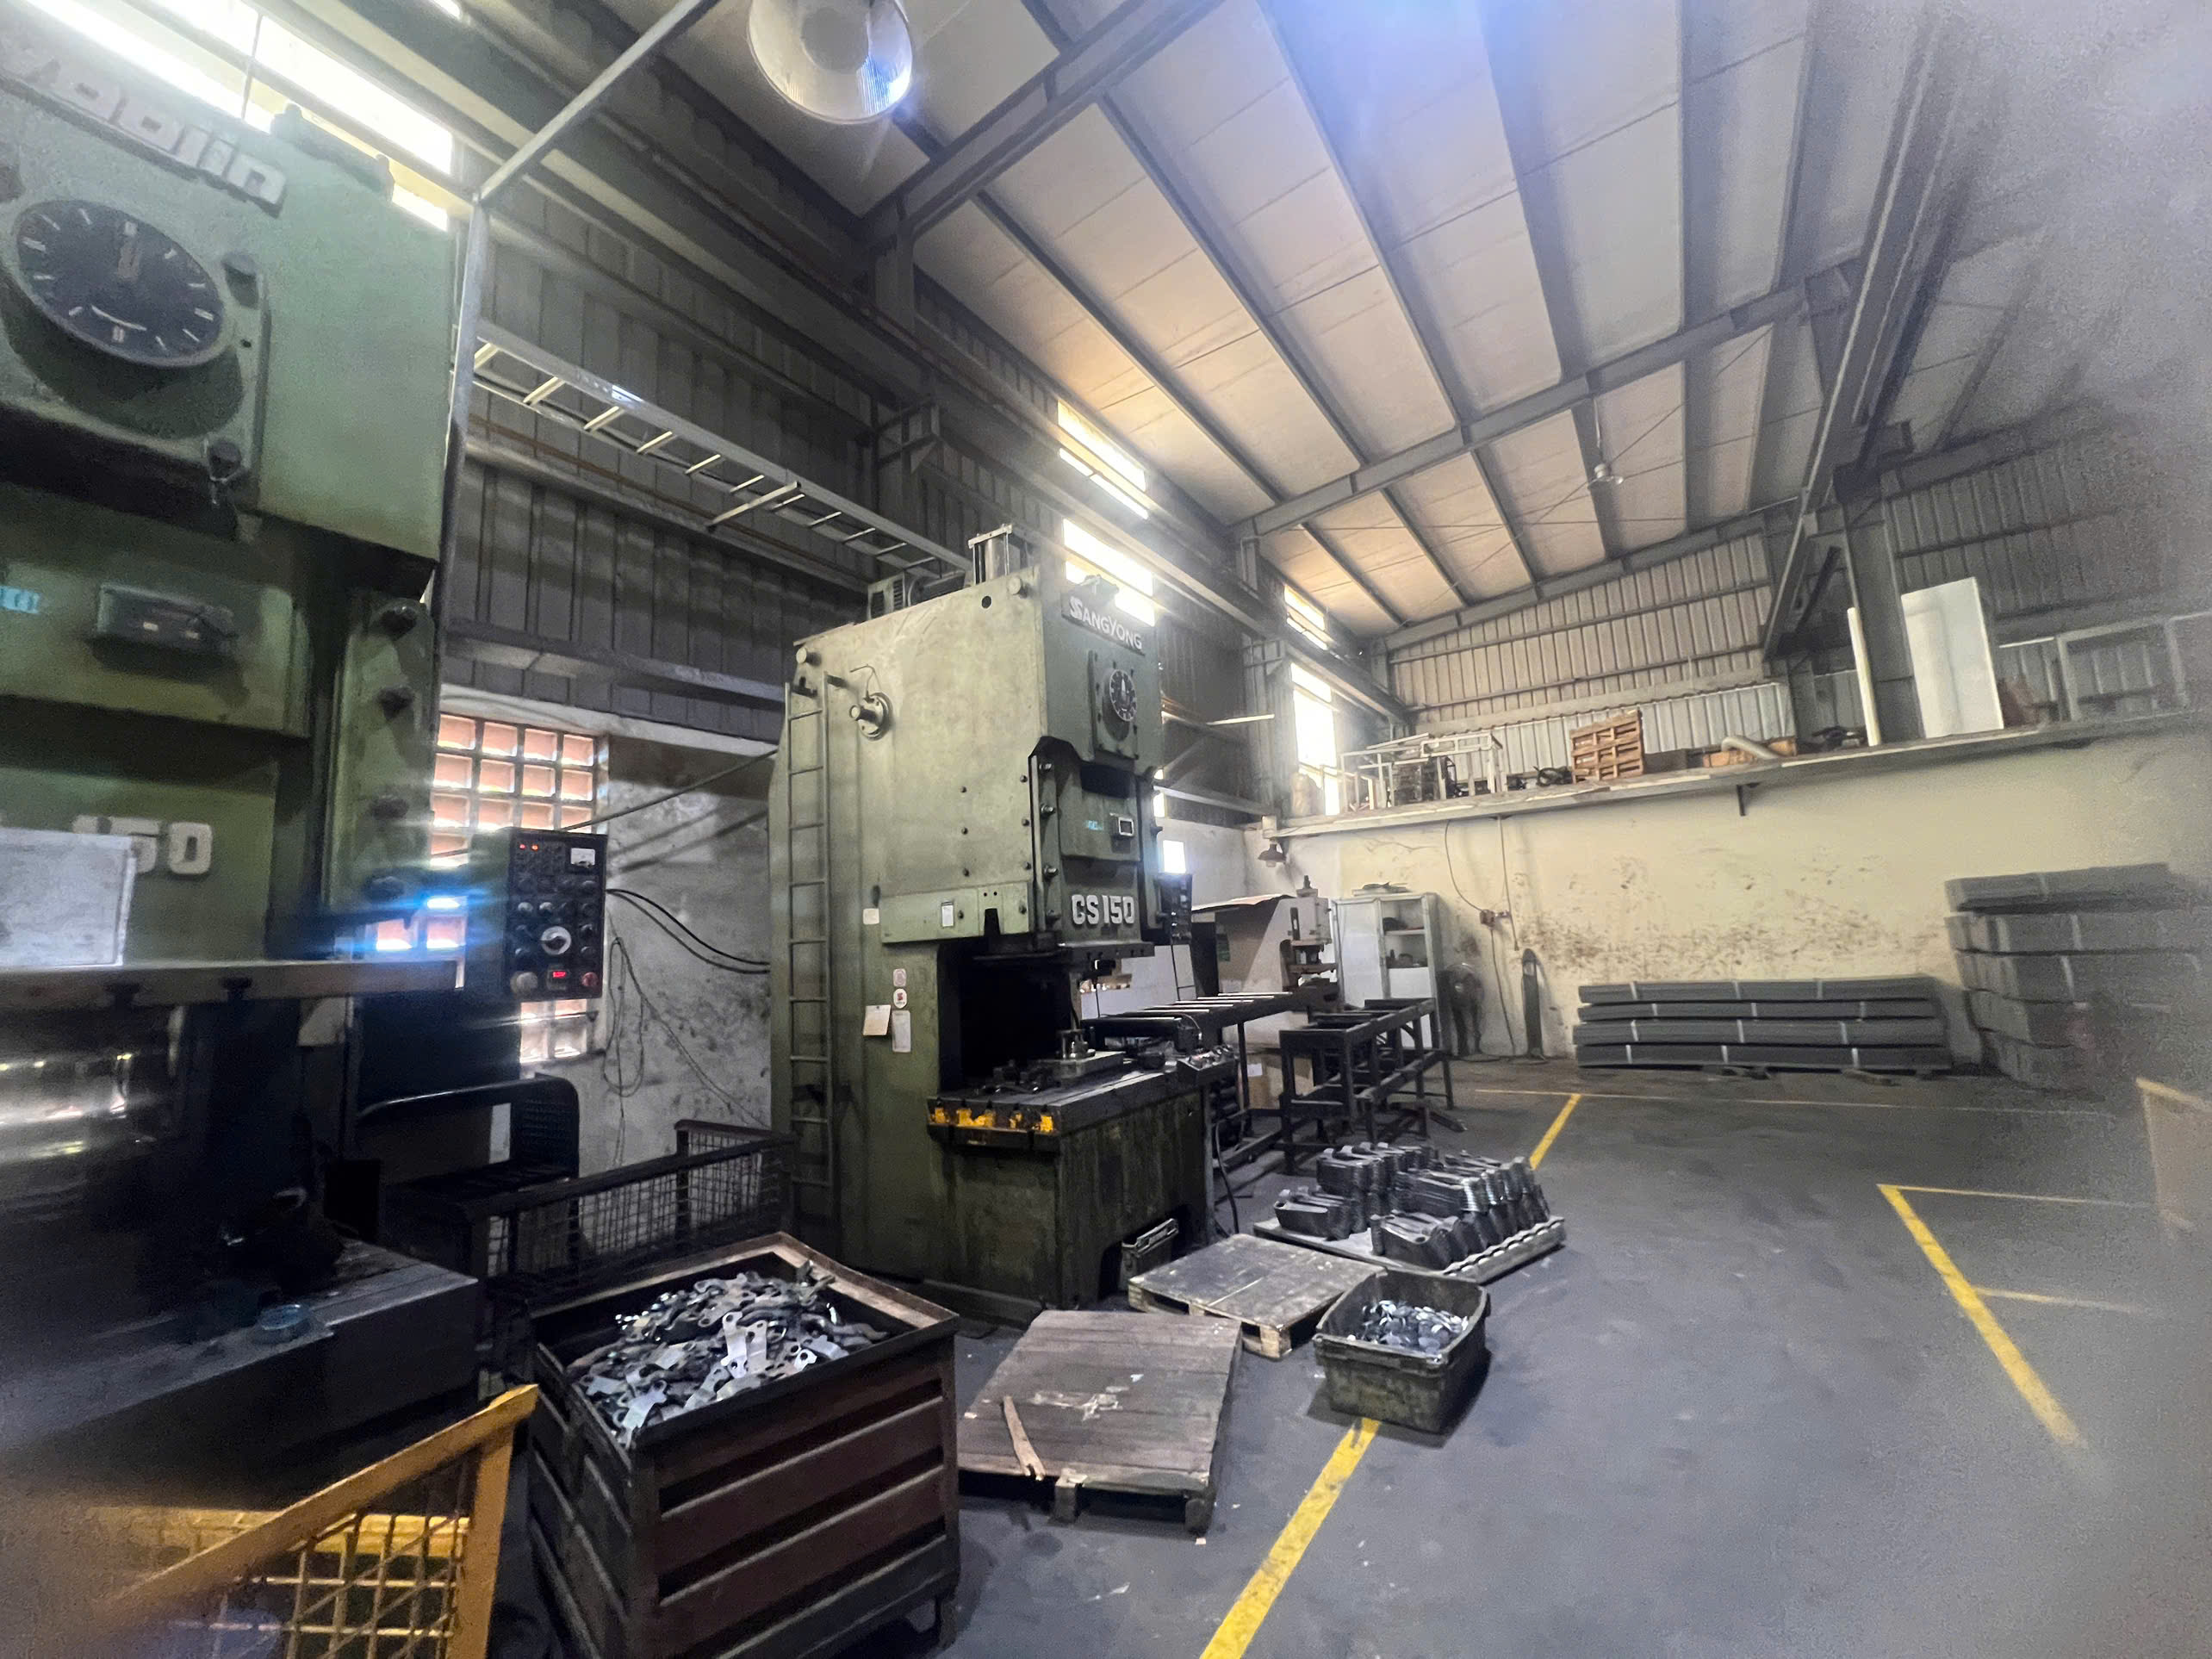
Verify a stamping supplier's actual production capacity by requesting historical utilization records, downtime logs, and yield rate data, then cross-referencing these with a facility visit to confirm equipment condition, workforce depth, and scheduling flexibility for your specific volumes.
Start with the Numbers, Not the Sales Pitch
When our Vietnam office evaluates a new stamping factory, the first document request is never a capability brochure quality certifications 4. We ask for three months of utilization records and downtime logs. These two data sets reveal more than any factory tour.
Utilization rate 5 tells you how much of the available press time is actually producing parts. A factory running at 90% utilization has almost no room for your order during peak periods. A factory at 60% has headroom — but you need to understand why. Is it lack of orders, or deliberate capacity reservation?
Downtime records 6 show how often machines stop and why. Frequent unplanned stops signal poor maintenance. Planned maintenance windows, on the other hand, are a green flag.
Scalability: Can They Grow with You?
Production capacity is not static. Your order might start at 5,000 pieces per month and grow to 50,000. The supplier needs scalable production capacity to handle that trajectory. Look for these indicators:
| Scalability Indicator | What to Check | Red Flag |
|---|---|---|
| Equipment redundancy | Multiple presses of the same tonnage range | Only one press capable of running your part |
| Workforce flexibility | Cross-trained operators for multiple press lines | Single-skill operators with no backup |
| Shift structure | Ability to add second or third shift | Already running maximum shifts |
| Raw material sourcing | Multiple approved steel coil suppliers | Single-source material dependency |
| Tooling backup | Spare die sets or rapid die repair capability | No spare tooling, long die repair lead time |
Surge Capacity Is an Operational Condition
Surge capacity — the ability to ramp output above normal rates within a compressed timeframe — is not a marketing claim. It depends on specific factors: available press time, organized tooling storage and retrieval, and cross-trained setup personnel who can perform rapid die changes.
During our supplier audits, we test this by asking: "If we need to double the order next month, what is your response plan?" The answer should be specific — shift additions, press reallocation, material pre-ordering — not vague reassurances.
We also verify whether the supplier tracks parts per million defect rates during high-volume runs. A factory that maintains low PPM at normal volume but has never been tested at surge volume is a risk.
What quality control indicators should I look for to prevent production bottlenecks and delivery delays?
A buyer interaction last year made this crystal clear: a U.S. client received a batch of stamped steel brackets where 12% failed dimensional inspection. The rework cycle consumed three weeks and pushed the entire project off schedule.
To prevent production bottlenecks and delivery delays, monitor the supplier's historical yield rate, first-article inspection process, in-process control checkpoints, traceability systems, and relevant certifications like ISO 9001 — because unstable quality is the single largest cause of late shipments.
Why Quality Problems Become Delivery Problems
Most procurement teams treat quality and delivery as separate evaluation categories. In reality, they are deeply connected. When yield rates drop, the supplier must sort defective parts, rework batches, or run replacement production. All of this consumes time. A supplier with a 95% yield rate ships on time. A supplier with an 85% yield rate is always scrambling.
Our China office learned this pattern early. We now require every stamping supplier to provide their historical average yield rate before we proceed to sample approval. If they cannot produce this number, it usually means they do not track it — which is itself a disqualifying signal.
The Quality Indicators That Actually Matter
Not all quality metrics are equal. Here is how we prioritize them during process control evaluation:
| Quality Indicator | Why It Matters | How to Verify |
|---|---|---|
| Yield rate (monthly average) | Directly predicts rework volume and delivery risk | Request 6-month production reports |
| First-article inspection (FAI) pass rate | Shows process setup accuracy | Ask for FAI reports from recent projects |
| In-process inspection frequency | Catches drift before it becomes a batch problem | Observe during facility visit |
| Final inspection protocol | Last defense before shipping | Review inspection instructions and sampling plan |
| Traceability system | Enables root cause analysis when issues occur | Ask: "What information can you provide to trace a specific batch?" |
| Certifications (ISO 9001, IATF 16949 7) | Confirms systematic quality management | Request current certificates and audit results |
The Traceability Test
One question we always ask during supplier audits: "If a defective part surfaces six months from now, what information can you provide to trace it back to its production batch?" A strong supplier will answer with specifics — coil heat number, press machine ID, operator name, date, shift, inspection record. A weak supplier will hesitate.
Traceability is not just about crisis response. It is about process control discipline. A factory that traces every batch is a factory that controls every batch.
Certifications Are Necessary but Not Sufficient
ISO 9001 certification 8 confirms that a quality management system exists. It does not guarantee that the system works well every day. We have visited ISO-certified factories where the quality control area was disorganized and measurement tools were out of calibration. The certificate was on the wall, but the discipline was not on the floor.
That said, certifications remain a baseline requirement. For automotive stamping, IATF 16949 is expected. For medical device components, ISO 13485. These frameworks force suppliers to document processes, conduct internal audits, and respond to nonconformances — all of which improve stability over time.
How can I assess if a Southeast Asian manufacturer is capable of meeting my strict door-to-door delivery schedules?
A lesson we learned after setting up our Vietnam office: lead time assumptions for Southeast Asian suppliers are often built on optimism, not operational reality. Transit times, customs clearance, and inland logistics all add variability that factories rarely account for in their quoted delivery dates.
Assess a Southeast Asian manufacturer's door-to-door delivery capability by verifying their on-time delivery track record, logistics partnerships, lead time breakdown transparency, risk mitigation plans, and whether they have local project management support to coordinate production with international shipping schedules.
Breaking Down the Lead Time
When our team quotes lead time for a stamped bracket project, we do not give a single number. We break it into stages. This is critical because each stage carries different risk.
| Lead Time Stage | Typical Duration | Key Risk |
|---|---|---|
| Material procurement | 5–15 days | Coil availability, MOQ constraints |
| Tooling setup / die change | 1–3 days | Die condition, changeover skill |
| Production run | 3–10 days | Press utilization, yield stability |
| Quality inspection & packaging | 2–5 days | Rework if yield drops |
| Inland transport to port | 1–3 days | Trucking delays, holiday closures |
| Ocean freight to U.S. port | 18–30 days | Carrier schedule, port congestion |
| U.S. customs & last-mile delivery | 3–7 days | Documentation errors, inspection holds |
Total door-to-door lead time for a typical stamped part order from Vietnam to the U.S. ranges from 33 to 73 days. That is a wide window. The supplier's job — and ours — is to narrow it.
On-Time Delivery Tracking Is Non-Negotiable
We require every supplier in our network to officially track their on-time delivery rate. If a supplier does not measure OTD, we do not proceed. It is that simple.
A reliable stamping supplier should maintain an OTD rate above 95%. Below that, you are absorbing their scheduling failures. We request at least six months of OTD data during the qualification phase. We also cross-check this data against their customer references.
The Role of Local Project Management
One of the biggest gaps in cross-border sourcing is coordination. A factory in Vietnam might produce excellent parts. But if nobody is managing the handoff between production completion and freight booking, delays accumulate silently.
This is why having a local team matters. Our seven-person Vietnam office handles supplier liaison, pre-shipment inspection, export documentation, and logistics coordination. Without this layer, U.S. buyers are often reacting to problems after they have already caused a delay.
Supply Chain Risk Management for Southeast Asia
Southeast Asian manufacturing carries specific risks that differ from China-based sourcing. Power grid reliability, monsoon-season logistics disruptions, and smaller supplier bases for specialty materials all factor in. We mitigate these through:
- Pre-qualifying backup suppliers for every critical stamping program
- Maintaining safety stock of raw materials at the primary supplier's facility
- Building realistic buffer days into every lead time quote — not optimistic ones
- Defining escalation paths so response begins within hours, not days
Financial stability of the supplier also matters. A factory that is undercapitalized may cut corners on maintenance or material quality to preserve cash flow. We assess financial health through payment behavior patterns, facility investment history, and customer base diversity. The question is simple: will this factory still be operating well in three years?
How do I ensure my supplier has the project management expertise to maintain stability throughout the product lifecycle?
A buyer once told me that his previous supplier in Asia was "great at samples, terrible at production." The first-article parts were perfect. By the third production run, dimensional drift had crept in, communication had gone quiet, and nobody on the supplier side could explain what changed.
Ensure your supplier has lifecycle project management expertise by evaluating their design-for-manufacturability input, PPAP discipline, die maintenance programs, engineering change management process, and communication responsiveness — because stability requires active management, not autopilot.
Stability Is Not a One-Time Achievement
Getting the first batch right is important. Keeping every subsequent batch right is harder. Stamping dies wear. Material lots vary. Operators rotate. Without structured project management, all of these variables erode quality slowly and silently.
Our approach treats every custom stamping project as a managed program, not a one-time transaction. This means PPAP documentation at launch, scheduled die maintenance intervals, periodic dimensional audits, and a defined process for engineering changes.
What Lifecycle Project Management Looks Like
Here is a comparison between a supplier with strong project management and one without:
| Project Phase | Strong PM Supplier | Weak PM Supplier |
|---|---|---|
| Quotation | Reviews drawings in detail, flags tolerance risks, suggests DFM improvements | Quotes based on weight and material only |
| Tooling / First Article | Runs FAI with full dimensional report, submits PPAP package | Sends samples with no supporting data |
| Production Ramp-Up | Monitors yield and cycle time, adjusts parameters proactively | Runs production and ships without monitoring |
| Ongoing Production | Tracks die hit counts, schedules preventive maintenance, updates control plans | Reacts only when parts fail at customer |
| Engineering Changes | Follows formal ECN process with revision control and re-validation | Makes changes informally, no documentation |
| End-of-Life / Transition | Manages last-buy quantities, preserves tooling | Tooling condition unknown, no transition plan |
Die Maintenance: The Hidden Driver of Long-Term Stability
Stamping dies are precision tools. They degrade with use. A progressive die running high-strength steel may need sharpening every 50,000 to 100,000 hits. Without a die maintenance program, burr height increases, dimensional tolerances drift, and scrap rates climb.
During our audits, we check whether the supplier tracks die hit counts and has a documented maintenance schedule. We also ask whether spare inserts or backup die components are available. A supplier with no spare tooling is one die failure away from a multi-week production stop.
Communication and Transparency
Process control is only as good as the communication that supports it. We expect weekly production status updates during active runs. We expect immediate notification of any quality deviation — not a surprise at final inspection. And we expect the supplier to explain their processes clearly when asked.
Transparency is a cultural and operational trait. Some suppliers resist sharing utilization or yield data, citing confidentiality. In our experience, this resistance usually signals that the data does not look good. We treat open data sharing as a non-negotiable requirement for supply chain risk management 9.
Vertical Integration Advantages
Suppliers who control design support, stamping, secondary operations, surface treatment, and packaging under one roof reduce handoff risks. Each time a part moves to a different facility for a secondary operation, lead time extends and coordination complexity increases. We prefer vertically integrated suppliers because they offer faster response times and clearer accountability.
Conclusion
Evaluating supplier delivery and capacity stability for stamping parts demands data — not promises. Demand yield rates, OTD records, die maintenance logs, and traceability proof. Visit the factory. Qualify a backup. Stability is built, not assumed.
Frequently Asked Questions
Scalability: Can They Grow with You?
Production capacity is not static. Your order might start at 5,000 pieces per month and grow to 50,000. The supplier needs scalable production capacity to handle that trajectory. Look for these indicators:
How do I verify that a stamping supplier's actual production capacity can handle my specific volume requirements?
A trade-off we weigh on every new project is whether a supplier's quoted capacity reflects real, sustainable output — or just the theoretical maximum of their press tonnage on paper on-time delivery rates 3 .
What quality control indicators should I look for to prevent production bottlenecks and delivery delays?
A buyer interaction last year made this crystal clear: a U.S. client received a batch of stamped steel brackets where 12% failed dimensional inspection. The rework cycle consumed three weeks and pushed the entire project off schedule.
Footnotes
1. Provides a general overview of the metal stamping manufacturing process. ↩︎
2. Defines the maximum output a business can produce with its current resources. ↩︎
3. Explains a key performance indicator for logistics and supply chain efficiency. ↩︎
4. Provides information on various certifications that validate quality management systems. ↩︎
5. Defines how efficiently a company uses its assets to produce goods or services. ↩︎
6. Explains the significance of tracking machine downtime for operational efficiency. ↩︎
7. Authoritative source for the automotive quality management system standard. ↩︎
8. Official information on the international standard for quality management systems. ↩︎
9. Offers a definition of supply chain risk management (SCRM) from an authoritative source (ASCM) and discusses its importance and best practices. ↩︎