I once watched a $40,000 progressive die crack mid-run because the supplier had no preventive maintenance schedule—and our client’s production line stopped for three weeks.
To evaluate a supplier’s die life management and maintenance program for stamping parts, verify their preventive maintenance schedule, stroke count tracking, tooling history logs, die repair capabilities, and documented KPIs like MTBF and scrap rates. A data-driven program with criticality tiering and condition-based monitoring significantly reduces production delay risk.
The sections below break down exactly what to look for, what documents to request, and how to separate a supplier with a real program from one that just reacts to failures PVD/CVD coatings 1. This guide draws on our hands-on experience auditing stamping suppliers across Vietnam, China, and Taiwan.
What Should I Look for in a Supplier's Preventive Die Maintenance Schedule?
During a recent supplier audit in Vietnam, our quality team found a stamping shop that serviced dies only when parts started failing dimensional checks. They had no written schedule, no stroke count tracking, and no regrinding records. The parts they shipped looked fine—until they didn't.
Look for a documented preventive maintenance schedule that defines service intervals by stroke count or tonnage, covers daily inspections through quarterly overhauls, assigns criticality tiers to each die, and includes grace period controls for deferred tasks. The schedule must be linked to a CMMS or equivalent tracking system.
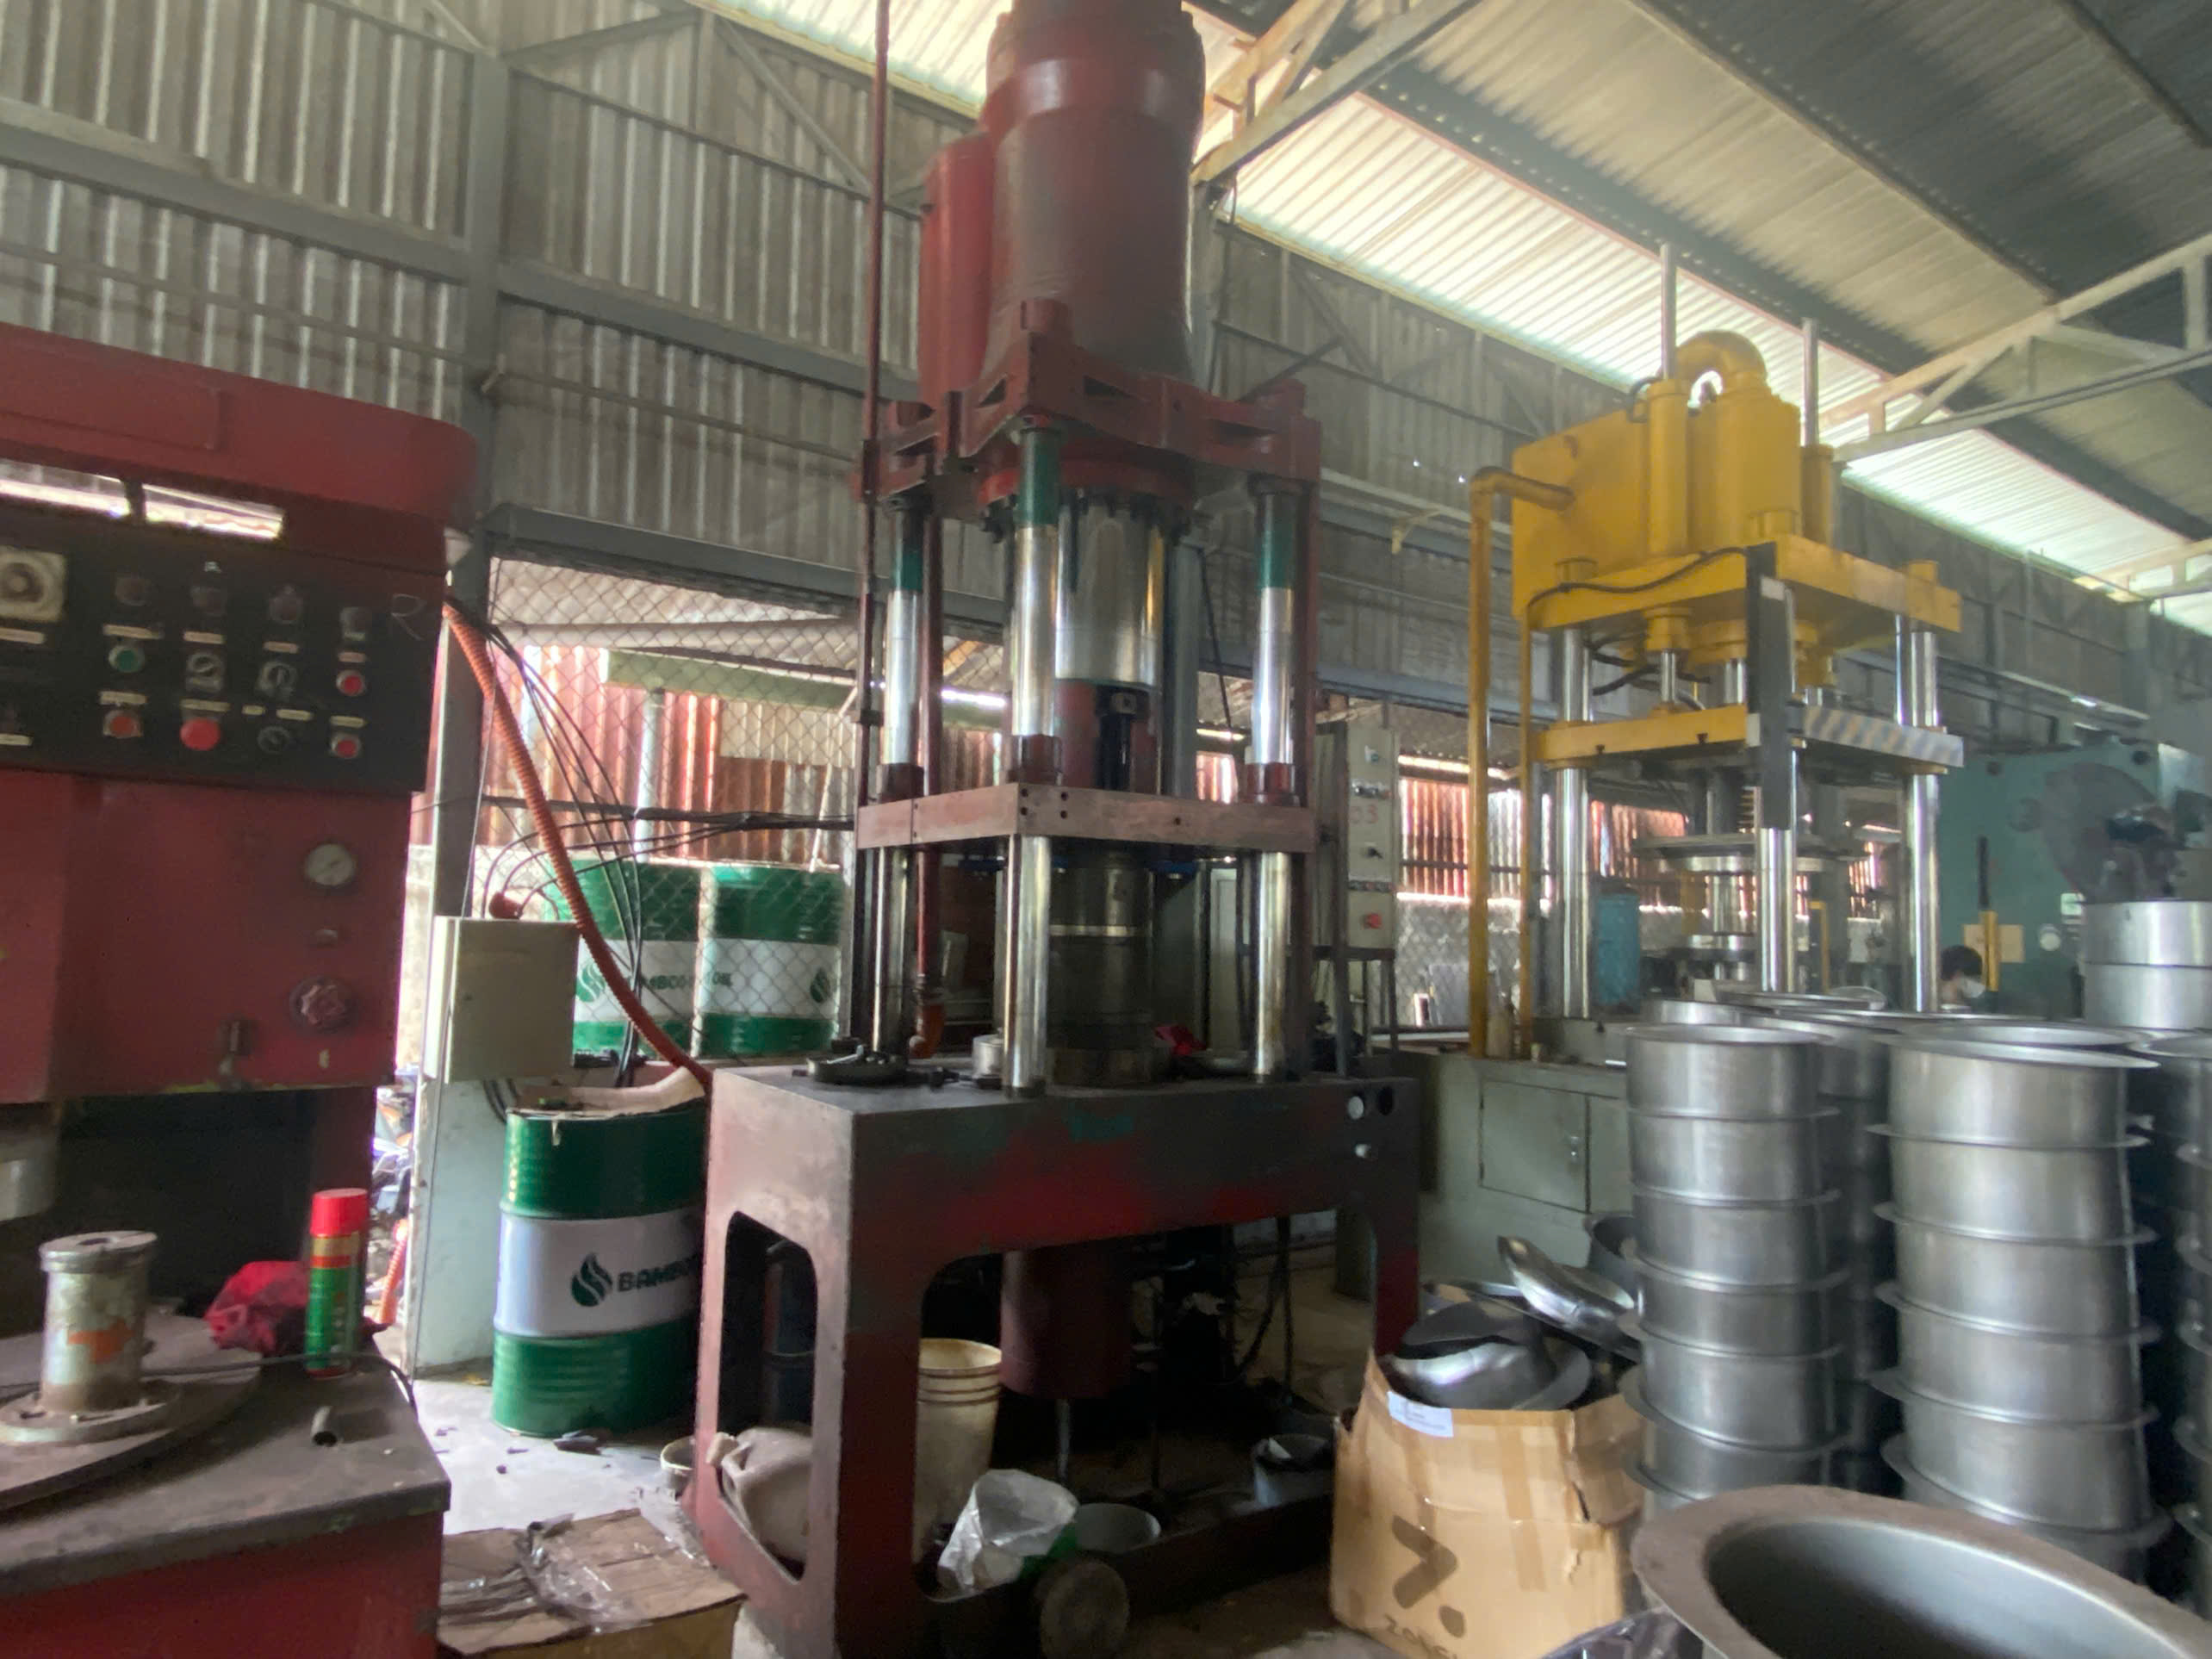
Why Stroke-Count-Based Intervals Beat Calendar-Based Schedules
A calendar-based schedule says "service every 30 days." But what if that die ran 500,000 strokes in one month and zero the next? The wear profile is completely different. Top-tier suppliers set maintenance intervals based on actual stroke counts, not calendar dates. This is a core element of any credible preventive maintenance schedule.
When we audit a facility, we look at how the supplier determines frequency. Do they use a flat calendar rule, or do they factor in material type, tool steel grades, part complexity, and production volume? A die stamping 1.5mm galvanized steel wears differently than one stamping 0.5mm aluminum. The schedule should reflect that.
The Criticality Tiering System
Not all dies deserve the same attention. A well-run shop uses criticality analysis—often based on a Risk Priority Number 2—to tier their tooling.
| Tier | Definition | Maintenance Approach | Example |
|---|---|---|---|
| Tier 1 — Critical | High-volume, hard-to-replace, tight tolerances | Predictive + Preventive (condition-based sensors, frequent inspection) | Progressive die for automotive brackets |
| Tier 2 — Important | Medium volume, moderate lead time for replacement | Preventive (stroke-count-based PM) | Forming die for electronics enclosures |
| Tier 3 — Non-Critical | Low volume, easy to replace, loose tolerances | Run-to-failure with spare parts on hand | Simple blanking die for washers |
If a supplier treats all dies the same, they are either over-maintaining cheap tools or under-maintaining critical ones. Both waste money. Both create risk.
What a Good Schedule Covers
Ask to see the actual PM work orders. A robust schedule addresses these layers:
- Daily: Visual inspection, lubrication, slug removal, sensor checks
- Weekly: Cleaning of die components, spring tension verification, pilot pin inspection
- Monthly: Regrinding and sharpening of cutting edges, measurement of critical dimensions
- Quarterly: Full teardown, replacement of wear components (punches, bushings, springs), coating inspection
The supplier should also define a grace period for deferred PM—typically 10% of the interval. If a die is due at 100,000 strokes, the grace period allows service up to 110,000. Beyond that, management approval should be required and documented. We have seen suppliers defer PM indefinitely with no controls. That is a red flag.
Time-Based vs. Condition-Based: The Hybrid Approach
There is an ongoing debate in the industry. Traditional shops favor strict time-based preventive maintenance. Modern facilities push toward condition-based predictive maintenance using die sensor technology—vibration monitors, tonnage signature analysis, and temperature sensors embedded in the tool.
The best answer is a hybrid. Critical Tier 1 dies benefit from real-time tonnage signature analysis that catches micro-anomalies before defects appear. Tier 2 dies work well with stroke-count-based PM. Tier 3 dies can run to failure if spares are available.
Ask the supplier: "How do you determine the maintenance frequency for each die?" If they cannot answer clearly, the schedule is likely arbitrary.
How Can I Verify a Supplier's Die Repair and Refurbishment Capabilities?
A buyer I work with in the Midwest once told me: "I don't care how good their dies are on day one. I care what happens on day five hundred thousand." That comment stuck with me because it captures the real question—can the supplier keep the die performing over its full life cycle?
Verify die repair capabilities by inspecting the supplier's in-house toolroom for CNC wire EDM, surface grinders, and welding equipment; reviewing their regrinding and sharpening logs with material-removal records; confirming they stock critical spare parts like punches, pilots, and springs; and checking for advanced surface engineering capabilities such as PVD/CVD coatings or cryogenic treatments.
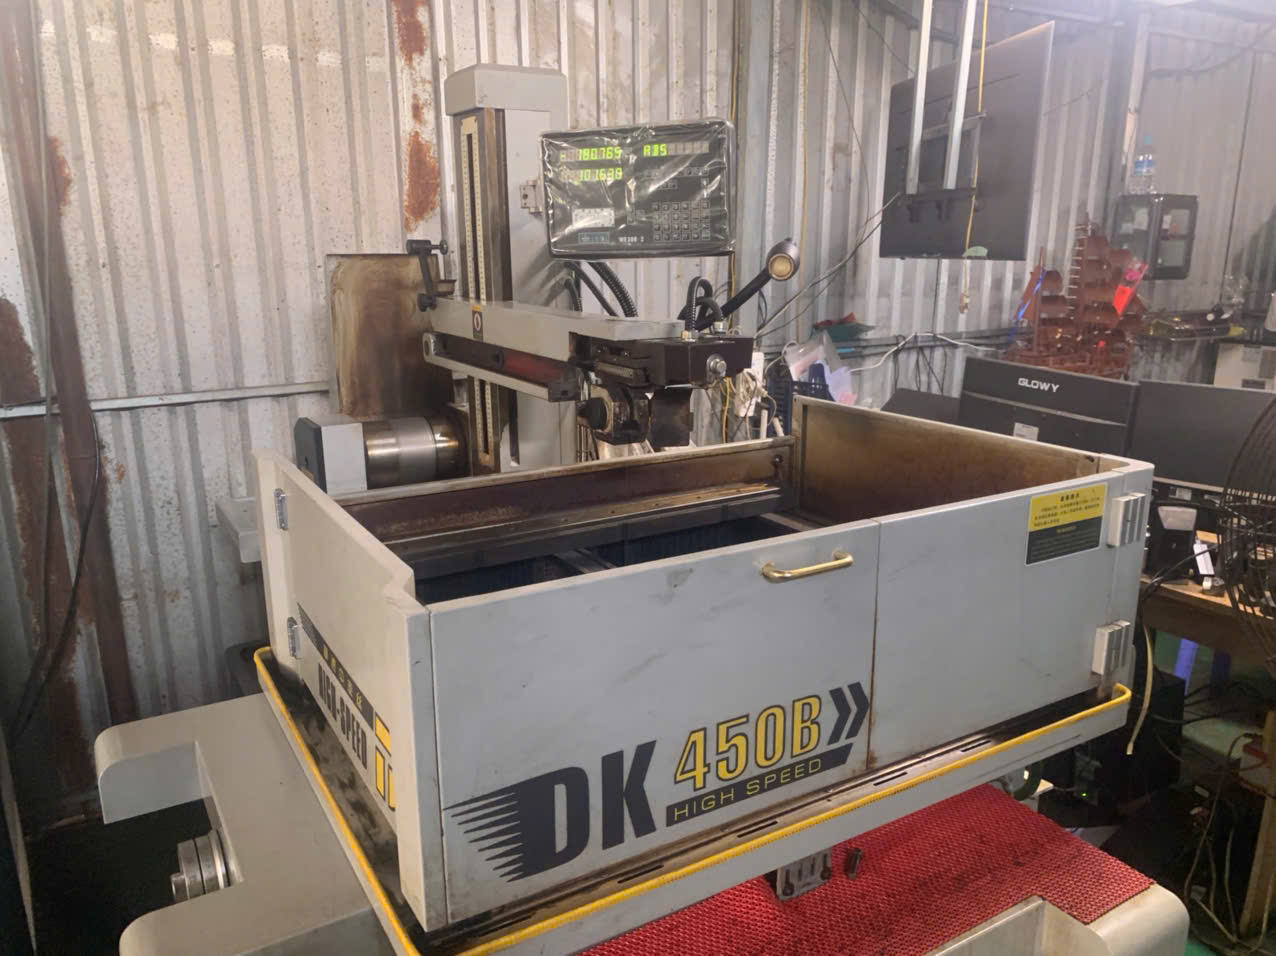
The In-House Toolroom: What Equipment Matters
When we walk through a supplier's facility, the toolroom tells us more than the production floor. A supplier that outsources all die repair has limited control over turnaround time. Here is what we expect to see for a capable operation:
| Equipment | Purpose | Why It Matters |
|---|---|---|
| CNC Wire EDM 3 | Precision cutting of die inserts and profiles | Enables accurate replacement of worn sections without full die rebuild |
| Surface Grinder | Regrinding cutting edges to restore sharpness | Essential for maintaining burr-height specifications |
| TIG/Laser Welder | Building up worn areas before re-machining | Extends die life by restoring material rather than replacing the entire component |
| CMM or Optical Comparator | Measuring refurbished components against original specs | Confirms repair meets drawing tolerances |
| Polishing Station | Finishing die surfaces after repair | Reduces friction and improves material flow in forming operations |
A supplier without at least a surface grinder and wire EDM is likely sending repairs out—which adds days or weeks to turnaround.
Regrinding Logs and Material-Removal Tracking
This is a detail many buyers overlook. Every time a die's cutting edges are reground, a small amount of tool steel is removed. Over time, this changes the die's geometry and reduces its remaining life. A well-managed supplier tracks cumulative material removal for each die component.
Ask to see regrinding and sharpening frequency records. The log should show the date, stroke count at regrinding, amount of material removed (in thousandths of an inch or hundredths of a millimeter), and who performed the work. This data lets you calculate how many regrinds remain before the component needs full replacement. Without this, the supplier is guessing.
Spare Parts Inventory Management
A die failure is only a crisis if the supplier lacks the spare parts to fix it quickly. During audits, we check for a documented spare parts inventory management system. Critical wear items—punches, pilots, die buttons, stripper springs, nitrogen cylinders—should be stocked on-site.
We ask three questions:
- Do you maintain minimum stock levels for Tier 1 die components?
- How do you track consumption and reorder points?
- What is your lead time for custom-machined replacement inserts?
If the answer to question three is "six weeks from our tooling vendor in Japan," and they have no backup stock, that is a supply chain risk you need to quantify.
Surface Engineering and Coatings
For stamping parts made from high-strength steel, stainless steel, or abrasive materials, die wear accelerates dramatically. Advanced suppliers apply PVD or CVD coatings—like TiN, TiCN, or AlCrN—to extend cutting-edge life. Some use cryogenic treatment on tool steel to improve hardness and wear resistance.
When we evaluate suppliers for our U.S. clients stamping brackets and clips from galvanized or stainless sheet metal, coating capability is a differentiator. It directly impacts how long the die runs between service intervals and how consistent part quality stays over the production run.
What Documentation Should I Request to Confirm Die Life Tracking and Wear Records?
One lesson I learned early in this business: if a supplier cannot show you the data, the program exists only on paper. I have sat in conference rooms where suppliers described elaborate maintenance systems—and then could not produce a single maintenance log when asked.
Request die history cards showing cumulative stroke counts and tonnage, maintenance logs with as-found conditions and actual work performed, scrap rate records linked to specific dies, first-piece and last-piece inspection reports, and CMMS work order histories. These documents prove whether the supplier manages die life proactively with real tooling wear analysis or reactively after failures occur.

The Die History Card: Your Single Most Important Document
The die history card is the backbone of die life tracking. It should be a living document—digital or physical—that records every significant event in a die's life. Here is what a complete die history card includes:
| Data Point | What It Tells You | Red Flag If Missing |
|---|---|---|
| Cumulative stroke count | Total usage and remaining life estimate | No way to predict when failure will occur |
| Total tonnage applied | Stress exposure over the die's life | Cannot assess if die is being overloaded |
| Maintenance dates and actions | Frequency and scope of service | Likely reactive maintenance only |
| As-found conditions | What was actually worn or damaged at service | PM tasks may be performed without real inspection |
| Regrind history with material removed | Remaining usable life of cutting edges | Supplier is guessing on edge life |
| Scrap and reject counts per run | Quality degradation trends tied to wear | No link between quality and tooling condition |
| Component replacements | Which parts were swapped and when | Cannot track spare parts consumption or forecast needs |
Linking Scrap Data to Specific Dies
This is where tooling wear analysis gets powerful. A mature supplier tracks scrap rates per die, not just per production order. If Die #A-2047 produces 0.3% scrap at 50,000 strokes but 1.8% scrap at 150,000 strokes, you can see the wear curve. You can predict when quality will degrade. You can schedule service before defects reach the customer.
We routinely ask suppliers to show us scrap trend data by die number. Suppliers who use a CMMS 4 can pull this data in minutes. Suppliers who rely on paper logs often cannot connect scrap to a specific tool. That gap tells you everything about their program maturity.
First-Piece and Last-Piece Inspection Protocols
A practice we strongly advocate—and verify during audits—is first-piece and last-piece inspection tied to the die's maintenance status. The first piece off a freshly serviced die confirms the repair was done correctly. The last piece before the die comes off the press shows how much the tool drifted during the run.
Comparing these two data points over time reveals dimensional drift patterns. If burr height increases predictably between services, you can fine-tune PM intervals. This is where Overall Equipment Effectiveness 5 starts to improve—not through guesswork, but through measurement.
IATF 16949 and Documentation Standards
For automotive stamping parts, IATF 16949 6 compliance sets specific expectations for process control, including tooling management. Even for non-automotive applications, the standard provides a useful framework. Suppliers certified to IATF 16949 are more likely to maintain the documentation rigor needed for serious die life management.
When we support PPAP 7 submissions for our clients, we pull tooling records as part of the process control plan. If the supplier's records are incomplete, it delays the PPAP and raises questions about whether the process is truly controlled.
How Do I Assess Whether a Supplier's Die Management Program Reduces My Risk of Production Delays?
Last year, one of our U.S. clients switched to a new stamping supplier in Southeast Asia to save 12% on unit cost. Within four months, they experienced two unplanned production stops totaling eleven days. The root cause both times: die failure with no spare components available. The "savings" evaporated instantly.
Assess production delay risk by reviewing the supplier's preventive-to-reactive maintenance ratio (target above 80% preventive), MTBF trends over 12+ months, PM completion rates for critical dies, contingency plans for die failure including spare tooling and backup suppliers, and evidence of continuous improvement through Plan-Do-Check-Act review cycles.
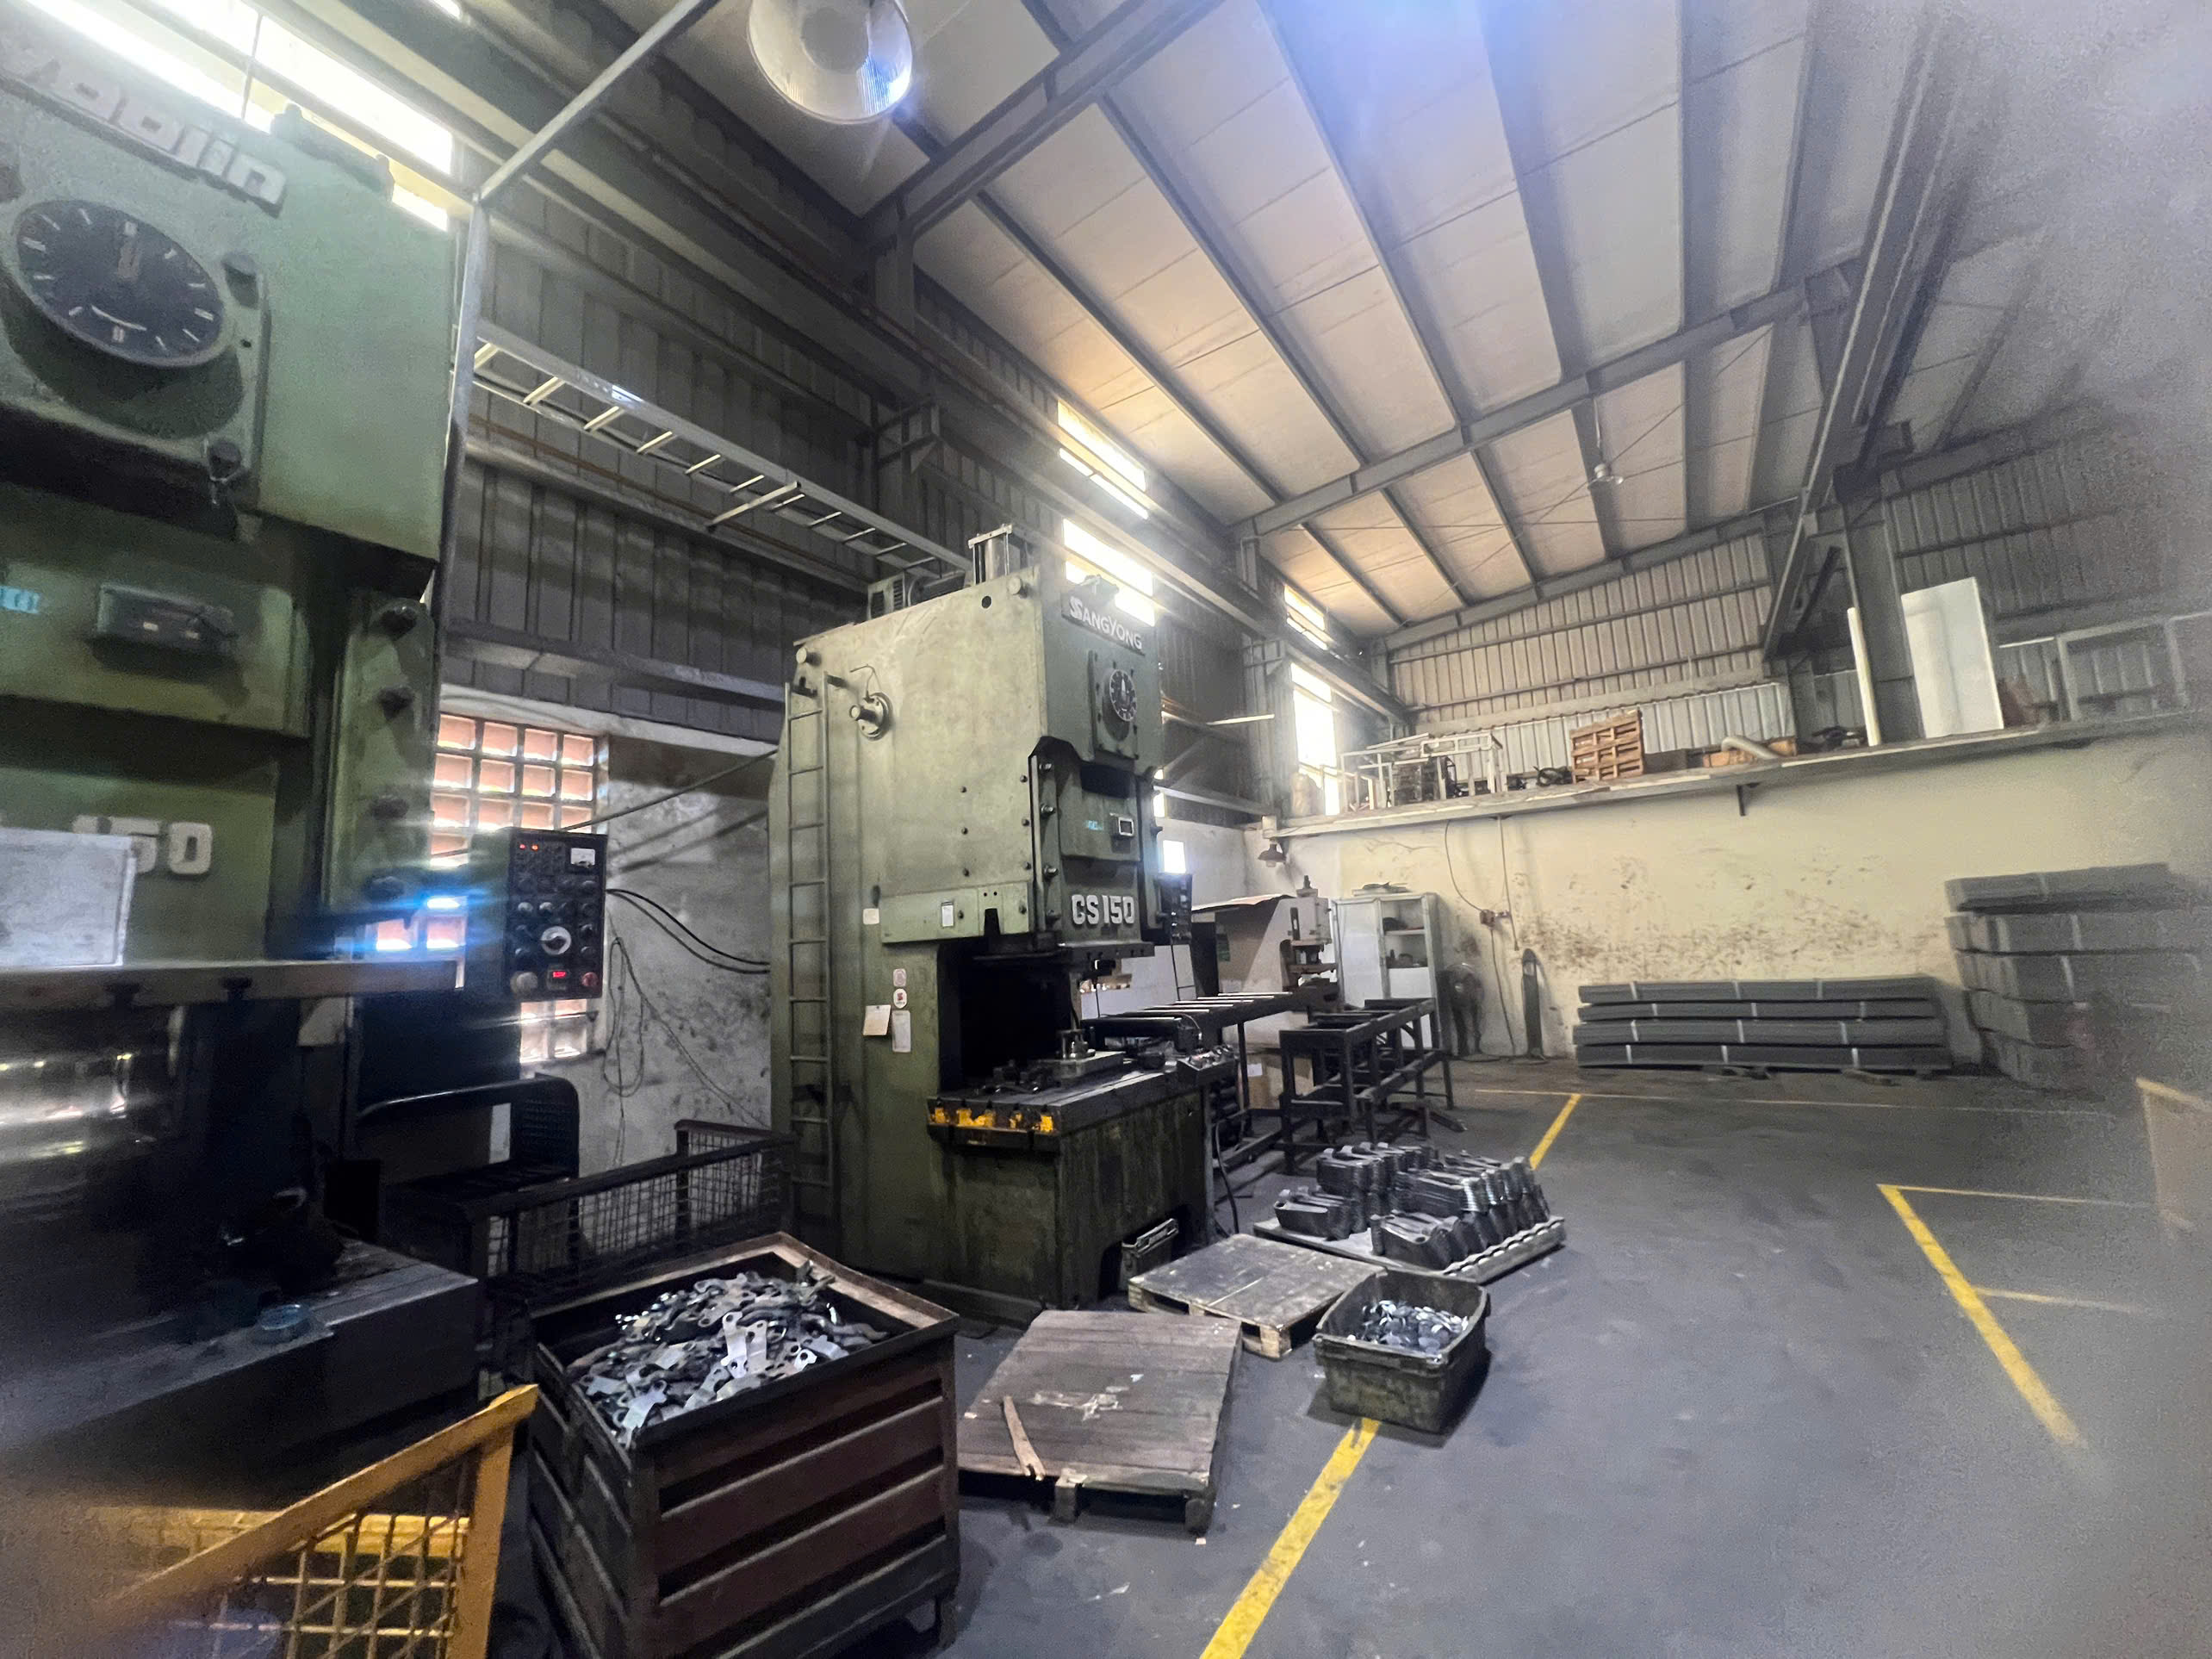
The Preventive-to-Reactive Ratio
This single metric tells you more about a supplier's die management maturity than any brochure or sales pitch. The ratio measures how much maintenance is planned versus how much is emergency response.
| Ratio Range | Program Maturity | Risk Level |
|---|---|---|
| 80–100% preventive | World-class; data-driven scheduling | Low — failures are rare and planned for |
| 60–79% preventive | Developing; some reactive gaps remain | Moderate — occasional unplanned stops |
| 40–59% preventive | Basic; mostly responding to problems | High — frequent disruptions likely |
| Below 40% preventive | Reactive; no real program in place | Very high — production delays are inevitable |
When we audit stamping suppliers, we ask for 12 months of work order data and calculate this ratio ourselves. Suppliers who track work orders in a CMMS can generate this report quickly. Those who cannot are usually deep in reactive territory.
MTBF and OEE: The Numbers That Matter
Mean Time Between Failures 8 should be trending upward over time. If a die failed every 80,000 strokes a year ago and now fails every 120,000 strokes, the maintenance program is working. If MTBF is flat or declining, something is wrong—perhaps the regrinding and sharpening frequency is too low, or the die is nearing end of life.
Overall Equipment Effectiveness combines availability, performance, and quality into a single percentage. For stamping operations, OEE above 85% is considered strong. Below 65% suggests significant losses from downtime, slow cycles, or scrap—often driven by poor progressive die maintenance.
We do not expect every supplier to calculate OEE formally. But we do expect them to measure the three components: how often the press runs (availability), how fast it runs versus rated speed (performance), and how many good parts come off versus total parts (quality). If they track all three, they can diagnose problems. If they track none, they are flying blind.
Contingency Planning
Even the best die management program cannot prevent every failure. What matters is how the supplier responds. We evaluate contingency planning by asking:
- Do you maintain backup dies for high-volume critical parts?
- What is your emergency repair turnaround time?
- Do you have relationships with external toolrooms for overflow capacity?
- Is there a documented escalation procedure when a die fails mid-run?
- How do you handle diminishing manufacturing sources for specialty tool steel or coatings?
A supplier who has thought through these scenarios is far less likely to leave you waiting.
The Human Element: Training and Culture
Technology and schedules mean nothing without skilled people. During facility visits, I pay close attention to the toolroom team. Are they experienced? Do they have regular training on progressive die maintenance techniques? Is there a culture where technicians report minor issues early—or do they wait until something breaks?
We look for evidence of Total Productive Maintenance 9 principles, where operators perform basic die care (cleaning, lubrication, visual checks) and technicians handle specialized service. This shared responsibility model catches problems earlier and extends die life.
Continuous Improvement: The PDCA Loop
A static maintenance program decays over time. Materials change. Production volumes shift. New part designs stress dies differently. The supplier must have a feedback loop.
We look for monthly reviews where maintenance data—MTBF, scrap rates, PM completion—gets analyzed. We look for quarterly deep dives into specific failure modes. And we look for evidence that findings lead to action: adjusted intervals, new coatings applied, redesigned die components.
The best suppliers we work with follow a "crawl-walk-run" progression. They start with basic PM on critical assets, expand to stroke count tracking across all dies, and eventually adopt predictive analytics with die sensor technology. We ask every supplier: "Where are you on this curve, and what is your next step?" The answer reveals whether improvement is a habit or a slogan.
Scoring the Supplier
After gathering all this information, we score the supplier's program across five dimensions. This is the framework we share with our clients when making sourcing recommendations:
| Dimension | Weight | What We Evaluate |
|---|---|---|
| Schedule & Methodology | 25% | PM intervals, criticality tiering, hybrid approach |
| Repair Capabilities | 20% | Toolroom equipment, regrind tracking, coatings |
| Documentation & Data | 25% | Die history cards, scrap linkage, CMMS usage |
| KPIs & Metrics | 15% | Preventive-to-reactive ratio, MTBF, OEE |
| People & Improvement | 15% | Training records, PDCA 10 evidence, contingency plans |
A supplier scoring below 60% overall needs significant improvement before they can reliably support a mid-to-high quality custom parts program. We share the scorecard openly with the supplier so they know exactly what to improve.
Conclusion
Evaluating a supplier's die life management program comes down to verifiable data, structured processes, skilled people, and continuous improvement. Do not accept promises—request the documentation, calculate the ratios, and score the program yourself.
Frequently Asked Questions
What Should I Look for in a Supplier's Preventive Die Maintenance Schedule?
During a recent supplier audit in Vietnam, our quality team found a stamping shop that serviced dies only when parts started failing dimensional checks. They had no written schedule, no stroke count tracking, and no regrinding records. The parts they shipped looked fine—until they didn't.
How Can I Verify a Supplier's Die Repair and Refurbishment Capabilities?
A buyer I work with in the Midwest once told me: "I don't care how good their dies are on day one. I care what happens on day five hundred thousand." That comment stuck with me because it captures the real question—can the supplier keep the die performing over its full life cycle?
What Documentation Should I Request to Confirm Die Life Tracking and Wear Records?
One lesson I learned early in this business: if a supplier cannot show you the data, the program exists only on paper. I have sat in conference rooms where suppliers described elaborate maintenance systems—and then could not produce a single maintenance log when asked.
Footnotes
1. Explains coating processes extending cutting-edge life on stamping dies. ↩︎
2. Risk Priority Number originates from FMEA methodology used for criticality tiering. ↩︎
3. Background on wire EDM technology used for precision die repair. ↩︎
4. Government resource describing computerized maintenance management systems used for tracking. ↩︎
5. Standard manufacturing KPI combining availability, performance and quality. ↩︎
6. Official standard page for automotive quality management referenced for tooling documentation. ↩︎
7. Authoritative Wikipedia entry providing a comprehensive overview of the Production Part Approval Process standard. ↩︎
8. Defines the MTBF metric used to evaluate maintenance program effectiveness. ↩︎
9. Framework referenced for shared maintenance responsibility between operators and technicians. ↩︎
10. Explains the Plan-Do-Check-Act cycle used for continuous improvement in maintenance programs. ↩︎