A buyer once told me his supplier quoted the lowest piece price — then buried him in hidden charges for wasted material and rework on every shipment of custom brackets.
To evaluate supplier scrap and yield rates when sourcing sheet metal fabrication, request value-based scrap metrics, verify nesting software efficiency, benchmark against the industry average of 1.4% scrap-to-sales ratio, and audit quality systems on-site — because total landed cost depends far more on yield performance than on quoted piece price.
This article walks through the exact formulas, benchmarks, RFQ questions, and facility-tour signals you need to separate high-performing fabricators from those who quietly pass their waste costs on to you.
How do high scrap rates in sheet metal fabrication impact my total landed cost?
Last quarter, we helped a U.S. client re-source a set of heavy-duty mounting brackets — parts with multiple precise folds, angular cutouts, and pre-drilled holes — and the previous supplier's hidden scrap costs had inflated landed cost by nearly 12% sheet metal fabrication 1.
High scrap rates inflate your total landed cost by increasing raw material consumption, adding rework labor, extending lead times, and triggering re-runs — a fabricator running at the U.S. average of 1.4% scrap-to-sales wastes roughly $70,000 per year on a $5 million revenue base, and that cost flows directly into your pricing.
Understanding Yield vs. Scrap in Sheet Metal
Yield is the percentage of raw material that becomes finished, conforming parts. Scrap is everything else: skeleton waste from cutting, rejected parts, rework failures, and re-runs. When a nesting software 2 reports 67% "actual efficiency," it means a 40-square-foot sheet produces only 26.8 square feet of usable parts. The remaining 13.2 square feet is unavoidable skeleton plus avoidable waste.
Most buyers never see this number. They see a piece price. But that piece price has the supplier's scrap assumption baked in. If a supplier assumes 5% scrap and actually runs at 8%, they either absorb the loss (unlikely long-term) or find ways to recover — material downgrades, thinner gauges, skipped inspections.
The Real Dollar Impact
Here is a simple breakdown of how scrap percentages translate to annual cost for different shop sizes:
| Annual Revenue | Scrap at 1.4% (Average) | Scrap at 2.5% | Scrap at 5.0% |
|---|---|---|---|
| $1 million | $14,000 | $25,000 | $50,000 |
| $5 million | $70,000 | $125,000 | $250,000 |
| $10 million | $140,000 | $250,000 | $500,000 |
These figures cover direct material waste only. Add rework labor, machine time for re-runs, and shipping delays, and the cost of poor quality multiplies quickly.
How Scrap Costs Hide in Your Quote
A supplier quoting $2.50 per bracket may be running at 3% scrap and padding the price accordingly. Another quoting $2.80 may run at 0.8% scrap with near-zero rework. The second supplier's total program cost — including fewer rejected shipments, no re-orders, and on-time delivery — is almost always lower.
When our team in Vietnam audits a potential fabricator, we look at the gap between quoted material usage and actual material purchase orders. A wide gap signals hidden scrap. We also check whether raw material quality is consistent, because inconsistent incoming steel is one of the top root causes of elevated defect rates.
The lesson: never evaluate a sheet metal supplier on piece price alone. Total cost of ownership — including reliability, dimensional accuracy, and delivery stability — determines your real landed cost.
How can I verify that a supplier's reported yield rates match their actual quality performance?
During a recent supplier audit in Southeast Asia, we asked the factory manager for scrap data and received a polished spreadsheet showing 0.5% — but the dumpster outside the laser-cutting bay told a very different story.
To verify reported yield rates, cross-reference management scrap reports against actual material purchase records, conduct quarterly tracking of scrapped parts plus rework hours plus re-runs divided by revenue, and perform on-site audits that include shop-floor observation, inspection equipment checks, and review of non-conformance logs.
Management-Reported Scrap vs. Honest Scrap
Many fabricators understate scrap in management reports. They count only parts thrown in the bin and ignore rework hours, re-runs, and parts that shipped but were later returned. The honest scrap rate formula is:
Honest Scrap Rate = (Scrapped Parts Cost + Rework Labor Cost + Re-Run Material Cost) ÷ Total Revenue × 100
Track this over one full quarter to get a reliable number. Anything less than a quarter can be skewed by a single large job.
Three Formulas You Should Know
| Method | Formula | Best Use Case |
|---|---|---|
| By Count | (Scrapped units ÷ Total units produced) × 100 | High-volume, uniform parts |
| By Mass | (Scrap weight ÷ Total material weight processed) × 100 | Mixed part sizes on same material |
| By Value | (Scrap material value ÷ Total material value consumed) × 100 | Multi-material shops; prioritizes financial impact |
Value-based scrap measurement is gaining traction because it focuses waste reduction efforts on the most costly materials. If a supplier scraps ten parts in mild steel and two parts in stainless steel, the count-based rate looks steel-heavy — but the value-based rate may reveal stainless as the bigger financial problem.
Practical Verification Steps
When our team audits a sheet metal fabricator, we follow a specific sequence:
- Request raw material purchase records for the past six months. Compare total kilograms purchased against total kilograms shipped as finished goods. The gap is your real material utilization indicator.
- Review non-conformance reports (NCRs). A supplier with zero NCRs is either world-class or dishonest. Look for a steady, documented stream of issues with clear root cause analysis 4 and corrective actions.
- Inspect the rework area. Every shop has one. Ask to see it. The volume of parts sitting there, and how long they have been there, tells you more than any spreadsheet.
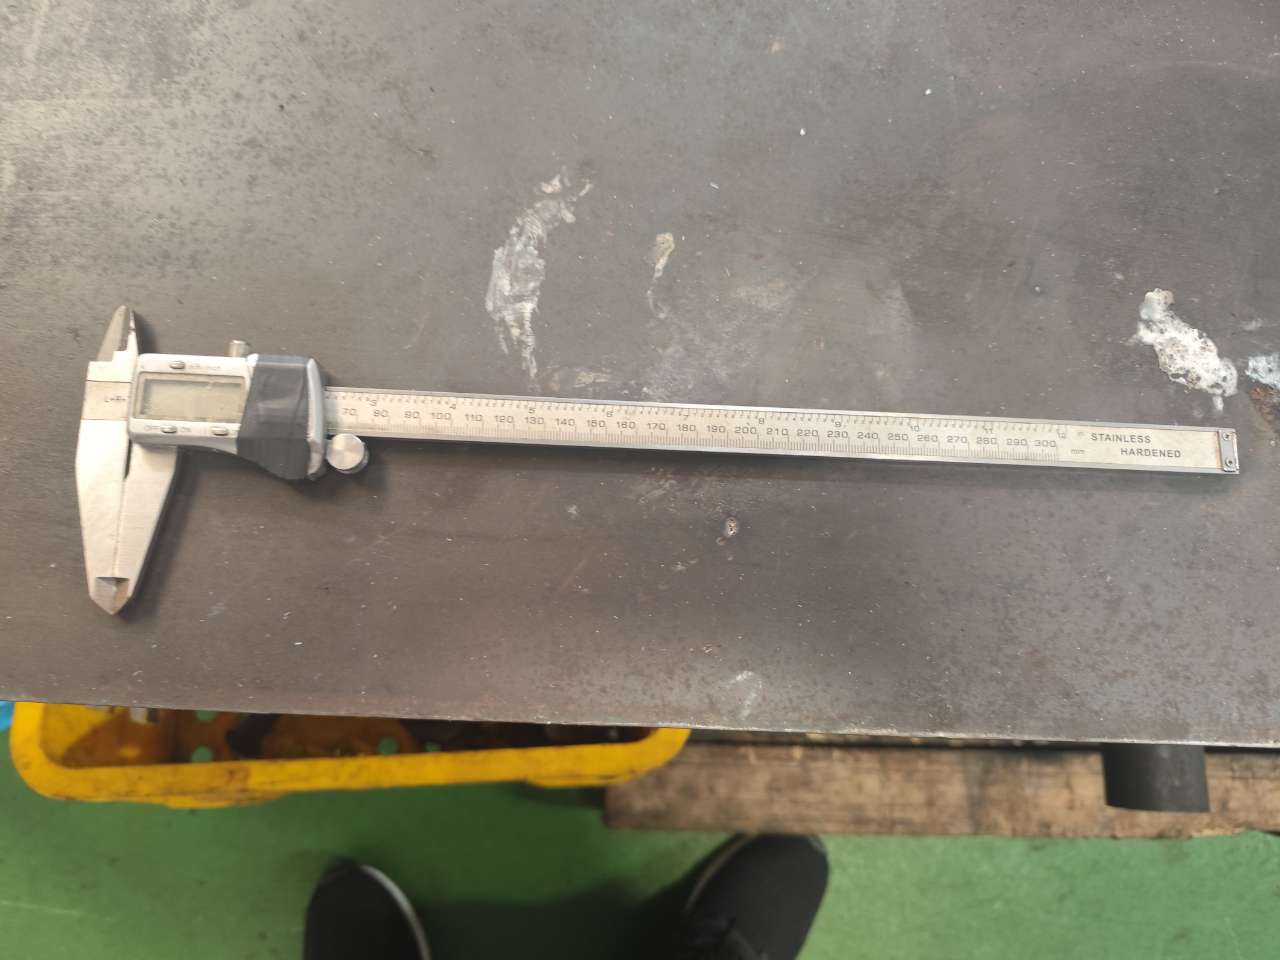
- Check inspection equipment calibration records. Quality control is only as good as the measurement tools. If calipers and CMMs have not been calibrated recently, reported yield rates are unreliable.
- Ask for customer return data. Returns represent scrap that left the building. They are the most expensive kind.
A supplier with active, operational quality systems will welcome these questions. One that resists or deflects is a red flag. Certifications like ISO 9001 5 matter — but only if they are actively practiced on the shop floor, not just framed on the conference room wall.
What specific yield metrics should I request to evaluate a factory's technical capability?
One trade-off we weigh constantly when qualifying new fabricators is whether the factory tracks production efficiency at a granular, machine-level basis or only reports aggregate numbers — because granular data reveals true manufacturing process optimization capability.
Request nesting software actual efficiency per material type, first-pass yield rate, scrap-to-sales ratio by quarter, rework hours as a percentage of total production hours, and customer return rate — these five supplier performance metrics together reveal whether a factory's technical capability is genuinely competitive or merely adequate.
The Five Key Metrics Explained
Here is a reference table for each metric, what it measures, and what good performance looks like:
| Metric | What It Measures | Industry Average | Top Quartile |
|---|---|---|---|
| Nesting Actual Efficiency | Percentage of sheet converted to parts | 60–70% | 75%+ |
| First-Pass Yield 7 | Parts passing inspection on first attempt | 92–95% | 98%+ |
| Scrap-to-Sales Ratio | Total scrap cost as % of revenue | 1.4% | < 1.0% |
| Rework Hours (% of production) | Labor spent fixing defects | 3–5% | < 2% |
| Customer Return Rate | Parts returned by buyers | 1–2% | < 0.5% |
Nesting Software and Material Utilization
Data-driven nesting is one of the strongest indicators of a technically capable fabricator. Modern nesting software does more than arrange parts on a sheet. It mines historical data to establish an average "actual efficiency" per material and thickness. That number then feeds into the MRP system 8 for smarter buy suggestions, reducing over-ordering and raw material waste.
Ask the supplier: "What is your average actual efficiency for 2mm mild steel?" If they cannot answer, they are not tracking it. If they answer with a single number for all materials, they are not tracking it well enough.
For example, at 67% actual efficiency on a 40-square-foot sheet, the factory gets 26.8 square feet of parts. On a 60-square-foot sheet, it gets 40.2 square feet. That efficiency gap — even a few percentage points — compounds across thousands of sheets per year.
AI-Native ERP and Real-Time Signals
A growing number of fabricators now use AI-native ERP systems that surface shop-floor signals in real time. These systems routinely cut scrap by 20–30% by catching process drift, tool wear, and material inconsistencies before they produce bad parts. If a supplier mentions real-time production monitoring or predictive analytics, that is a strong positive signal for production efficiency and low defect rates.
RFQ Capability Questions That Reveal Risk
When building your supplier evaluation checklist, include these questions in your RFQ:
- Which fabrication steps are in-house and which are subcontracted? Subcontracted critical steps increase supply chain management risk.
- What is your current capacity utilization? A factory running at 95% has no buffer for your urgent orders.
- What inspection equipment do you use, and when was it last calibrated?
- Describe your non-conformance process. What happens when a part fails inspection?
- Do you offer DFM support before production starts?
- Who owns the tooling, and where is it stored?
- What is included in your quoted price — material, finishing, inspection, packaging, freight?
A factory that answers these questions openly and with specifics is demonstrating the transparency that correlates with low scrap and high yield.
How do I ensure my supplier's scrap management doesn't cause delays in my project timeline?
We learned this the hard way when a bracket order — parts with complex angular bends and multiple mounting holes, very similar to the components we regularly source — was delayed two weeks because the supplier ran out of material mid-run after scrapping 15% of the first batch.
Ensure your supplier's scrap management does not cause delays by requiring safety stock provisions in the material plan, mandating real-time production reporting at key milestones, building re-run time into the project schedule, and verifying that the supplier's continuous improvement process actively reduces repeat failure modes.
Why Scrap Causes Delays
Scrap does not just waste material. It wastes time. Every scrapped part must be re-cut, re-formed, and re-inspected. If the supplier did not order enough raw material to cover the scrap allowance, they must reorder — adding days or weeks. If the scrap was caused by a tooling problem, the tool must be repaired or replaced before production can resume.
For complex sheet metal parts with precise folds, weld joints, and tight dimensional accuracy requirements, a single process parameter error can scrap an entire batch. The cascade effect hits your timeline hard.
Building Scrap Allowance Into the Plan
Work with your supplier to agree on a realistic scrap allowance upfront. This should be based on the supplier's historical data for similar parts and materials, not an optimistic guess.
A practical approach:
- Review the supplier's first-pass yield for comparable parts. If it is 95%, plan for 5% extra material.
- Add a buffer for new part introduction. First runs always have higher scrap. We typically recommend 8–10% extra material on first articles.
- Confirm the supplier's material lead time. If they scrap more than expected, how fast can they get replacement material? For specialty alloys, this can be four to six weeks.
Facility Tour Signals That Predict On-Time Delivery
When our team visits a fabricator, we look for specific signals that correlate with low scrap risk and schedule reliability:
- Shop floor organization. A clean, well-organized factory with marked material staging areas and labeled WIP racks indicates disciplined process control.
- Root cause analysis boards. Visible problem-solving displays — 5-Why analyses 9, fishbone diagrams, corrective action logs — show that the factory learns from failures instead of repeating them.
- Low employee turnover. Experienced operators make fewer mistakes. Ask how long the senior press brake and laser operators have been with the company.
- Continuous improvement evidence. Look for before-and-after photos, kaizen event records, or productivity trend charts. A factory that actively pursues manufacturing process optimization will have lower scrap and fewer delays over time.
Strategic Sourcing Tactics to Protect Your Timeline
Seasonal price trends affect both material cost and availability. Construction season (spring and summer in the Northern Hemisphere) drives up steel demand and prices. Placing orders during off-peak months can reduce both cost and lead time risk.
Also ensure your supplier documents any material downgrades properly. If a supplier substitutes a lower grade without documentation, you may face dimensional accuracy problems downstream. Insist on full material traceability — certificates of conformity for every heat lot — so that if scrap spikes, you can quickly identify whether incoming raw material quality was the root cause.
Understanding supplier capacity metrics that ensure on-time delivery is equally important when assessing whether a fabricator can absorb scrap-related disruptions without impacting your schedule.
Conclusion
Evaluate supplier scrap and yield rates by requesting value-based metrics, benchmarking against top-quartile performance below 1.0%, auditing quality systems on-site, and building realistic scrap allowances into your project plan — your total landed cost depends on it.
Frequently Asked Questions
How do high scrap rates in sheet metal fabrication impact my total landed cost?
Last quarter, we helped a U.S. client re-source a set of heavy-duty mounting brackets — parts with multiple precise folds, angular cutouts, and pre-drilled holes — and the previous supplier's hidden scrap costs had inflated landed cost by nearly 12% sheet metal fabrication 1 .
How can I verify that a supplier's reported yield rates match their actual quality performance?
During a recent supplier audit in Southeast Asia, we asked the factory manager for scrap data and received a polished spreadsheet showing 0.5% — but the dumpster outside the laser-cutting bay told a very different story.
What specific yield metrics should I request to evaluate a factory's technical capability?
One trade-off we weigh constantly when qualifying new fabricators is whether the factory tracks production efficiency at a granular, machine-level basis or only reports aggregate numbers — because granular data reveals true manufacturing process optimization capability.
Footnotes
1. Defines sheet metal fabrication processes and applications. ↩︎
2. Defines nesting software and its application in manufacturing. ↩︎
3. Explains the components and importance of total landed cost. ↩︎
4. Replaced HTTP 403 link with a Wikipedia article on Root Cause Analysis, a reliable and accessible source. ↩︎
5. Official source for the ISO 9001 quality management standard. ↩︎
6. Explains what a non-conformance report is in quality management. ↩︎
7. Defines First-Pass Yield as a key quality metric. ↩︎
8. Provides an overview of Material Requirements Planning (MRP) systems. ↩︎
9. Describes the 5 Whys technique for problem-solving in quality. ↩︎