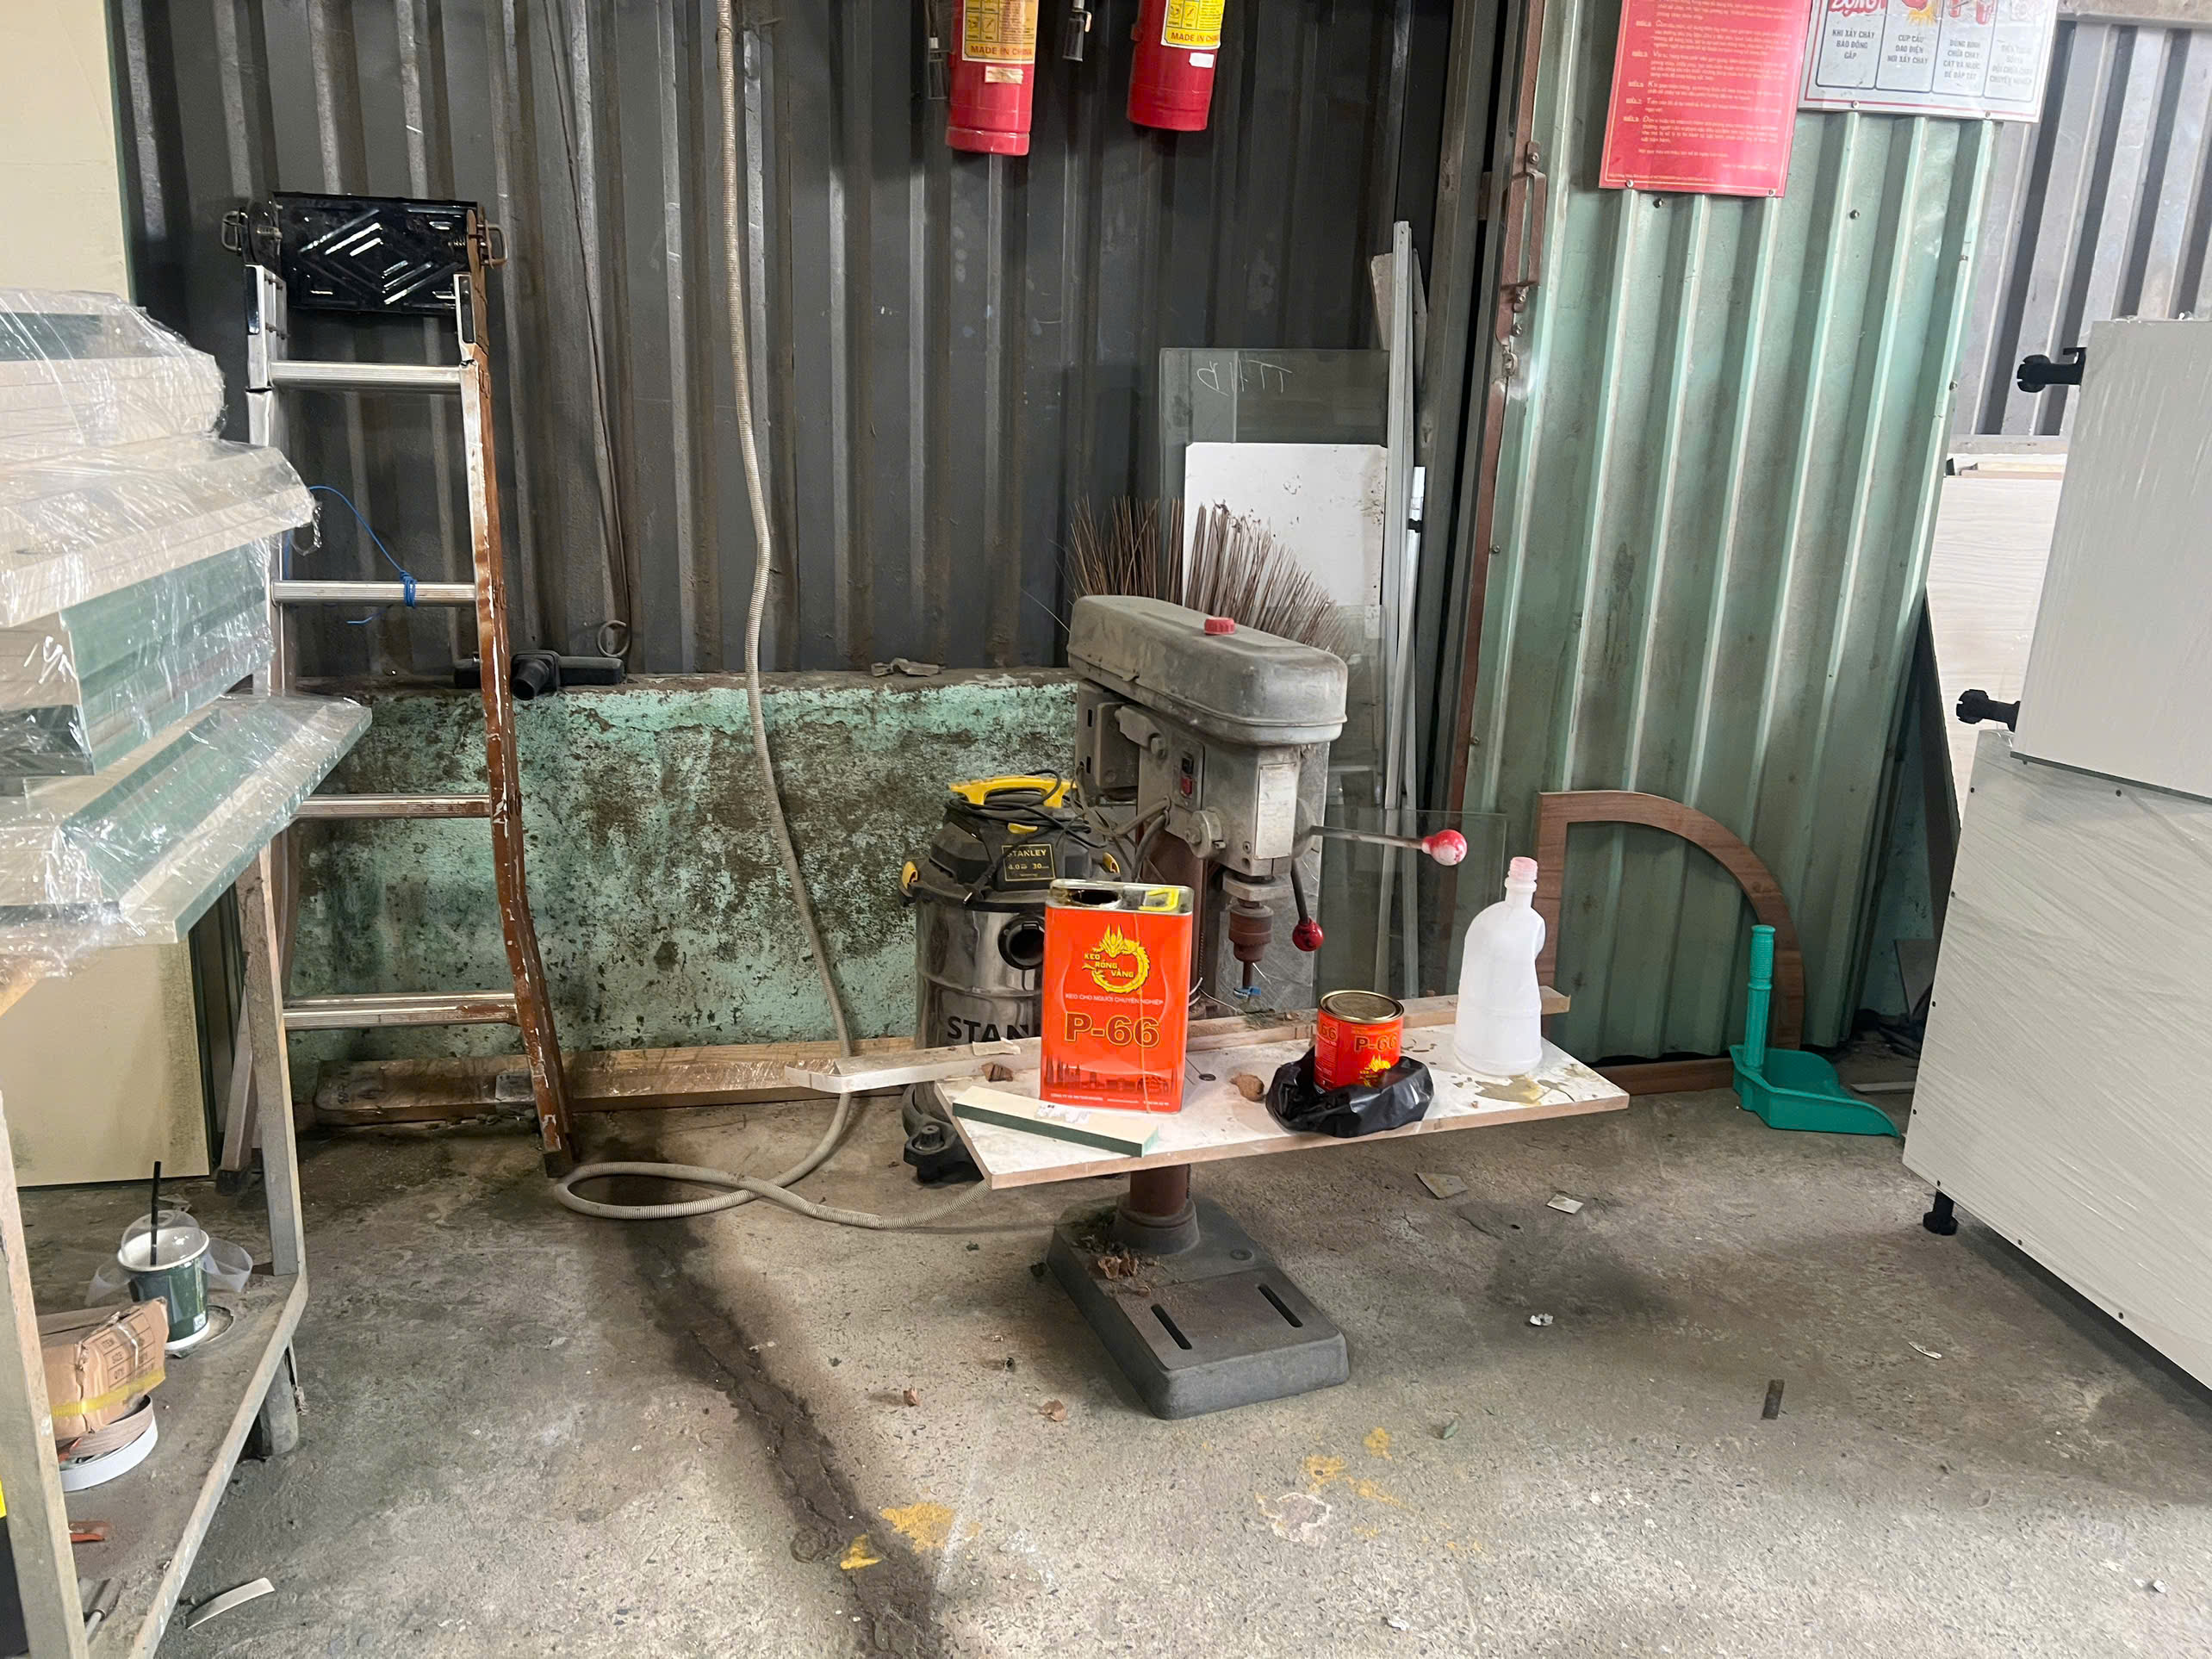
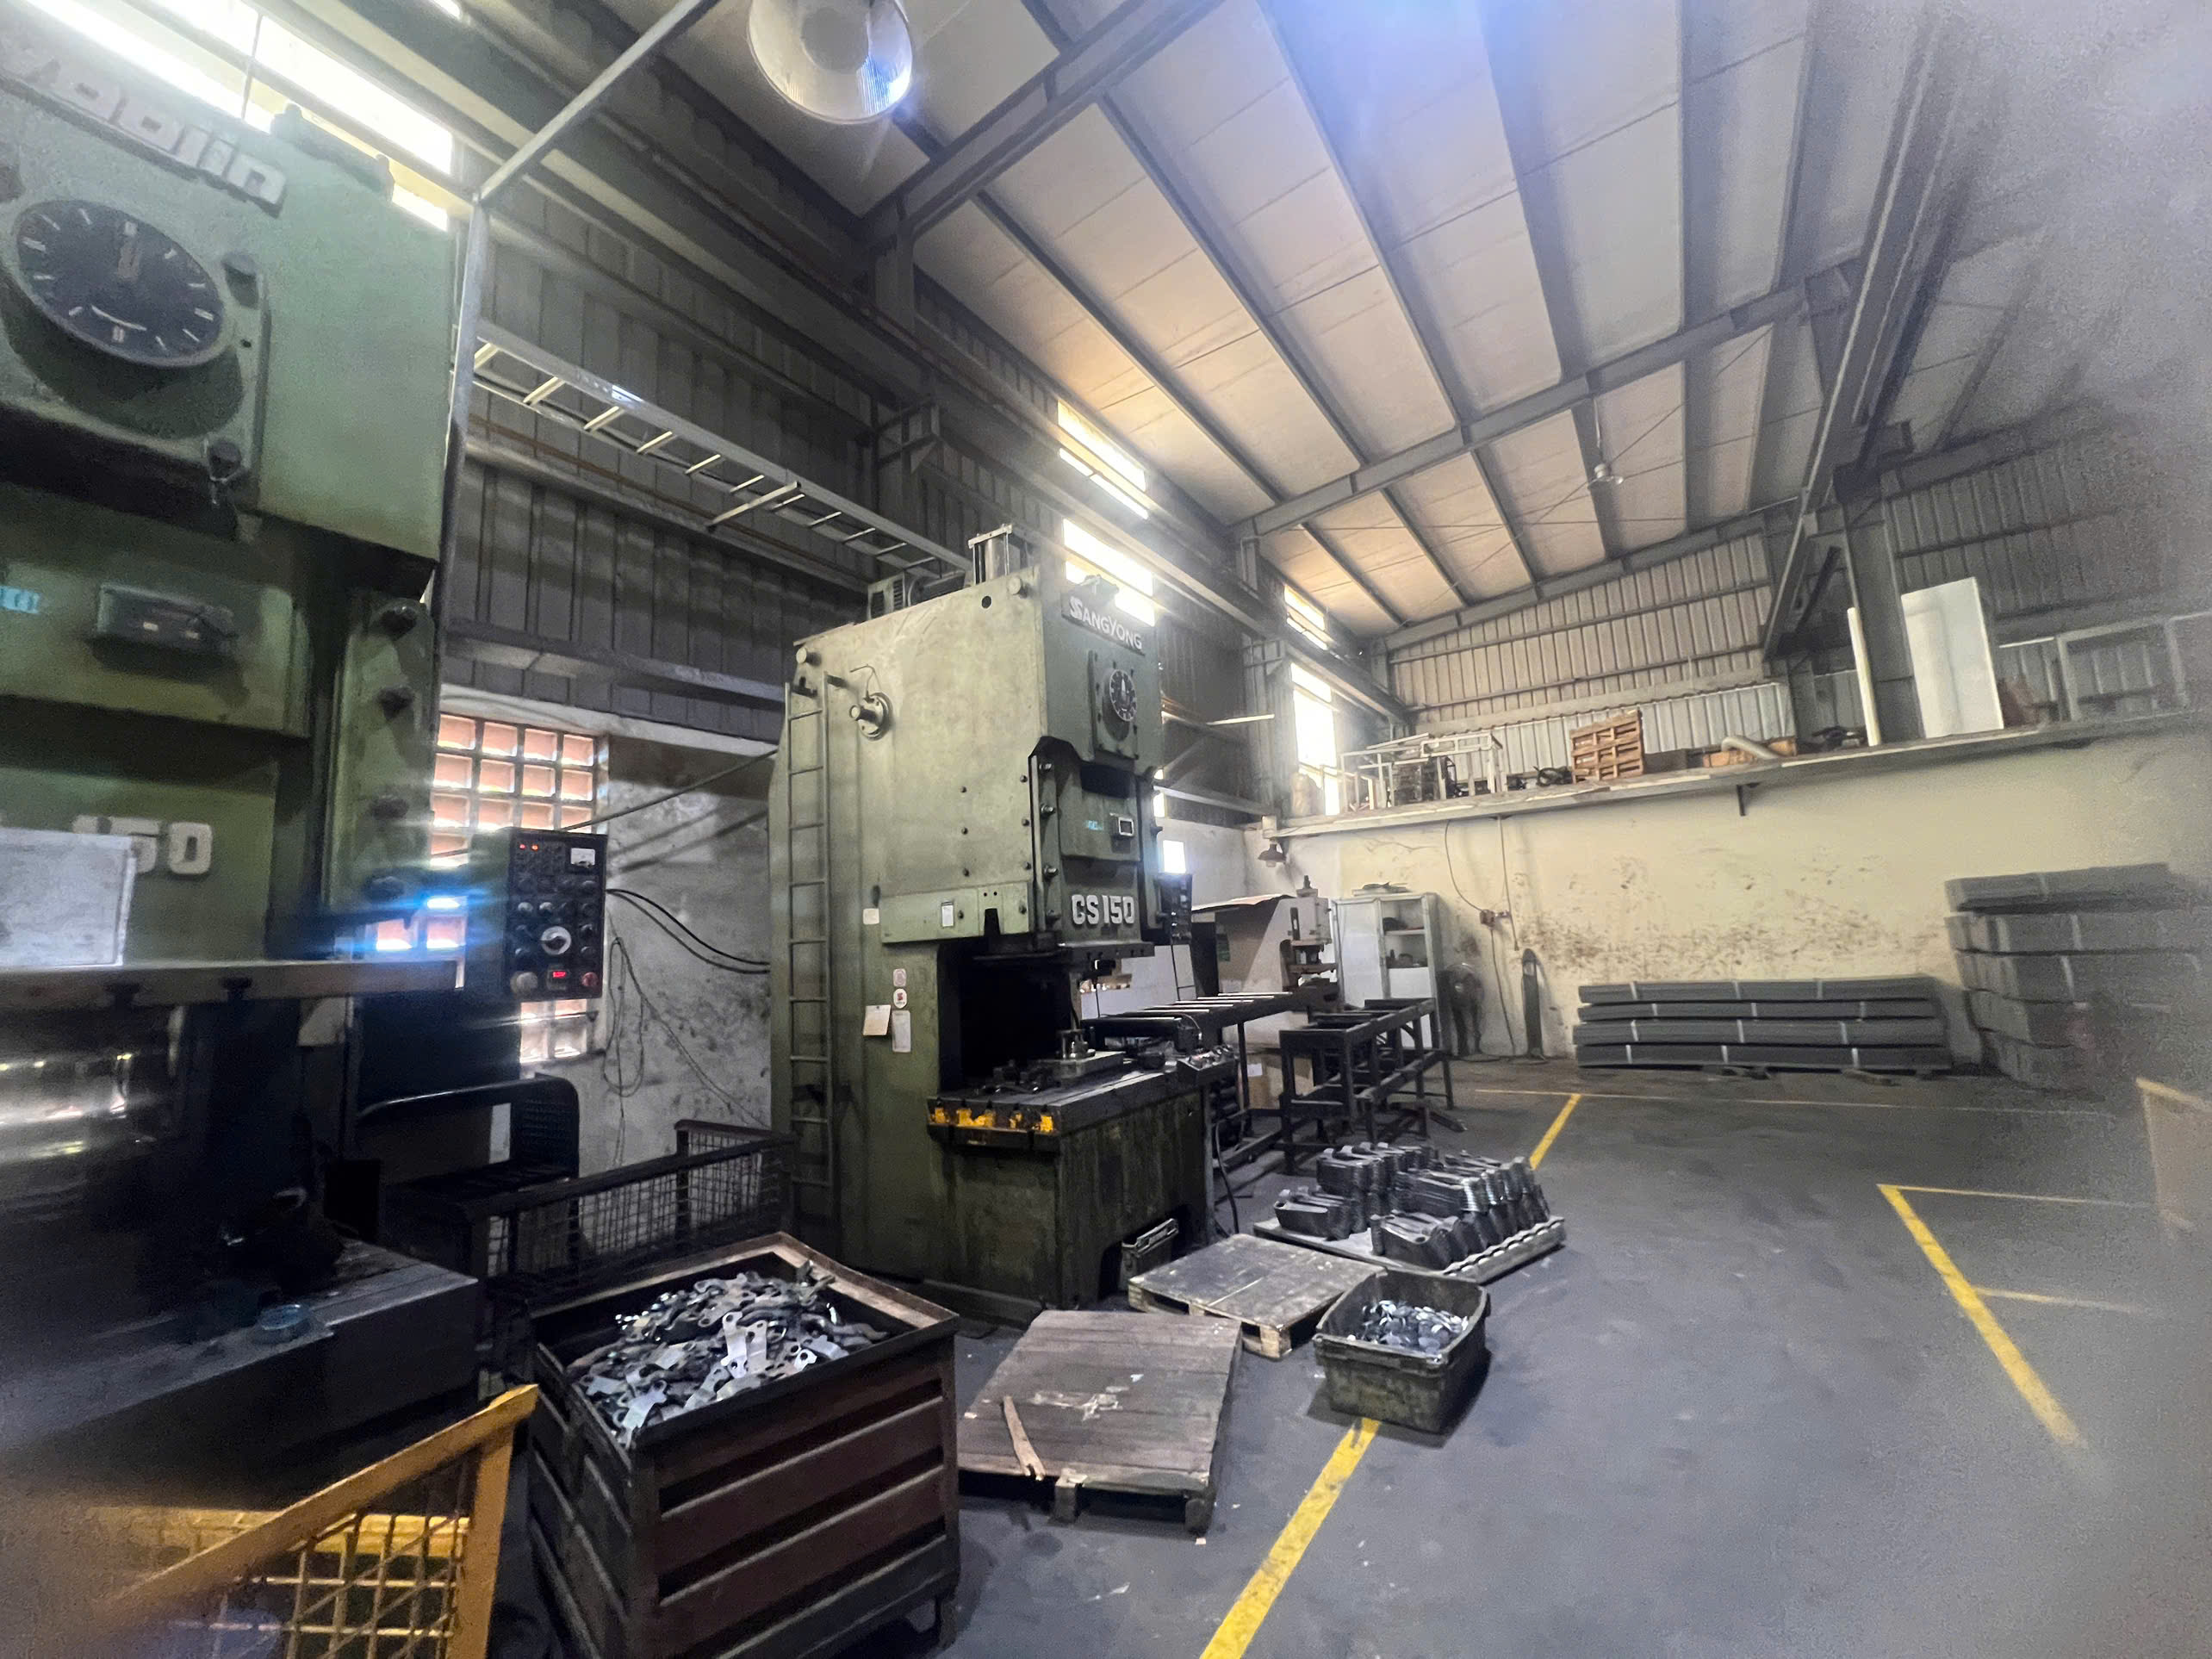
A missed shipment of progressive die stamping 1 brackets once halted our client’s assembly line for eleven days — and that single stock-out cost more than a year of carrying extra inventory would have.
Safety stock for Vietnam stamping parts is a calculated buffer inventory that absorbs lead time variability, demand spikes, and supplier delays. Plan it by combining historical demand data, logistics lead times, and target service levels using proven formulas tailored to your specific sourcing route and part criticality.
Below, I walk through the exact methods our team uses when helping U.S. buyers build resilient inventory plans around Vietnamese stamping suppliers. Each section covers a different angle — from formulas to logistics to quality risk — so you can pick the approach that fits your data and budget.
How do I calculate the ideal safety stock level for my custom stamping parts from Vietnam?
When we onboard a new stamping program for a U.S. client, the very first question our planning team asks is: "How much variability should we expect?" The answer drives every number that follows.
Calculate ideal safety stock by choosing a formula that matches your data: use the Average-Max method if you have peak and average figures, the statistical Z-score method if you track standard deviations, or the simple safety-days method if you need a quick baseline for your custom stamping parts.
Choosing the Right Formula
Not every buyer has the same data on hand. Some have years of ERP history; others are launching a first-run program. Here is a decision guide we share with clients during project kick-off:
| Situation | Recommended Method | Data You Need |
|---|---|---|
| You have historical max and average sales plus lead times | Average-Max method 2 | Max daily demand, max lead time, avg daily demand, avg lead time |
| You track standard deviation and want precision | Statistical (Z-score) method | Std dev of demand, avg lead time, desired service level |
| You need a fast estimate for budgeting | Safety-Days method | Avg daily demand, number of buffer days |
Average-Max Method Walk-Through
This is the formula I recommend most often for teams just starting inventory optimization on Vietnamese stamping parts:
Safety Stock = (Max Daily Sales × Max Lead Time) − (Avg Daily Sales × Avg Lead Time)
Suppose your custom mounting bracket sells a maximum of 150 units per day and takes up to 10 days to arrive. Your average daily demand is 100 units and typical lead time is 7 days.
Safety Stock = (150 × 10) − (100 × 7) = 1,500 − 700 = 800 units
That buffer absorbs both demand spikes and delivery delays in one calculation. It is simple, transparent, and easy to explain to leadership.
Statistical Method for Greater Precision
When our engineering and logistics teams have enough shipment history, we move clients to the statistical approach:
Safety Stock = Z × σD × √LT
Where Z is the service-level factor (1.65 for 95 %), σD is the standard deviation of daily demand, and LT is the average lead time in days.
Example: Z = 1.65, σD = 20 units, LT = 7 days → Safety Stock = 1.65 × 20 × 2.65 ≈ 87 units.
This method is more sensitive to actual variability and avoids over-stocking when your demand is relatively stable but lead time variability is the real risk.
Safety-Days Method
For a quick sanity check during quoting, multiply average daily sales by a chosen number of buffer days:
Safety Stock = 100 units/day × 5 safety days 3 = 500 units
I typically recommend 5–10 safety days for ocean-shipped stamping parts from Vietnam. The exact number depends on how reliable the logistics route has been over the last six months.
Which Method Wins?
There is no single winner. In our experience coordinating shipments from Ho Chi Minh City to ports in Los Angeles and Houston, we often start with the safety-days method during quoting, switch to Average-Max once the program is live, and graduate to the statistical method 4 after three to four shipments provide enough data for demand forecasting accuracy.
How can I account for Vietnam-to-US logistics lead times in my inventory planning?
Last quarter, a typhoon warning in the South China Sea 5 added nine days to a shipment of stamping brackets our team was tracking for a Midwest distributor — a stark reminder that ocean freight 6 from Vietnam is not a fixed number.
Account for Vietnam-to-US logistics lead times by mapping every segment — production, inland transport, port handling, ocean transit, customs clearance, and last-mile delivery — then adding variability buffers for each segment based on recent performance data and seasonal risk windows.
Breaking Down the Lead Time Segments
Many buyers treat "lead time" as a single number their supplier quotes. In reality, it is a chain of segments, each with its own variability. Here is a typical breakdown for stamping parts shipped from Vietnam to the U.S. West Coast:
| Segment | Typical Duration | Variability Range |
|---|---|---|
| Production (progressive die stamping + finishing) | 15–25 days | ± 5 days |
| Inland transport to HCMC / Hai Phong port | 1–3 days | ± 1 day |
| Port handling and vessel loading | 2–5 days | ± 3 days (congestion-dependent) |
| Ocean transit to LA / Long Beach | 18–22 days | ± 4 days |
| US customs clearance | 2–5 days | ± 3 days |
| Last-mile trucking to warehouse | 2–7 days | ± 2 days |
| Total | 40–67 days | Spread of 27 days |
That 27-day spread is why a single-point lead time estimate is dangerous for inventory planning.
Seasonal and Geopolitical Risks
Vietnam's Lunar New Year (Tet) typically shuts factories for 10–14 days in late January or early February. Port congestion peaks before and after this holiday. Our Vietnam office monitors workforce availability and books vessel space 6–8 weeks ahead to protect clients from the worst delays. Similarly, evolving trade agreements like RCEP and EVFTA can change customs processing times and tariff structures, which in turn affect logistics challenges and total landed cost.
Practical Planning Tips
- Use the worst-case total lead time (67 days in the table above) as your maximum lead time input in the Average-Max safety stock formula.
- Track actual arrival dates shipment by shipment. After five or six shipments, calculate the standard deviation of total lead time and feed it into the statistical method.
- Stagger orders. Rather than one large PO every quarter, place smaller POs monthly. This overlapping schedule means a delay on one shipment does not leave you exposed for the full reorder cycle.
- Leverage real-time tracking tools. Container-tracking platforms give you early warning of vessel delays, allowing you to pull forward the next PO or air-ship a partial quantity.
Supply chain resilience 7 is not about eliminating delays — it is about seeing them early and having a plan. Our logistics team sends weekly status updates to clients for exactly this reason. When a vessel is re-routed or a port backs up, the buyer knows the same day we do and can adjust their draw-down schedule.
Air Freight as an Emergency Lever
For high-value or time-critical stamping parts, air freight from Hanoi or HCMC to a U.S. hub takes only 3–5 days. The cost is roughly 5–8 times higher per kilogram than ocean freight, so it only makes sense for small quantities that prevent a line-down situation. We maintain a standing relationship with air cargo partners so that, if a critical shipment is at risk, we can split it: ocean for the bulk, air for the urgent portion.
What factors should I consider when evaluating supplier reliability for my safety stock strategy?
A few years ago, one of our clients switched primary suppliers in Vietnam after three consecutive late deliveries on a sheet metal bracket program. The transition took four months and temporarily doubled their safety stock requirement — proof that supplier reliability 8 is not just a scorecard item but a direct input to your inventory math.
Evaluate supplier reliability by tracking on-time delivery rate, first-pass yield, communication responsiveness, capacity utilization, financial stability, and raw material availability — then weight these factors based on your part criticality and acceptable risk level to set appropriate safety stock buffers.
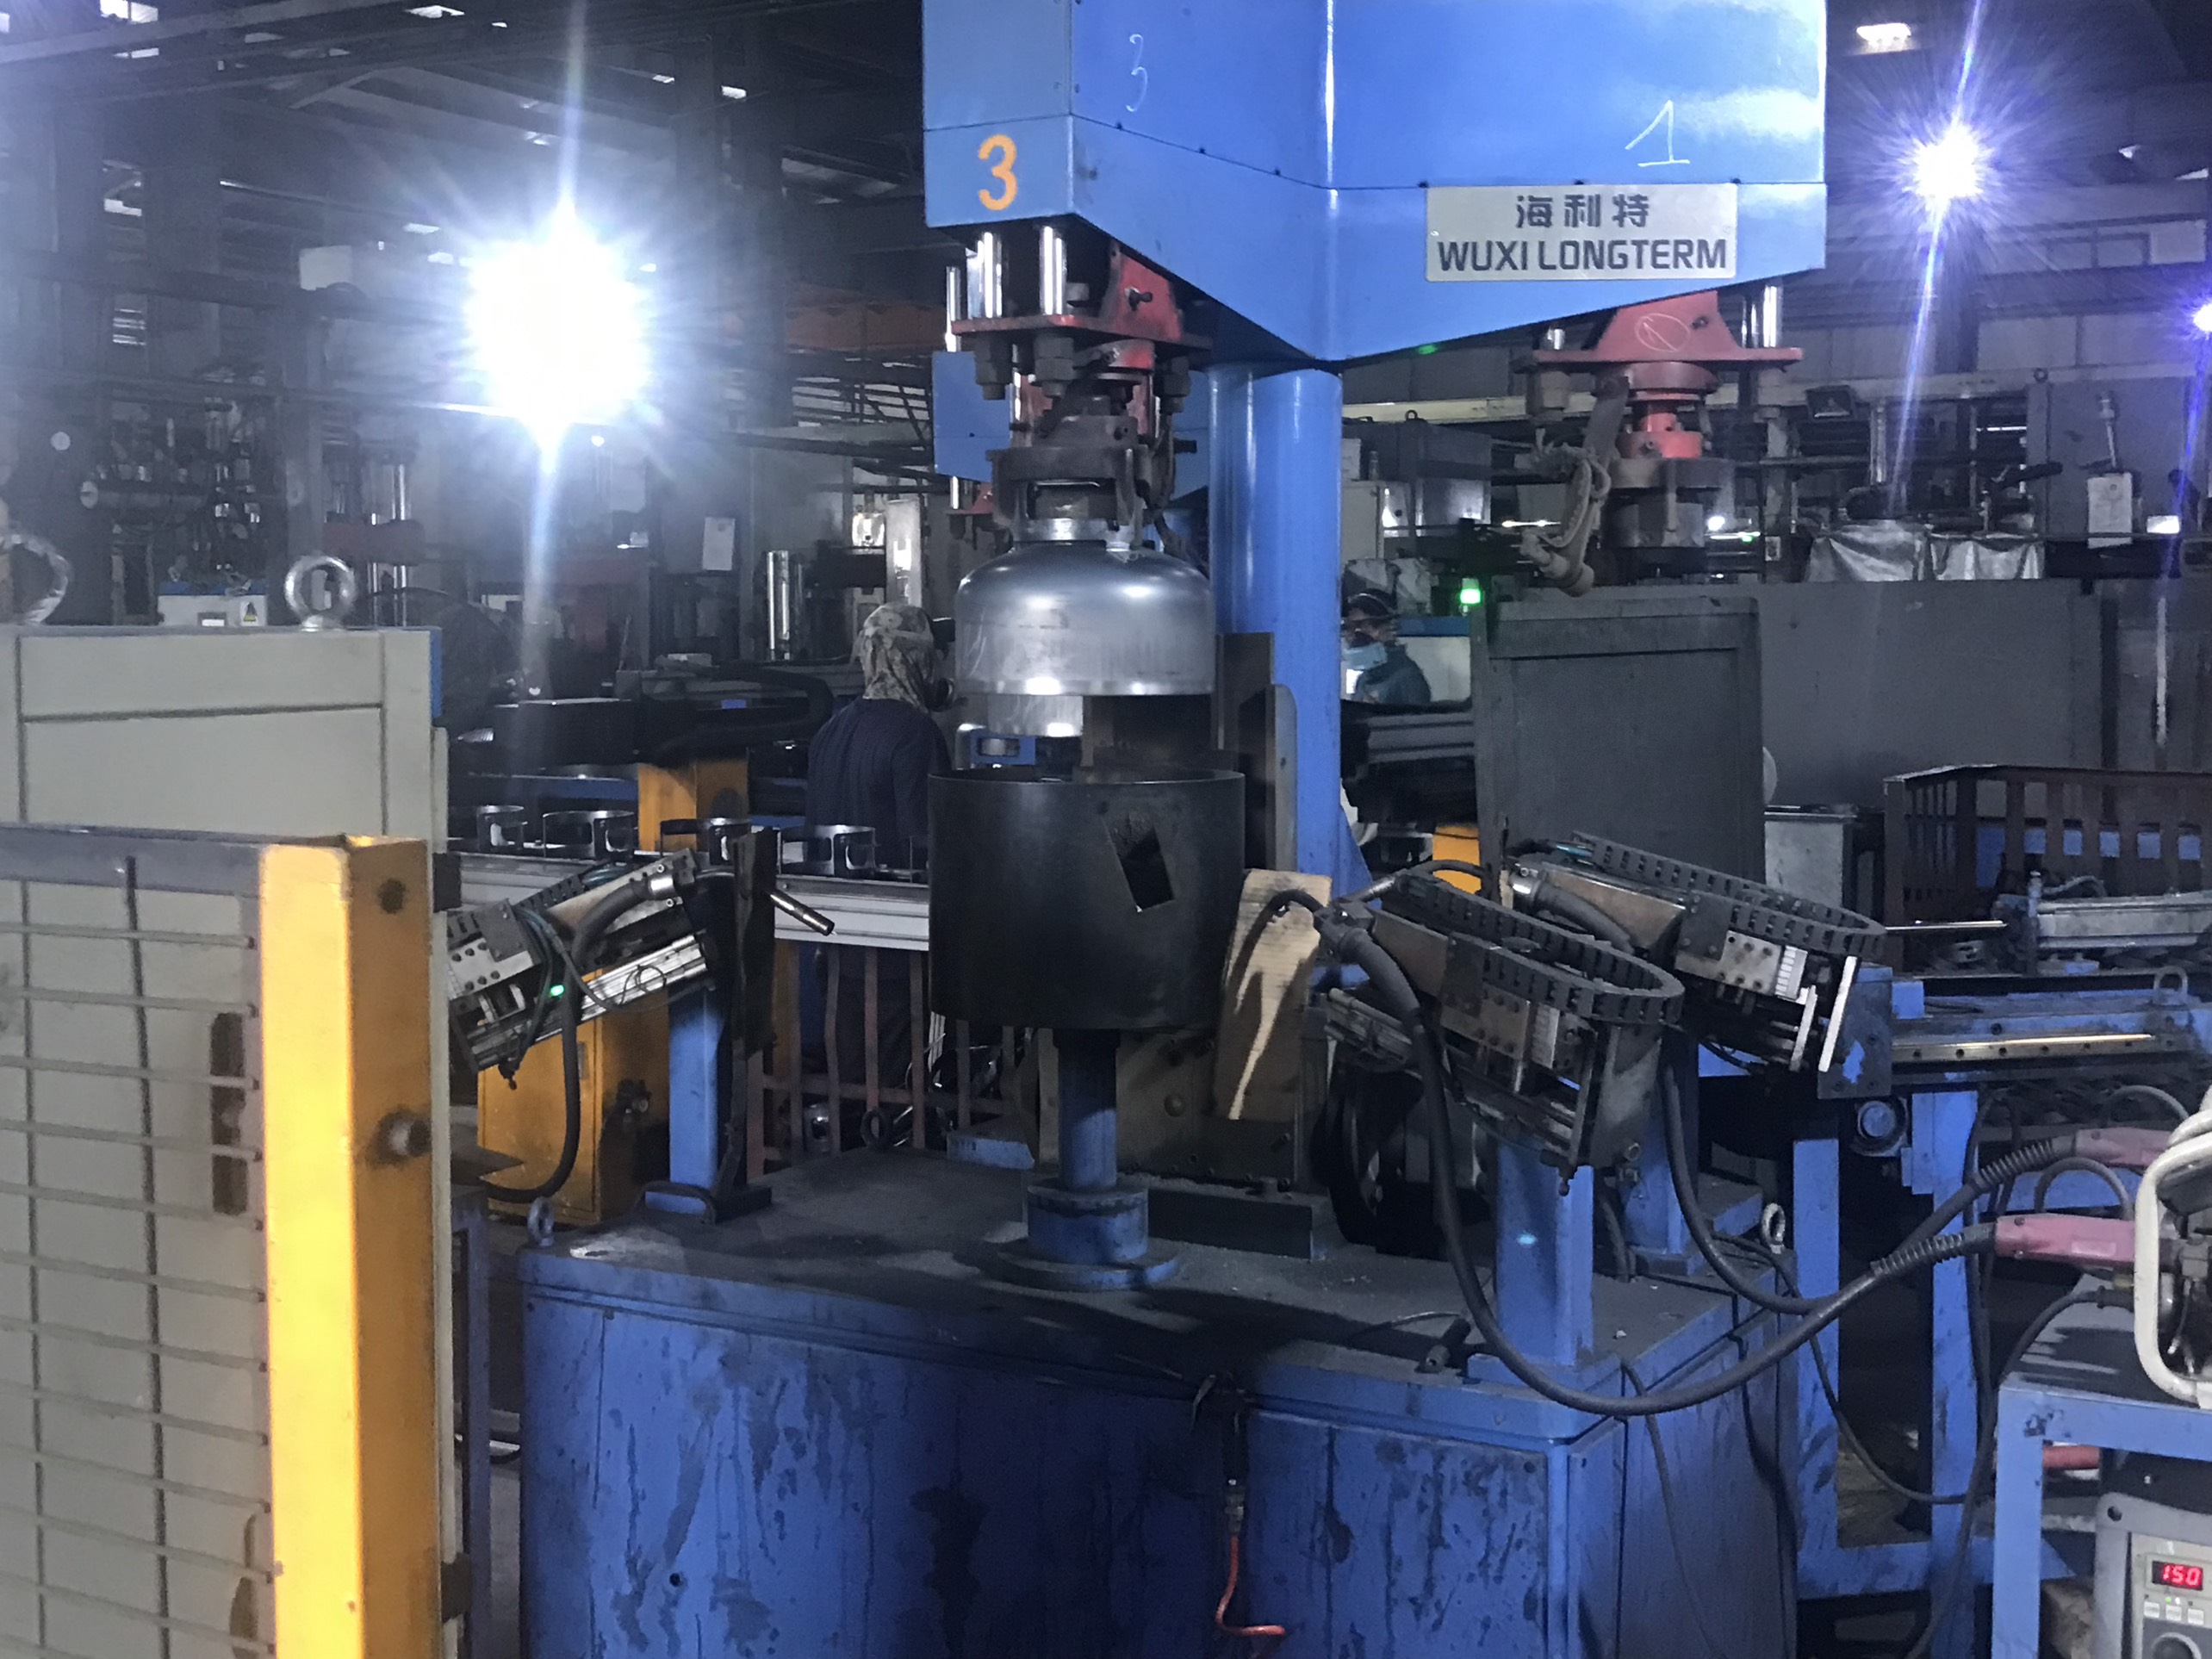
Building a Supplier Scorecard
Not every metric matters equally. Below is the scorecard template our sourcing team uses when auditing stamping suppliers across the Vietnam manufacturing hub:
| Factor | Weight | Measurement | Impact on Safety Stock |
|---|---|---|---|
| On-time delivery rate | 25 % | % of POs delivered within agreed window | Low OTD → higher buffer needed |
| First-pass yield 9 (quality) | 20 % | % of parts passing inspection without rework | Low yield → add rework time to lead time |
| Communication responsiveness | 15 % | Avg hours to reply to urgent queries | Slow response delays problem resolution |
| Capacity utilization | 15 % | % of press capacity committed | Near-full capacity → less flexibility for rush orders |
| Raw material sourcing stability | 15 % | Number of qualified steel / alloy sub-suppliers | Single-source material → higher variability |
| Financial health | 10 % | Credit rating or payment behavior with sub-suppliers | Weak finances → risk of sudden shutdown |
How Supplier Scores Translate to Safety Stock
When a supplier scores above 90 % on our composite index, we recommend a baseline safety stock level (e.g., 5 safety days). For every 10-point drop, we add 2–3 extra safety days. This is a rough heuristic, not a precise formula, but it keeps the conversation grounded in data rather than gut feel.
The China+1 Dimension
Many U.S. buyers are actively pursuing risk management strategies that diversify away from a single-country supply base. Vietnam is a leading beneficiary of this China+1 trend. However, newer Vietnamese stamping shops may lack the process maturity of established Chinese suppliers. Our role is to bridge that gap through PPAP documentation, regular on-site audits, and process-control coaching. The payoff is a supplier whose reliability improves over time, which in turn lets you reduce safety stock instead of constantly increasing it.
When to Dual-Source
If a single stamping part represents more than 15 % of your total procurement spend or feeds a production line that cannot tolerate any downtime, consider qualifying a second supplier. Dual-sourcing adds qualification cost but dramatically reduces the tail risk of a complete supply disruption. We help clients qualify backup suppliers in both Vietnam and other Southeast Asian markets so they always have a secondary option.
How does the risk of quality issues or rework impact my safety stock requirements for stamping projects?
The lesson that stung the most in my early career was watching 4,000 stamped clips get rejected at incoming inspection because a progressive die had worn beyond tolerance and nobody caught it during in-process checks. The rework cycle added three weeks to the program — three weeks our client's warehouse was empty.
Quality issues and rework extend effective lead times and reduce usable yield, so your safety stock must account for both the probability of a rejection event and the time required to replace or rework non-conforming parts — typically adding 10–30 % to baseline buffer levels depending on process maturity.
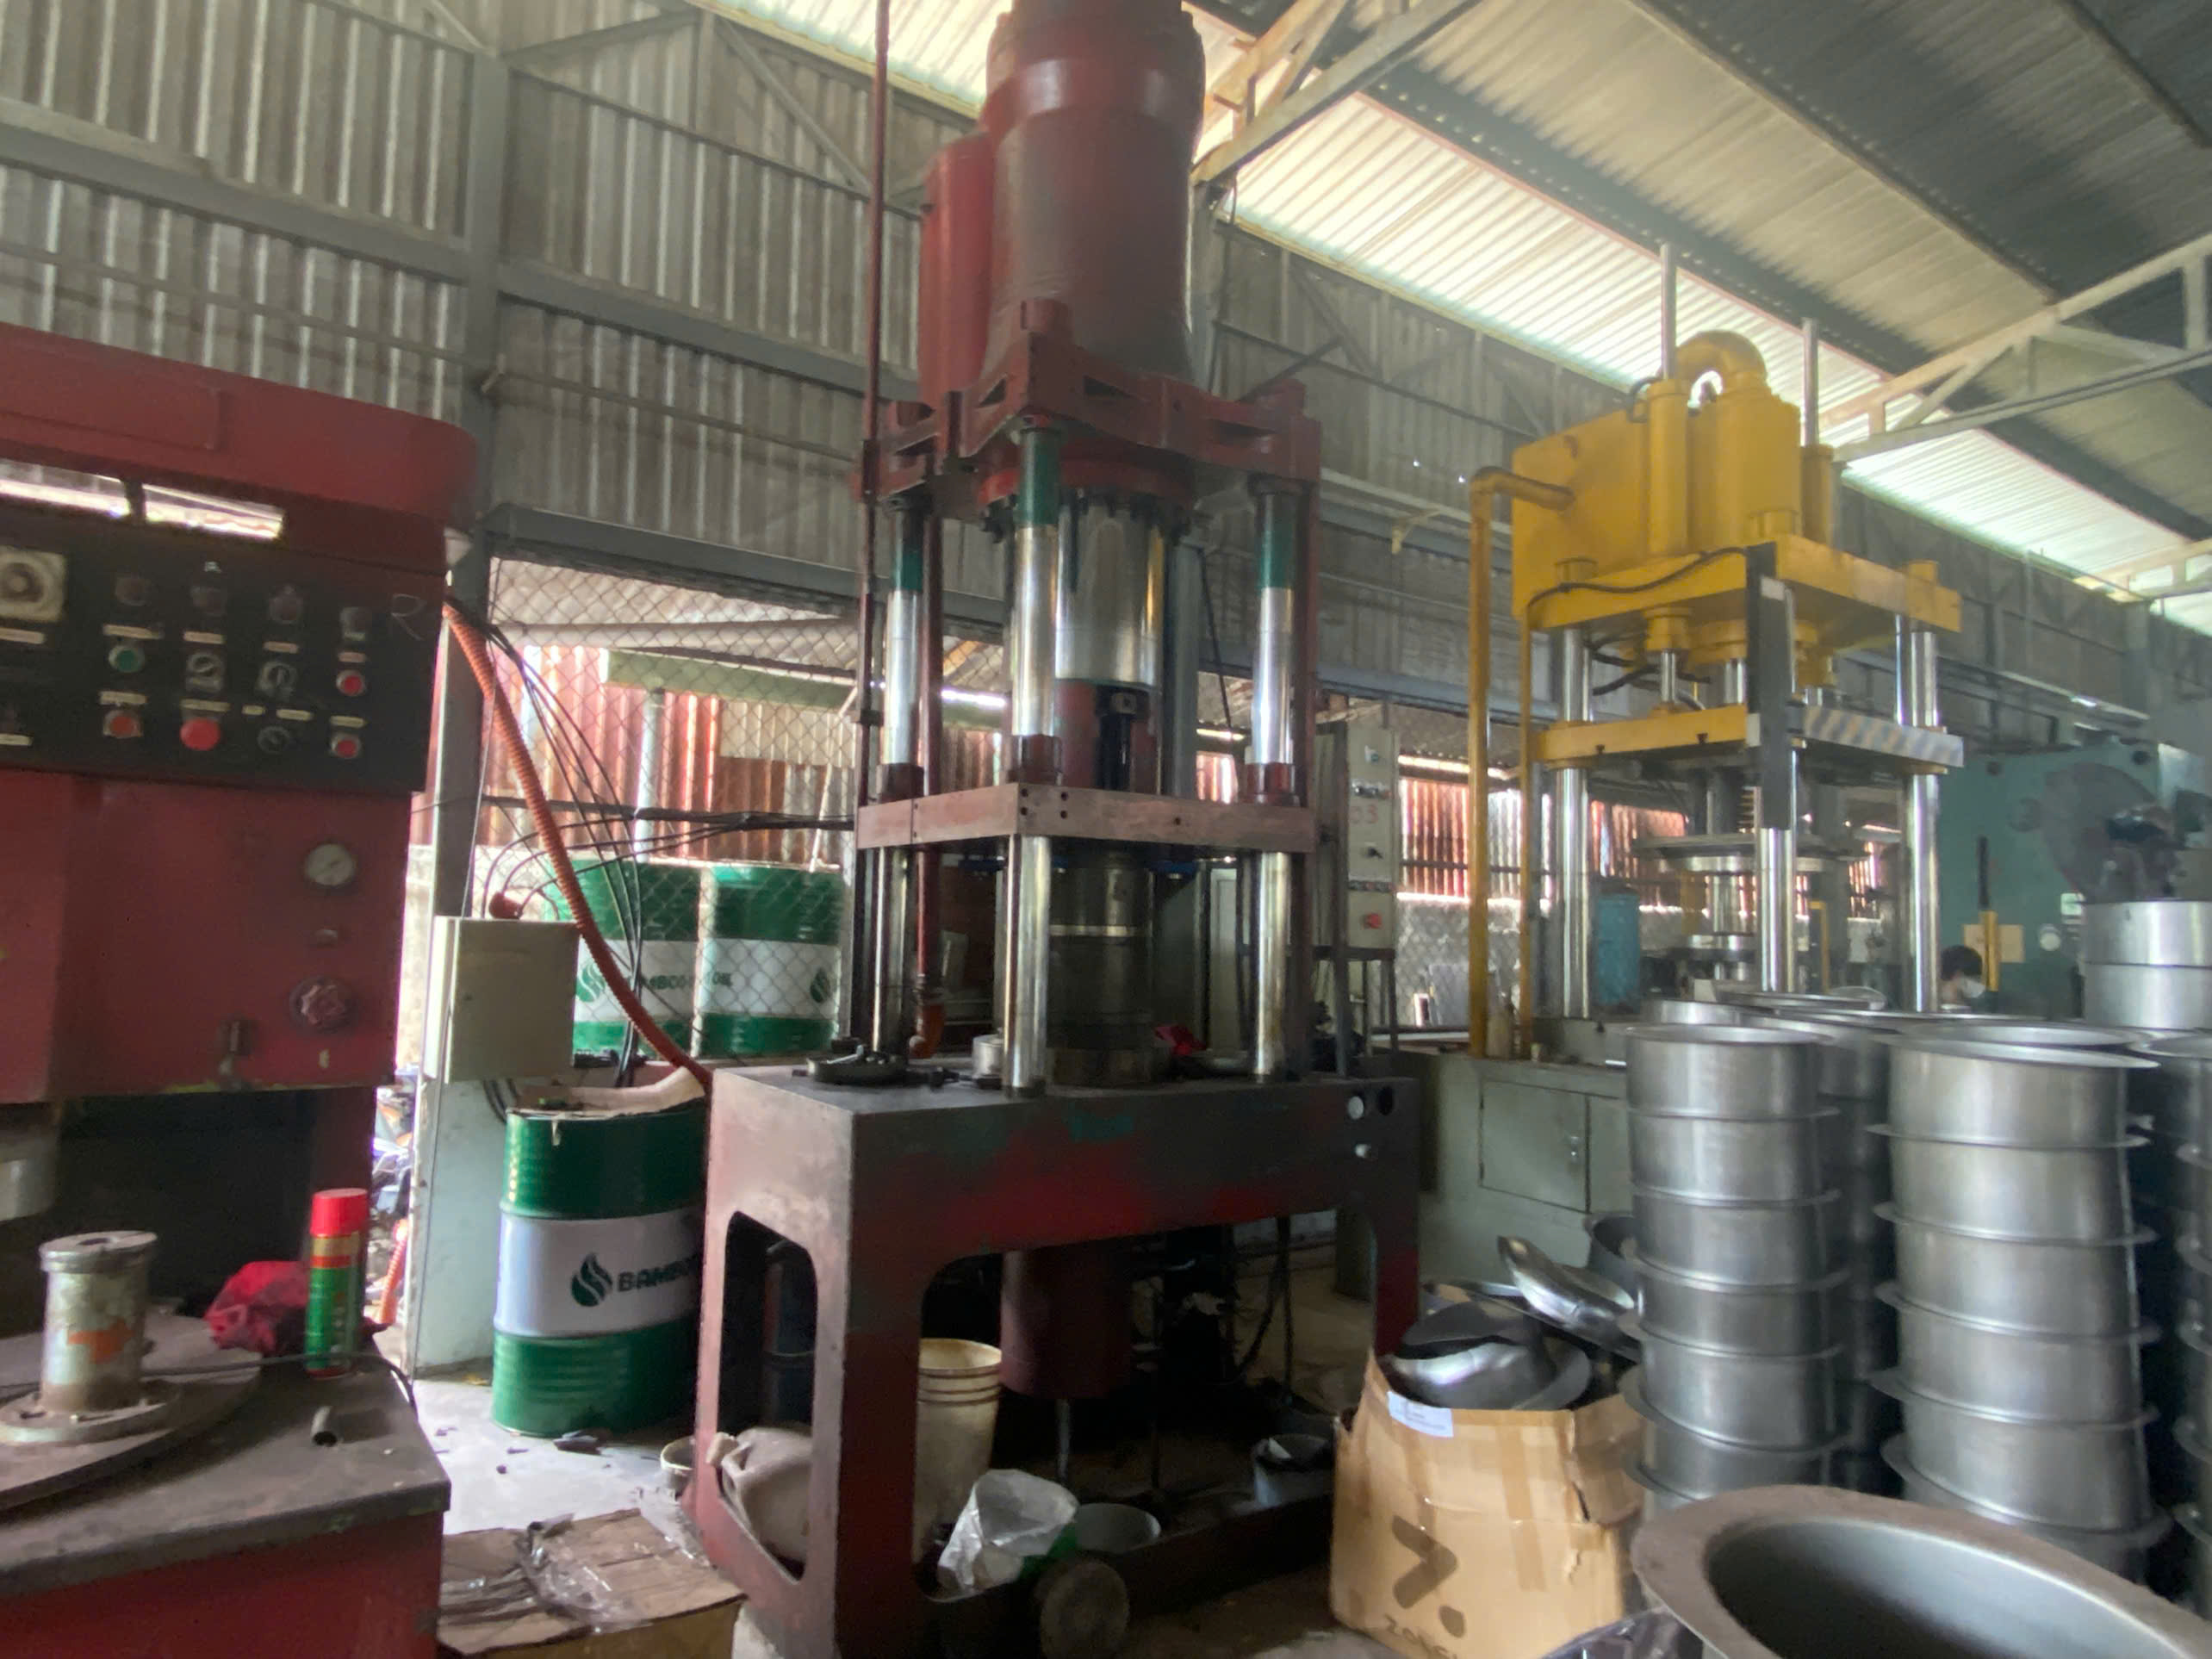
Quantifying the Quality Risk
Quality problems affect safety stock through two channels:
- Yield loss. If 5 % of parts are typically scrapped at final inspection, you need to order 5 % more than net demand — or hold 5 % extra safety stock to cover the gap until replacement parts arrive.
- Rework time. If rework or re-production takes 10 days, that time adds directly to lead time variability. Plug it into your formula as an extension of maximum lead time.
A Simple Adjusted Formula
Take the Average-Max result and apply a quality adjustment:
Adjusted Safety Stock = Base Safety Stock ÷ (1 − Scrap Rate)
If base safety stock is 800 units and your historical scrap rate is 5 %:
Adjusted Safety Stock = 800 ÷ 0.95 = 842 units
That extra 42 units covers the expected yield loss. If a full lot rejection is possible (rare but catastrophic), add a separate contingency buffer sized to one full order quantity.
Prevention Reduces the Buffer
The most effective way to lower safety stock tied to quality risk is to prevent the quality issue in the first place. Our Vietnam office runs a structured quality control process on every stamping program:
- First Article Inspection (FAI) before mass production begins.
- In-process SPC (Statistical Process Control) on critical dimensions during the run.
- Final inspection per the client's AQL or custom inspection plan.
- PPAP submission with dimensional reports, material certs, and capability studies.
Each of these steps catches problems earlier in the cycle, before defective parts are packed and shipped across the Pacific. When the quality system is mature and first-pass yield consistently exceeds 98 %, the quality-driven component of safety stock shrinks to near zero.
ABC Analysis Meets Quality Risk
Not all stamping parts carry the same quality risk. A simple flat washer stamped from mild steel has very different failure modes than a complex multi-bend bracket with tight tolerances. Use ABC analysis 10 to segment your parts:
| Category | Typical Parts | Quality Risk Level | Safety Stock Approach |
|---|---|---|---|
| A items (80 % of value) | Complex brackets, progressive die assemblies | High | Statistical method + quality adjustment + frequent review |
| B items (15 % of value) | Mid-complexity clips, spacers | Medium | Average-Max method + moderate buffer |
| C items (5 % of value) | Simple washers, shims | Low | Safety-days method + conservative fixed buffer |
C items are cheap individually, but a stock-out can still halt a production line. Set a conservative buffer for them — the carrying cost is minimal and the downside protection is significant.
Phased Implementation
When rolling out a new safety stock strategy that incorporates quality risk, avoid changing everything at once. Start with your top 5–10 A items. Monitor stock-out events, forecast accuracy, and lead time variability for two or three order cycles. Adjust the formulas based on real outcomes, then expand to B and C items. This phased approach, which our team has guided multiple clients through, reduces the risk of over-correcting and tying up too much working capital.
Continuous Improvement Loop
Safety stock is not a set-and-forget number. We recommend a quarterly review checklist:
- Number of stock-outs since last review
- Actual vs. forecasted demand accuracy
- Actual vs. quoted lead times
- First-pass yield trend at the supplier
- Any changes in raw material availability or pricing
- Service level achievement against target
Each data point feeds back into the formula inputs. Over time, as supplier reliability improves and your demand forecasting gets sharper, safety stock levels should trend downward — freeing up cash and warehouse space without increasing risk. For a deeper look at how to negotiate safety stock arrangements for demand fluctuations, consider working those terms directly into your supplier agreements.
Conclusion
Planning safety stock for Vietnam stamping parts requires matching the right formula to your data, mapping every logistics segment, scoring supplier reliability, and adjusting for quality risk — then reviewing quarterly and refining continuously.
Frequently Asked Questions
Which Method Wins?
There is no single winner. In our experience coordinating shipments from Ho Chi Minh City to ports in Los Angeles and Houston, we often start with the safety-days method during quoting, switch to Average-Max once the program is live, and graduate to the statistical method 4 after three to four shipments provide enough data for demand forecasting accuracy.
How do I calculate the ideal safety stock level for my custom stamping parts from Vietnam?
When we onboard a new stamping program for a U.S. client, the very first question our planning team asks is: "How much variability should we expect?" The answer drives every number that follows.
How can I account for Vietnam-to-US logistics lead times in my inventory planning?
Last quarter, a typhoon warning in the South China Sea 5 added nine days to a shipment of stamping brackets our team was tracking for a Midwest distributor — a stark reminder that ocean freight 6 from Vietnam is not a fixed number.
Footnotes
1. Explains the manufacturing process. ↩︎
2. Describes a specific formula for safety stock calculation. ↩︎
3. Provides methods for calculating safety stock. ↩︎
4. Explains a more precise approach to safety stock. ↩︎
5. Wikipedia provides a comprehensive and accessible overview of the South China Sea, suitable for a general reference. ↩︎
6. Project44 provides a clear definition and explanation of ‘ocean freight in supply chain management’. ↩︎
7. IBM is an authoritative source, and this article provides a good definition and explanation of supply chain resilience. ↩︎
8. Highlights the importance of consistent supplier performance. ↩︎
9. Explains a key metric for manufacturing quality. ↩︎
10. Describes a method for categorizing inventory items. ↩︎