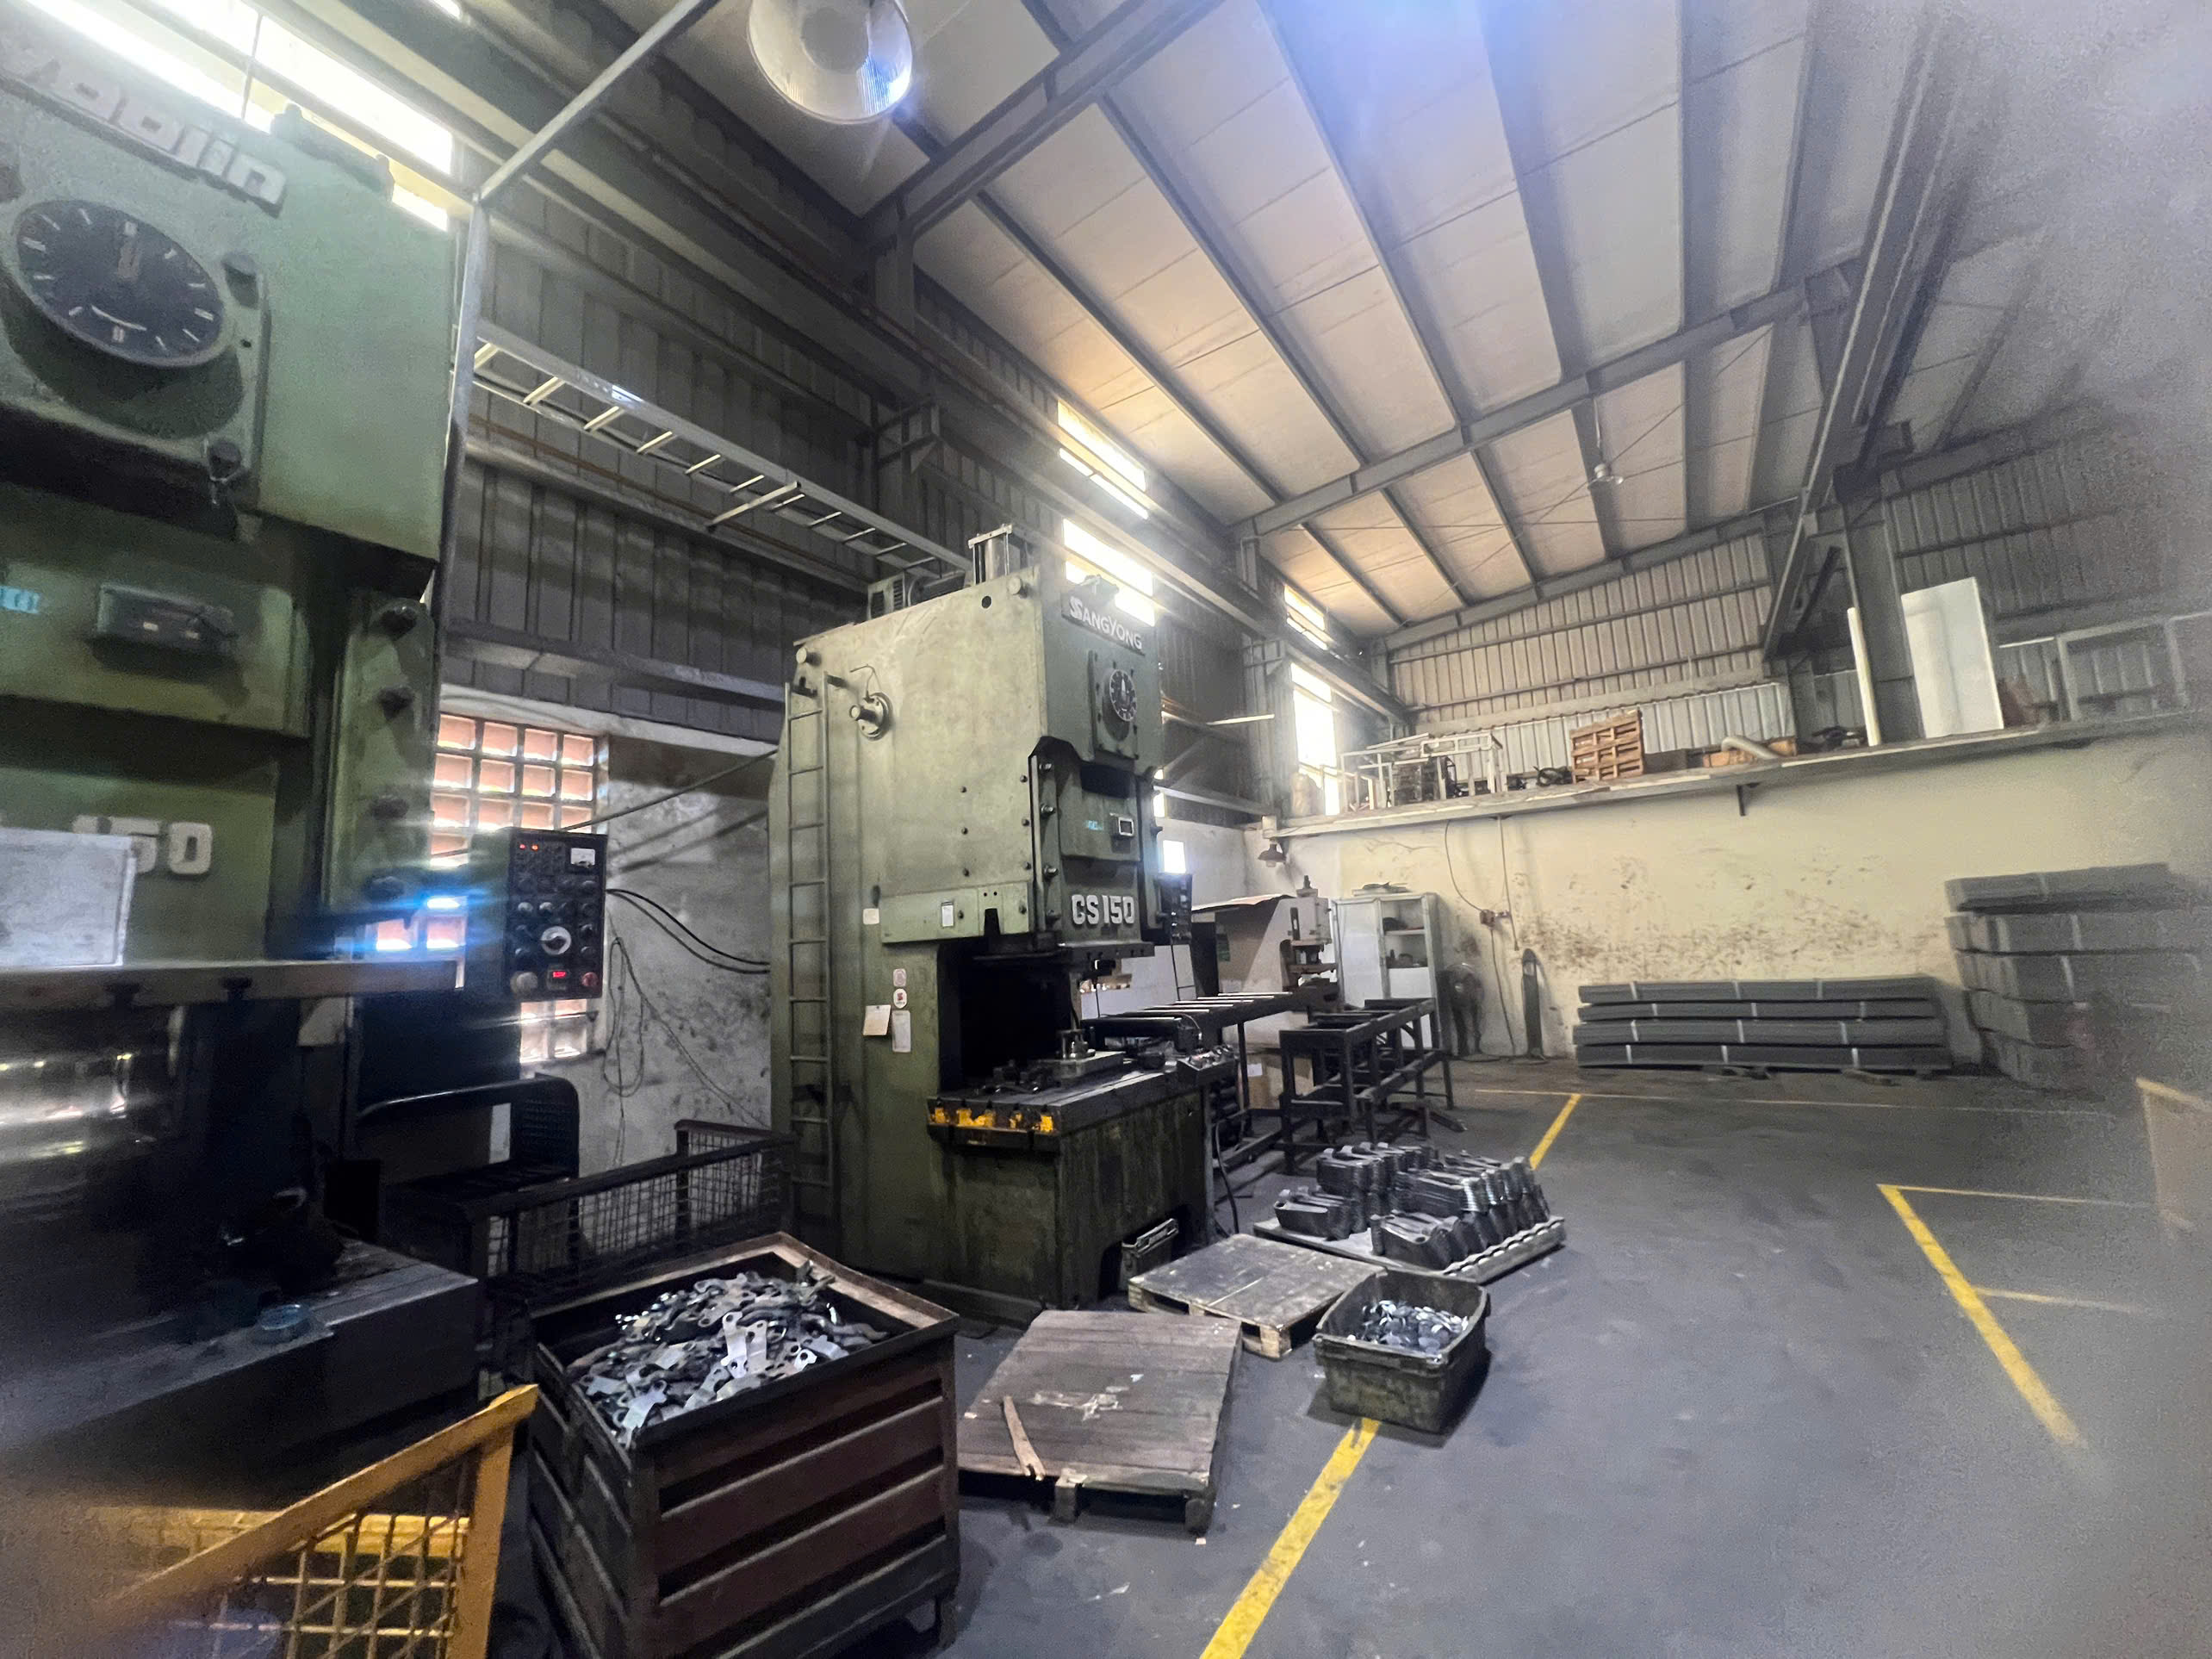
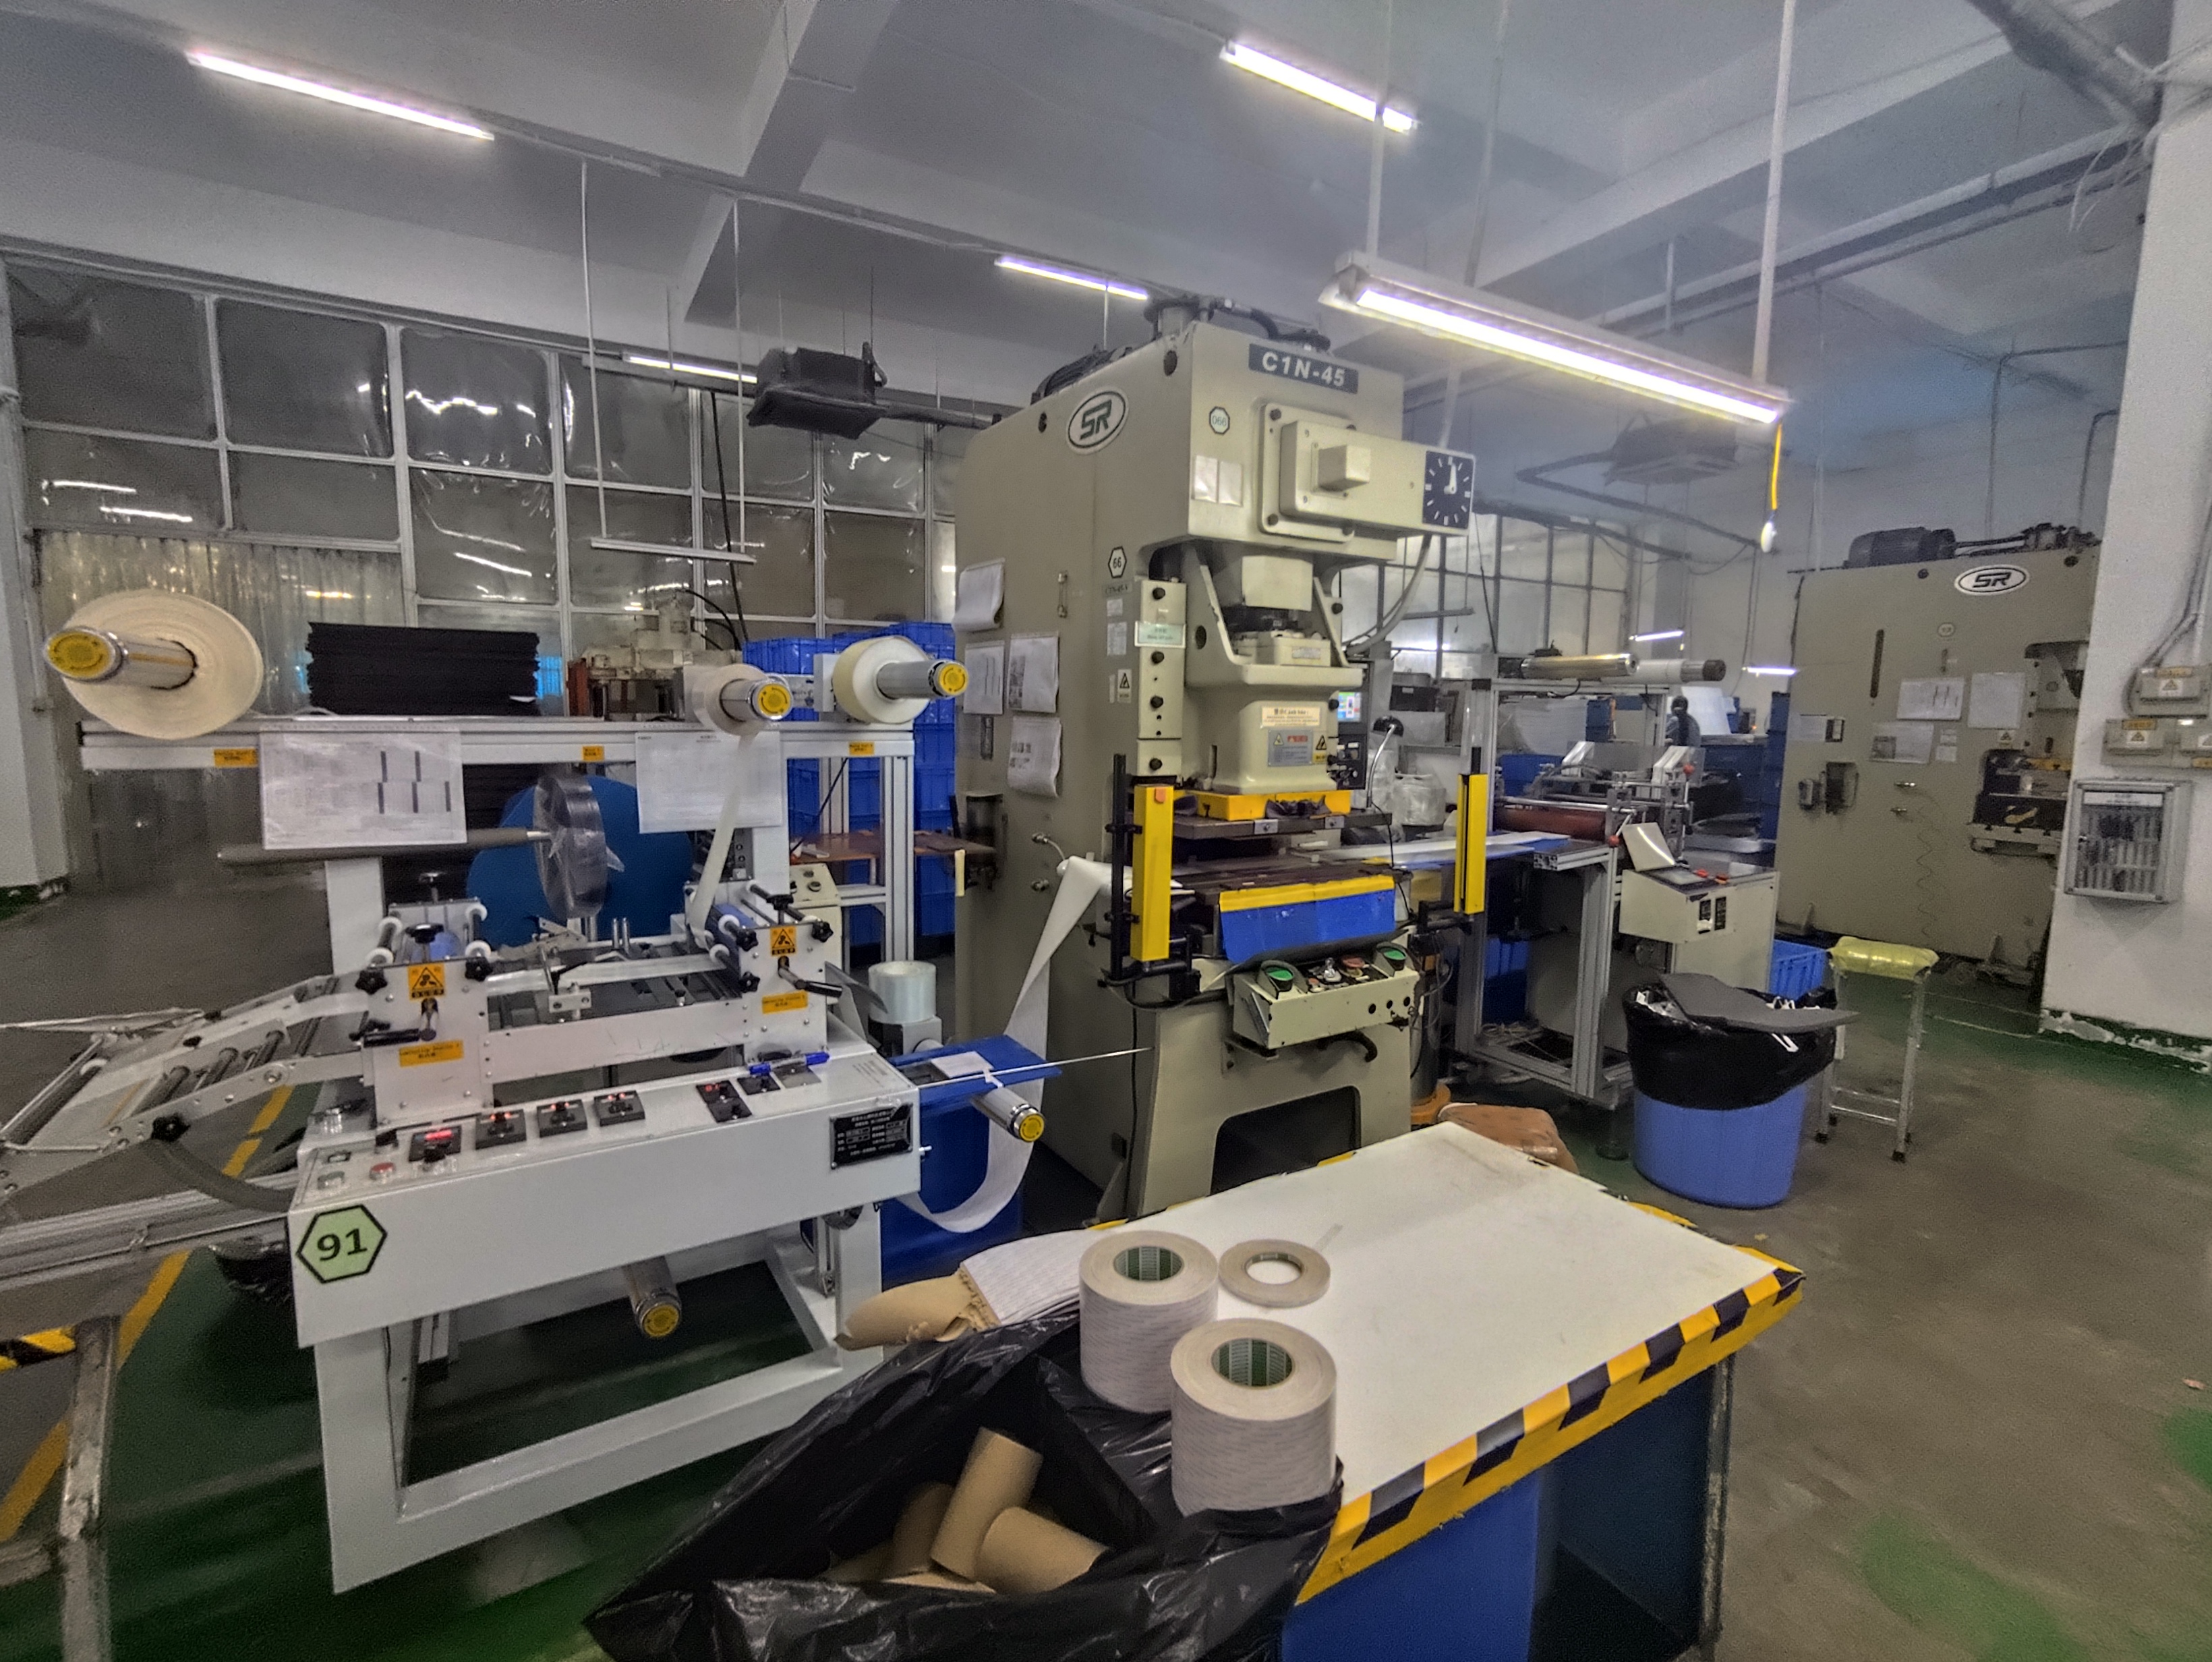
I learned a hard lesson about capacity reports when a stamping supplier promised volumes they could never deliver, and our client’s production line stopped cold.
To request annual capacity and equipment utilization reports from stamping parts suppliers, send a standardized Capacity Verification Form covering press tonnage capacity, shift schedules, Overall Equipment Effectiveness data, die availability, and corrective action plans—then validate the data through facility audits, historical production records, and automated system exports.
Most buyers simply ask “can you handle this volume?” That question is too vague. Smart buyers ask for documented proof. In this guide, I will walk you through exactly what to request, which metrics matter, how to verify supplier claims, and how often to repeat the process. These steps come from years of managing stamping supplier relationships across Vietnam, China, and other Asian manufacturing hubs for our U.S. clients World Trade Organization 1.
What Should I Include in My Capacity Reporting Request to Stamping Parts Suppliers?
A few months ago, one of our purchasing managers flagged a gap in a Vietnamese stamping supplier's data—they listed total press hours but omitted changeover time, which hid a 30% utilization loss nobody expected.
Your capacity reporting request should include a Capacity Verification Form with fields for vendor capacity planning volume, standard annual capacity per machine, shift schedules, die availability status, material lead times, Overall Equipment Effectiveness breakdowns, and corrective action requirements when capacity falls short of demand.
Start With a Standardized Template
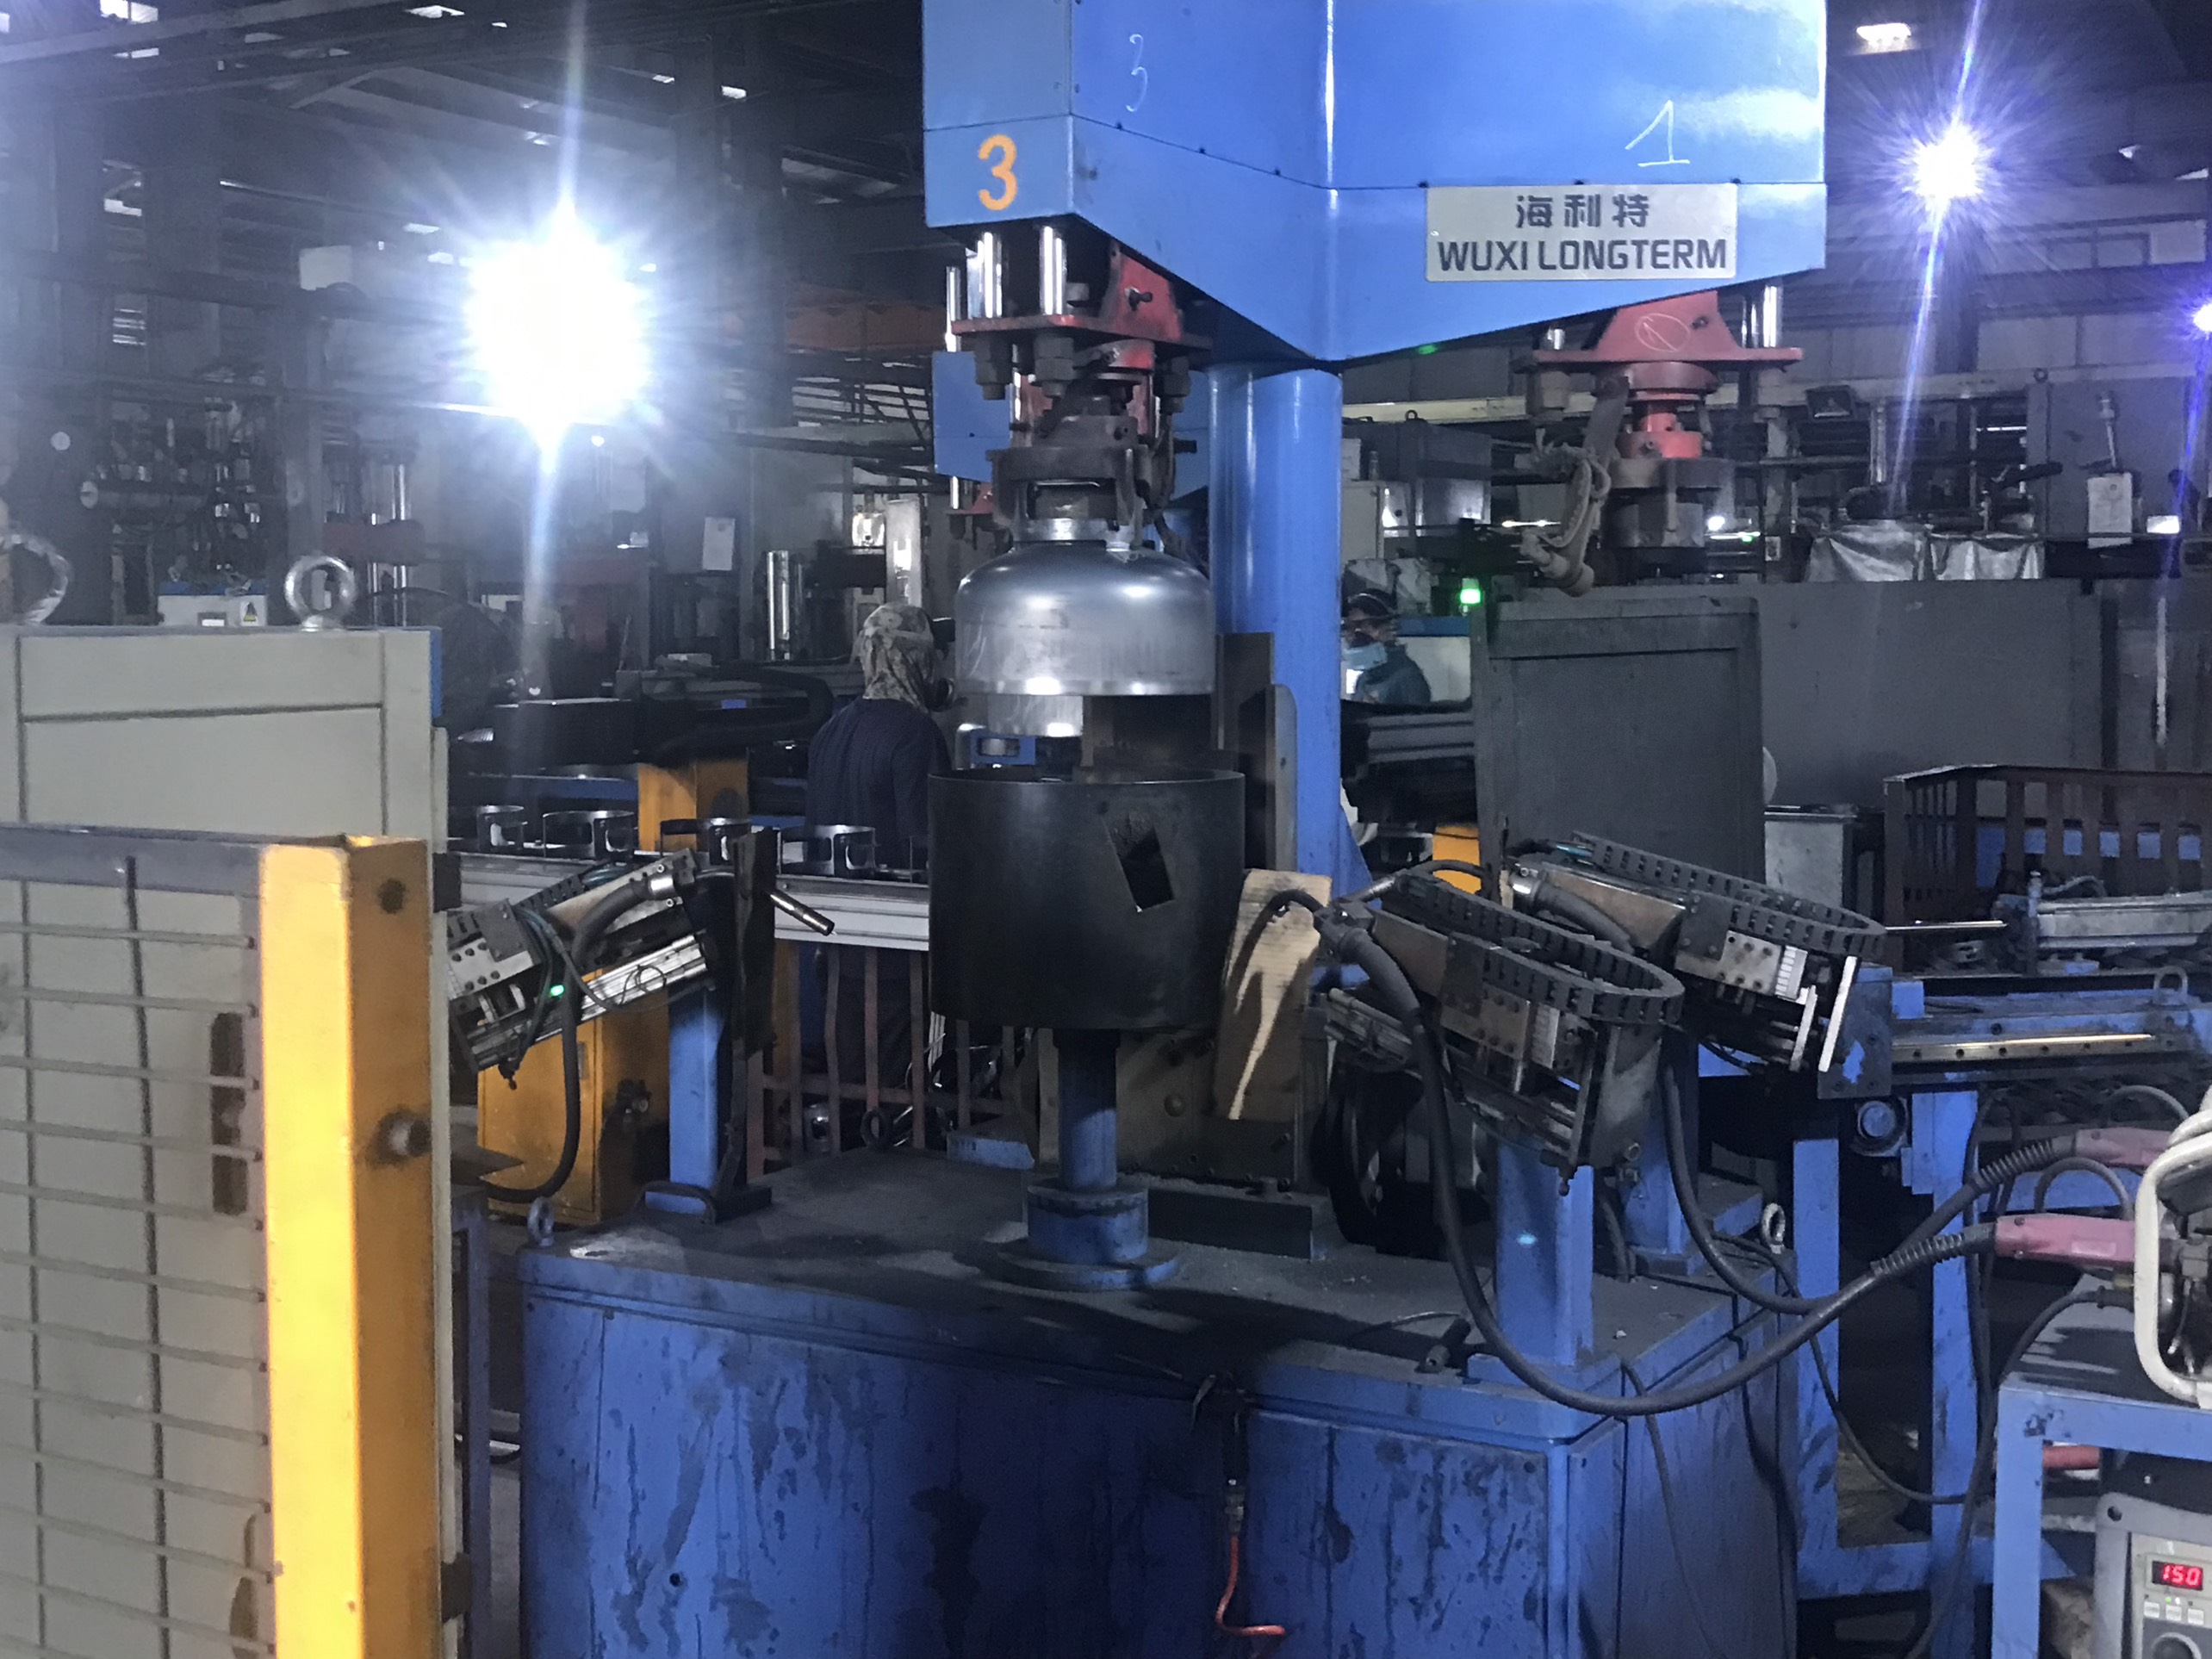
Do not send a blank email asking for "capacity information." Build a structured form. Industry-standard templates, such as those used by large OEMs and EMS companies, require specific data fields. Here is a baseline template I recommend:
| Field | What to Request | Why It Matters |
|---|---|---|
| Supplier Name & Location | Legal entity, factory address | Confirms which facility handles your parts |
| Part Number(s) | Your specific part numbers assigned to this supplier | Links capacity data to your exact projects |
| Vendor Capacity Planning Volume (CPV) | Annual volume the supplier has committed to produce for you | Sets the contractual baseline |
| Standard Annual Capacity | Maximum output for relevant tooling and machines | Reveals if CPV exceeds what they can physically do |
| Shift Schedule | Number of shifts, hours per shift, days per week | Determines available production hours |
| Die Availability | Number of active dies, backup dies, die maintenance schedule | Dies are a hidden bottleneck in stamping |
| Material Lead Times | Raw material procurement cycle in weeks | Material delays are a top cause of lead time variability |
| Corrective Action Plan | Steps supplier will take if capacity < CPV | Forces accountability before problems arise |
Define Three Capacity Scenarios
When we build RFQs for stamping projects, we now ask every supplier to quote three capacity levels. This approach supports better production capacity planning and removes guesswork.
- Normal capacity: Output at standard shift schedules, no overtime.
- Upside capacity: Output with overtime, weekend shifts, or temporary labor added.
- Emergency capacity: Maximum theoretical output if all constraints are removed for a short burst.
By capturing all three, you can plan for demand surges. You also learn how much supplier flexibility for order volume fluctuations the supplier truly has. If their normal and emergency numbers are nearly identical, that signals a rigid operation with no buffer.
Include Operational Detail Fields
Beyond the core form, request data on employee headcount per shift, quality metrics like first-pass yield quality control process 2, and lead-time performance over the last quarter. These details help you build a complete picture. A supplier with 10 presses but only 5 trained operators is not running at full capacity—no matter what the form says.
I always tell our team: the form is the skeleton. The operational details are the muscle. Without both, you cannot judge whether a stamping supplier can truly meet your order volumes.
How Do I Verify the Equipment Utilization Data My Stamping Supplier Provides?
During a supplier audit in Vietnam last year, we compared a stamping factory's self-reported 85% utilization rate against their electrical consumption records. The actual figure was closer to 62%—a gap that would have caused serious delivery problems for our client.
Verify equipment utilization data by cross-referencing supplier reports against 12 months of historical production records, conducting in-person or virtual facility audits, checking automated MES or machine sensor data against manual logs, and correlating kilowatt-hour consumption per stroke with reported press uptime.
Why Self-Reported Data Is Not Enough
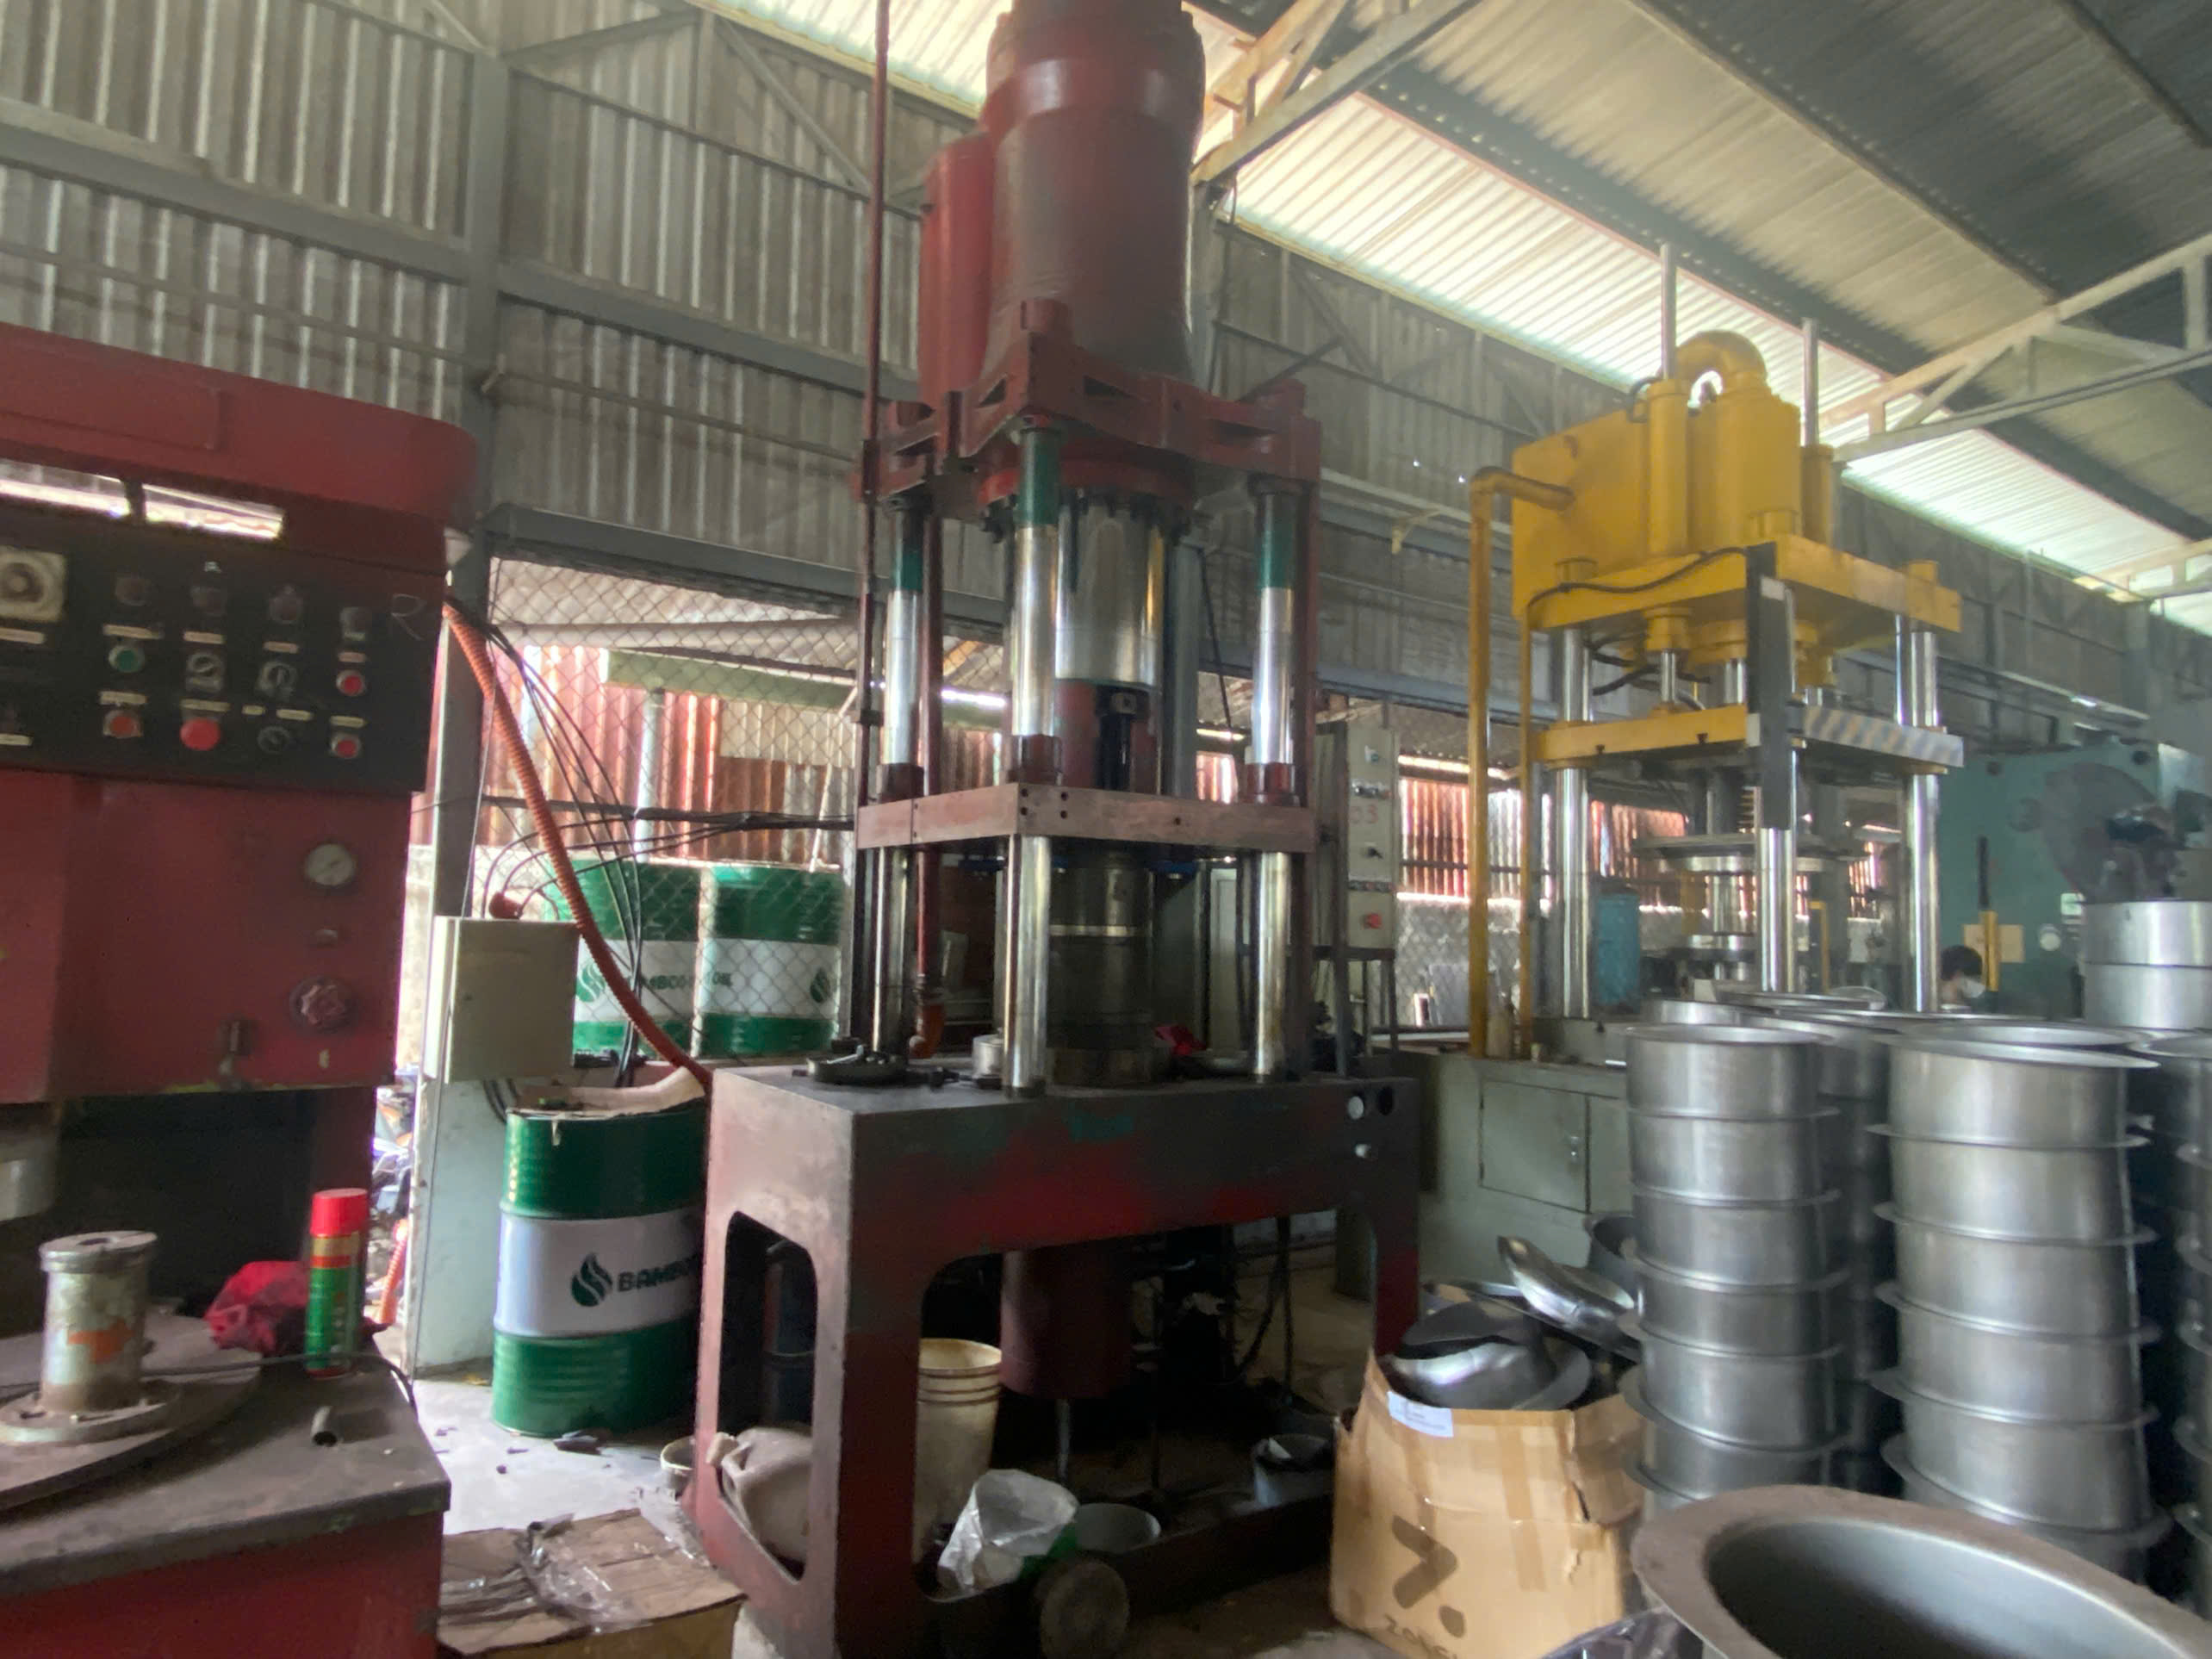
Suppliers have a natural incentive to present favorable numbers. This is not about dishonesty—it is about perspective. A factory manager may report "available hours" without subtracting unplanned downtime, changeover time, or quality-related stoppages. The result is inflated utilization that looks great on paper but crumbles under real demand.
Supply chain transparency starts with independent verification. supply chain management 3 Here are the methods I use, ranked by reliability.
Verification Methods Compared
| Method | Reliability | Cost | Best For |
|---|---|---|---|
| Automated MES / Sensor Data Export | High | Low (if supplier has the system) | Real-time utilization, machine downtime tracking |
| In-Person Facility Audit | High | High (travel, time) | Equipment condition, workflow, labor assessment |
| Virtual Facility Tour | Medium | Low | Initial screening, remote verification |
| 12-Month Historical Production Reports | Medium-High | Low | Trend analysis, seasonal pattern detection |
| Energy Consumption Correlation (kWh/stroke) | High | Medium | Independent cross-check of press uptime |
| Third-Party Audit (e.g., via DEWIN or similar) | High | Medium | Objective validation, IATF 16949 4 compliance checks |
Request Automated Data, Not Spreadsheets
If a supplier has a Manufacturing Execution System 5, ask for API-based or automated data exports. Manual spreadsheets are easy to edit. Automated logs from machine sensors are much harder to manipulate. When our team in China conducts supplier assessments, we ask to see the MES dashboard live during the visit—not a pre-prepared report.
Conduct Historical Data Reviews
Request 12 months of monthly production reports. Focus on the most recent 6 months for the most accurate utilization picture. Look for patterns: Does utilization drop sharply in certain months? That might indicate seasonal material shortages or labor turnover. Does it spike before quarter-end? That could signal last-minute rushes that compromise quality.
Cross-Check With Energy Data
This is a technique I find underused. Every press stroke consumes measurable electrical energy. If a supplier claims 80% utilization on a 200-ton press running at 40 strokes per minute, you can calculate expected kWh consumption and compare it to their electricity bills. Major discrepancies reveal data integrity problems. This method also supports Scope 3 carbon emission reporting if your client requires sustainability compliance.
On-Site Audit Checklist
When we visit a stamping facility, our quality engineers check preventive maintenance 6 logs, inspect die condition, observe changeover procedures, and review scrap bins. The scrap bins tell you more about real quality rates than any report. We also look at the scheduling board—if it is chaotic or outdated, the utilization data is probably unreliable too.
Which Capacity Metrics Help Me Assess a Supplier's Ability to Meet My Order Volumes?
The trade-off we weigh most often is this: a supplier with impressive design capacity on paper versus one with lower numbers but rock-solid delivery history. The metrics you track determine which supplier you actually trust with your orders.
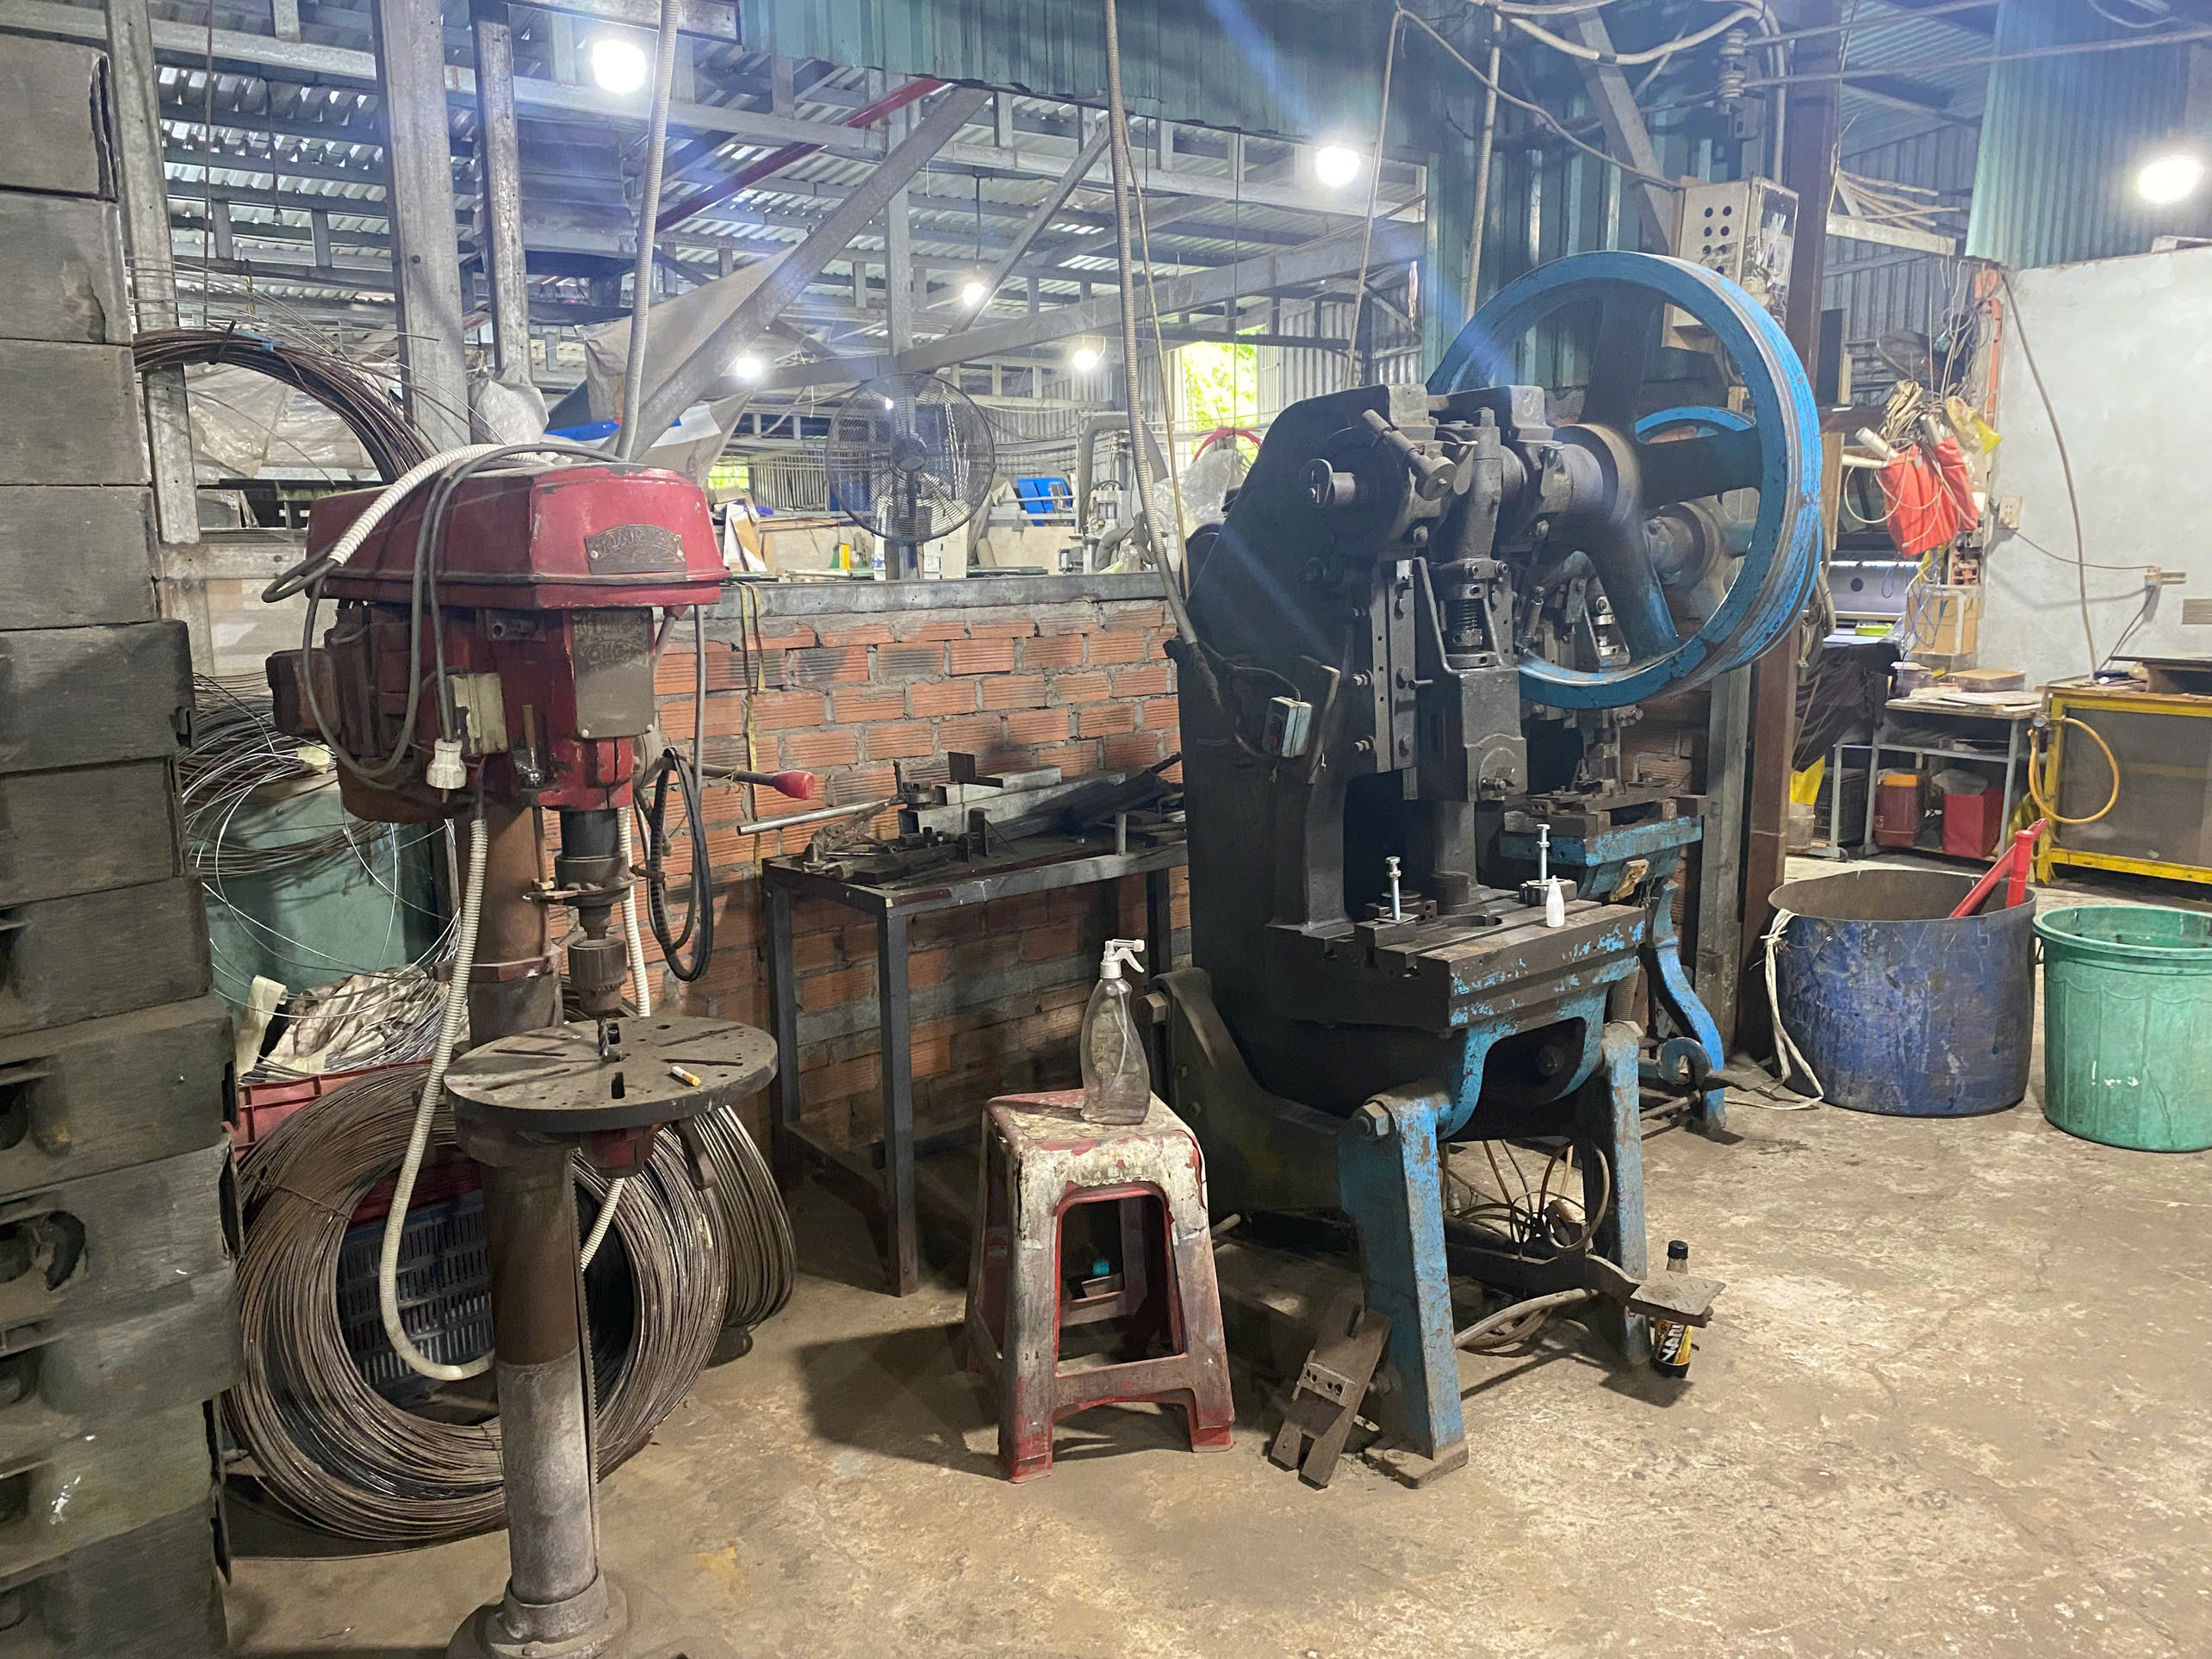
The most critical capacity metrics are Overall Equipment Effectiveness, design versus actual capacity, planned and unplanned downtime ratios, bottleneck analysis results, cycle time per part, die remaining useful life estimates, and multi-tenant allocation maps showing what percentage of machine time is dedicated to your projects versus other customers.
Overall Equipment Effectiveness: The Single Most Important Number
Overall Equipment Effectiveness 7 combines three factors into one score:
- Availability = (Planned Production Time – Downtime) ÷ Planned Production Time
- Performance = (Actual Output × Ideal Cycle Time 8) ÷ Operating Time
- Quality = Good Parts ÷ Total Parts Produced
OEE = Availability × Performance × Quality
World-class stamping operations target OEE above 85%. Most plants run between 60% and 75%. Overall Equipment Effectiveness 9 If a supplier cannot provide OEE data broken down by these three components, they probably are not tracking it—which is a red flag for vendor performance metrics maturity.
Design Capacity vs. Actual Capacity
Design capacity is the theoretical maximum. Actual capacity accounts for real-world losses. Here is how the calculation works:
| Term | Formula | Example |
|---|---|---|
| Design Capacity | Parts per hour × Hours per shift × Shifts per day × Working days per year | 120 parts/hr × 8 hrs × 2 shifts × 250 days = 480,000 parts/year |
| Actual Capacity | Design Capacity × OEE | 480,000 × 0.70 = 336,000 parts/year |
| Capacity Cushion | (Design Capacity – Current Committed Volume) ÷ Design Capacity | (480,000 – 400,000) ÷ 480,000 = 16.7% buffer |
I recommend requiring a capacity cushion of at least 15–20%. This buffer lets the supplier absorb a sudden demand increase without triggering delays. If the cushion is below 10%, you are one equipment breakdown away from a supply disruption.
Bottleneck Analysis
In stamping, the bottleneck is rarely the press itself. It is often the secondary operation—deburring, tapping, plating, or inspection. Ask your supplier to identify their constraint operation for each part family. A 400-ton press running at full speed means nothing if the parts stack up waiting for a manual inspection station.
Our team learned this during a project involving mounting brackets similar to the precision Z-shaped clips we source regularly. The stamping was fast. The zinc plating subcontractor was slow. The overall throughput was limited by the plating queue, not the press. Without bottleneck analysis, that risk was invisible.
Remaining Useful Life for Dies and Presses
Stamping dies wear out. Presses accumulate fatigue. Ask for remaining useful life estimates based on cumulative stroke counts. A die rated for 500,000 strokes that has already run 450,000 is near end-of-life. If the supplier does not have a replacement plan, your parts are at risk.
Multi-Tenant Allocation Map
This is the metric most buyers forget to request. A multi-tenant allocation map shows what percentage of a press or production line is dedicated to each customer. If your supplier's 250-ton press is 60% allocated to an automotive OEM with IATF 16949 compliance requirements, your 15% allocation will be deprioritized during any capacity crunch. Knowing your priority level is essential for supplier risk assessment.
How Often Should I Request Capacity and Utilization Reports From My Stamping Suppliers?
When one of our U.S. clients shifted from annual check-ins to quarterly rolling forecasts with their stamping suppliers, late deliveries dropped by nearly half within two quarters. Frequency matters more than most buyers realize.
Request formal capacity and utilization reports quarterly for active suppliers, with monthly rolling forecast updates during peak seasons or product launches. Conduct a comprehensive annual capacity review that includes facility audits, die condition assessments, and three-year utilization trend analysis to support long-term production capacity planning.
A Tiered Reporting Schedule
Not every supplier needs the same reporting frequency. I recommend a tiered approach based on the supplier's criticality and your volume.
| Supplier Tier | Report Frequency | Scope | Audit Frequency |
|---|---|---|---|
| Tier 1 – High volume, sole source | Monthly rolling forecast + quarterly formal report | Full OEE, allocation map, die RUL, corrective actions | Annual in-person audit |
| Tier 2 – Medium volume, dual source | Quarterly formal report | OEE summary, shift schedule, capacity cushion | Biannual virtual audit |
| Tier 3 – Low volume, multiple alternatives | Semi-annual formal report | Basic capacity confirmation, lead time status | Annual self-assessment questionnaire |
Rolling Forecasts Replace Static Annual Plans
The industry is moving away from static annual capacity commitments. At our company, we now share rolling 6-month forecasts with stamping suppliers every month. Each forecast includes a frozen window (typically 30–60 days) where quantities are locked, followed by flexible projections. This approach gives the supplier time to adjust shift plans, order materials, and schedule die maintenance.
Rolling forecasts also reduce the risk of cycle time optimization failures. When a supplier knows demand is climbing three months out, they can invest in preventive maintenance now rather than scrambling later.
Embed Reporting in Contracts
Capacity reporting should not be optional. Embed it in your purchase agreement or supplier quality agreement. Define what happens if a supplier fails to submit reports on time. Define escalation contacts for capacity disputes. This transforms capacity reporting from a nice-to-have into a contractual obligation.
Three-Year Trend Analysis
Once a year, request a three-year historical trend of utilization for the presses assigned to your parts. This long view helps you distinguish between a temporary production spike and a long-term capacity constraint. If utilization has been climbing steadily from 65% to 85% over three years, that supplier is approaching a ceiling. It is time to discuss expansion plans or qualify a backup source.
Our approach at DEWIN is to treat capacity data the same way we treat quality data—as a continuous process, not a one-time event. We integrate capacity reviews into our regular supplier performance scorecards alongside quality metrics, delivery performance, and communication responsiveness.
Conclusion
Capacity and equipment utilization reports from stamping parts suppliers are not administrative paperwork—they are risk management tools. Start with a standardized form, demand verifiable data, audit before your first order, and repeat on a disciplined schedule. In stamping, capacity is not promised—it is proven.
Frequently Asked Questions
What Should I Include in My Capacity Reporting Request to Stamping Parts Suppliers?
A few months ago, one of our purchasing managers flagged a gap in a Vietnamese stamping supplier's data—they listed total press hours but omitted changeover time, which hid a 30% utilization loss nobody expected.
How Do I Verify the Equipment Utilization Data My Stamping Supplier Provides?
During a supplier audit in Vietnam last year, we compared a stamping factory's self-reported 85% utilization rate against their electrical consumption records. The actual figure was closer to 62%—a gap that would have caused serious delivery problems for our client.
Which Capacity Metrics Help Me Assess a Supplier's Ability to Meet My Order Volumes?
The trade-off we weigh most often is this: a supplier with impressive design capacity on paper versus one with lower numbers but rock-solid delivery history. The metrics you track determine which supplier you actually trust with your orders.
Footnotes
1. Authoritative trade body relevant to cross-border manufacturing sourcing discussed in article. ↩︎
2. ISO reference for quality management standards implied by first-pass yield and quality metrics. ↩︎
3. Broad background concept underpinning supplier verification and transparency discussion. ↩︎
4. Links to ISO’s official site, relevant to the automotive quality standard mentioned. ↩︎
5. Background concept explaining MES systems referenced for automated data verification. ↩︎
6. ISO standard reference for maintenance practices mentioned in the audit checklist. ↩︎
7. Defines the core OEE metric used throughout the article for capacity assessment. ↩︎
8. Explains the manufacturing metric referenced for capacity and throughput calculations. ↩︎
9. Explains the OEE metric standard referenced for evaluating stamping supplier performance. ↩︎