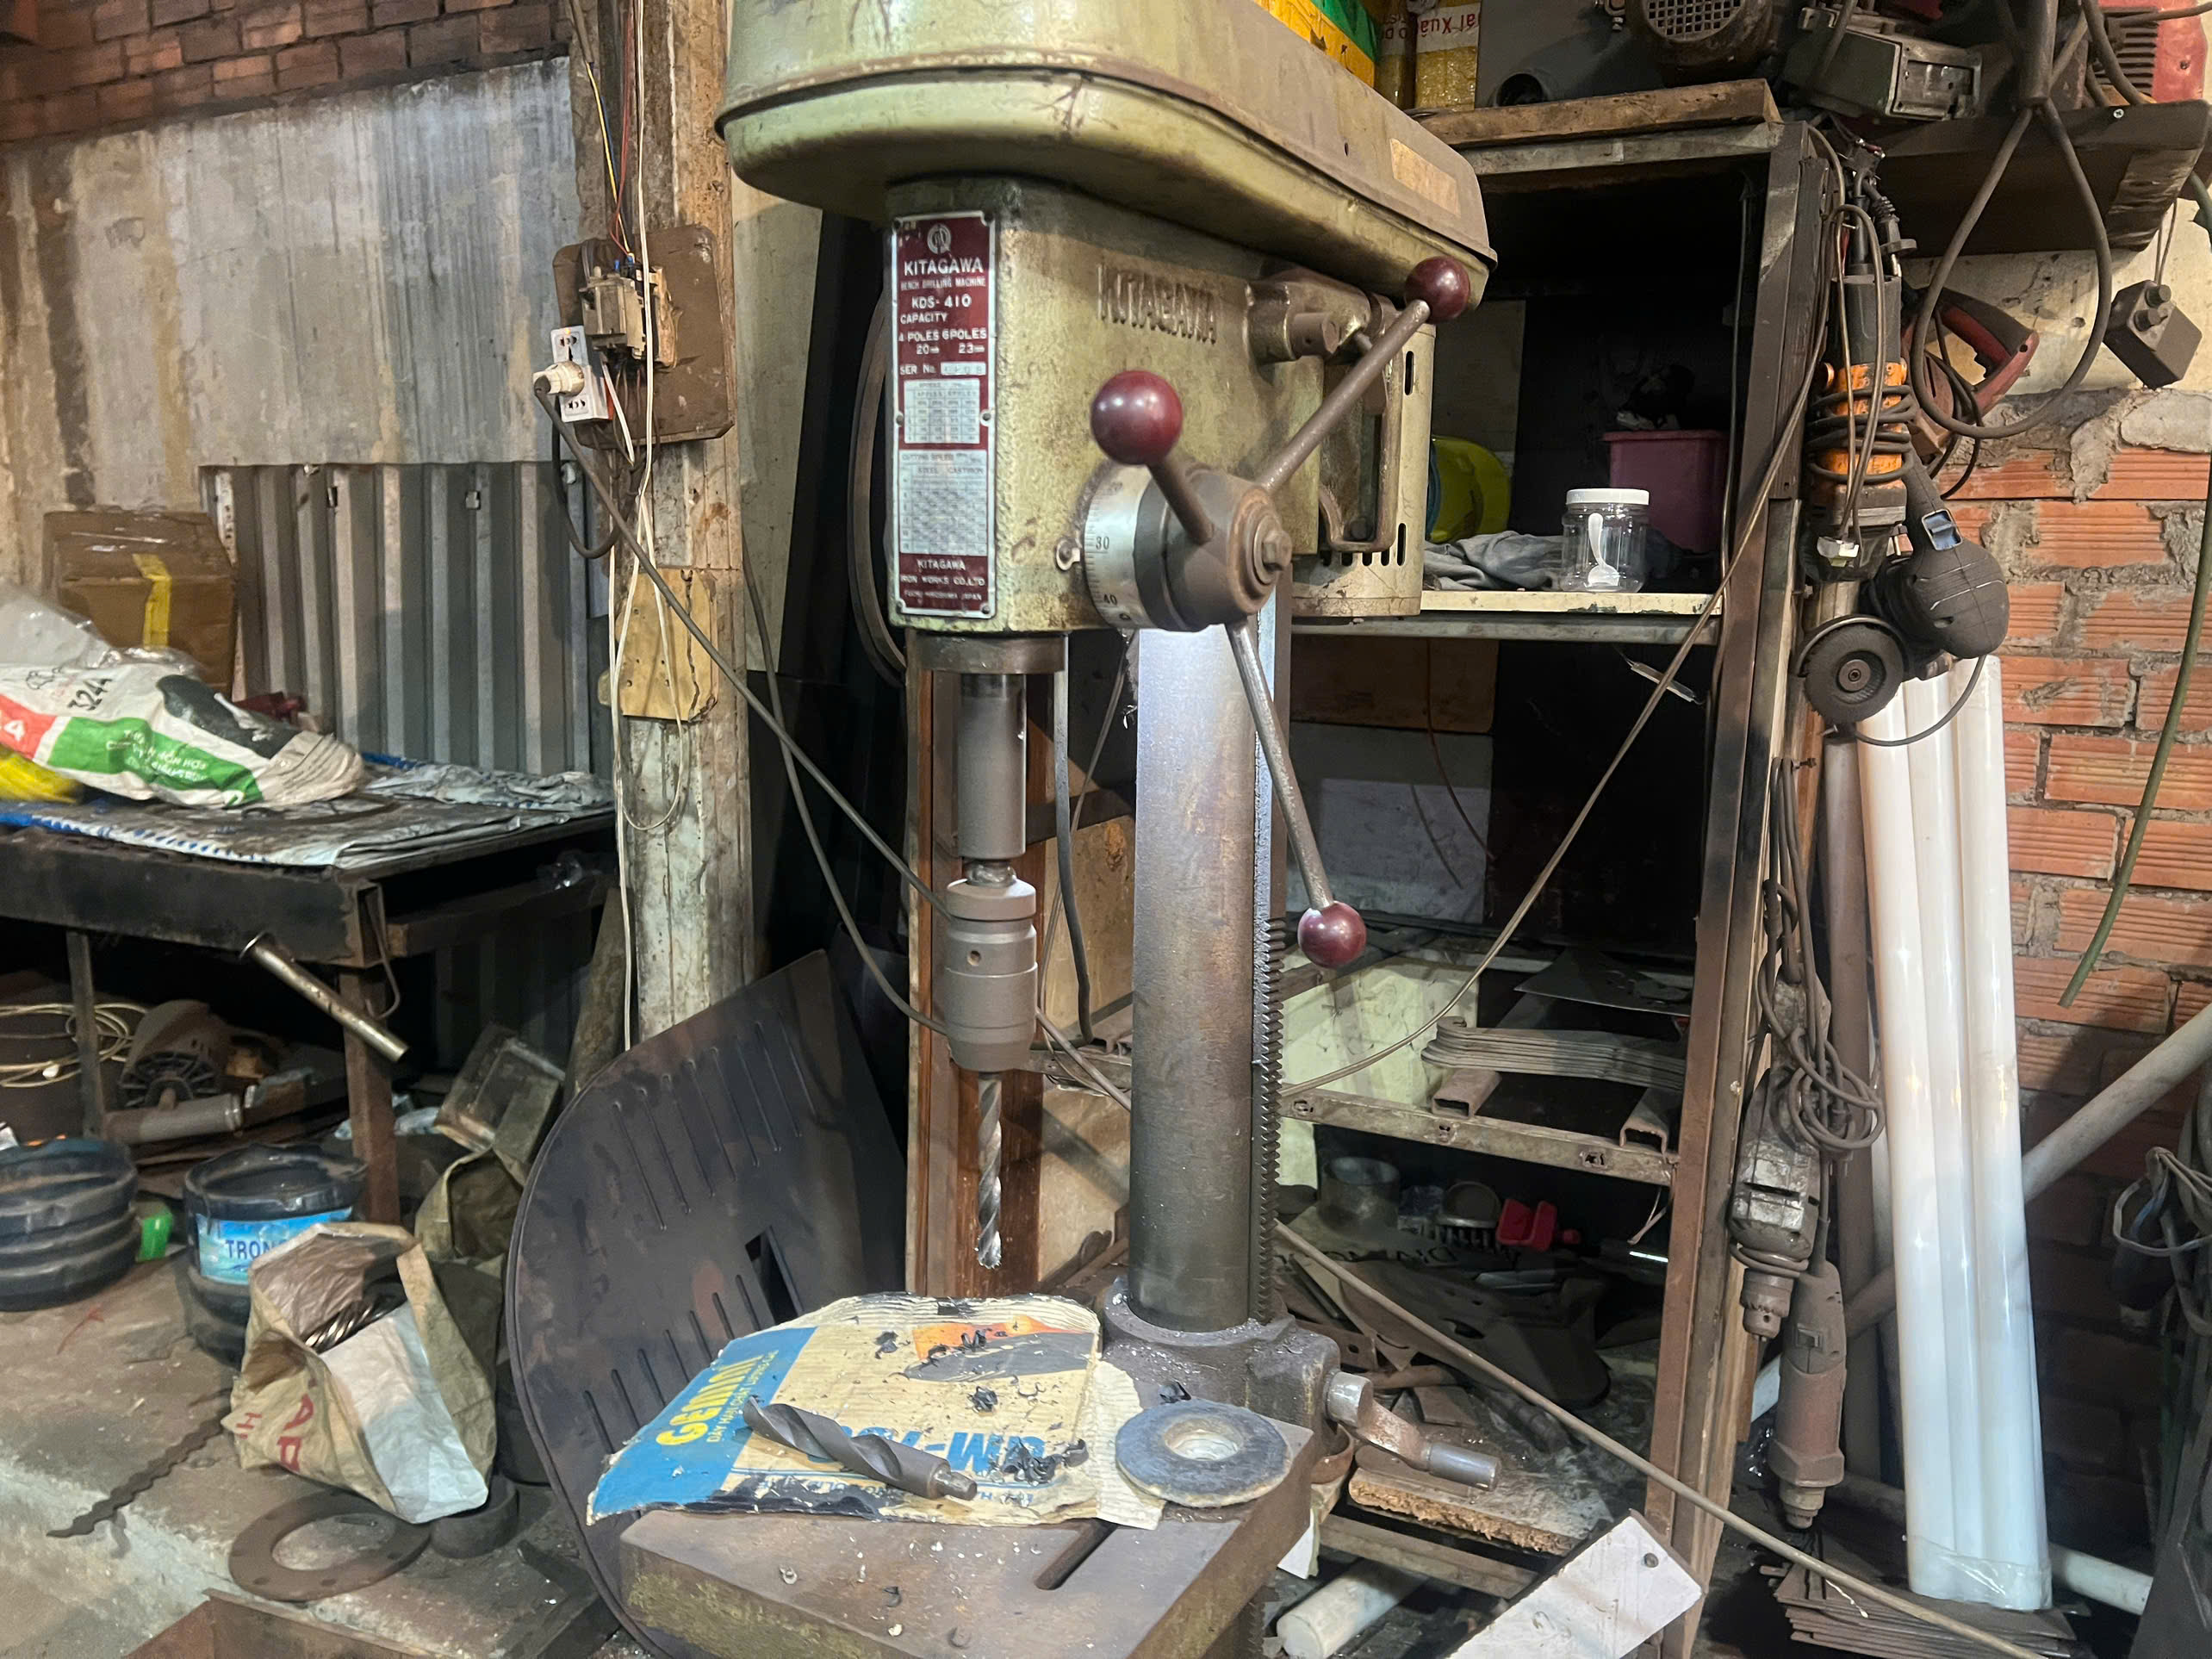
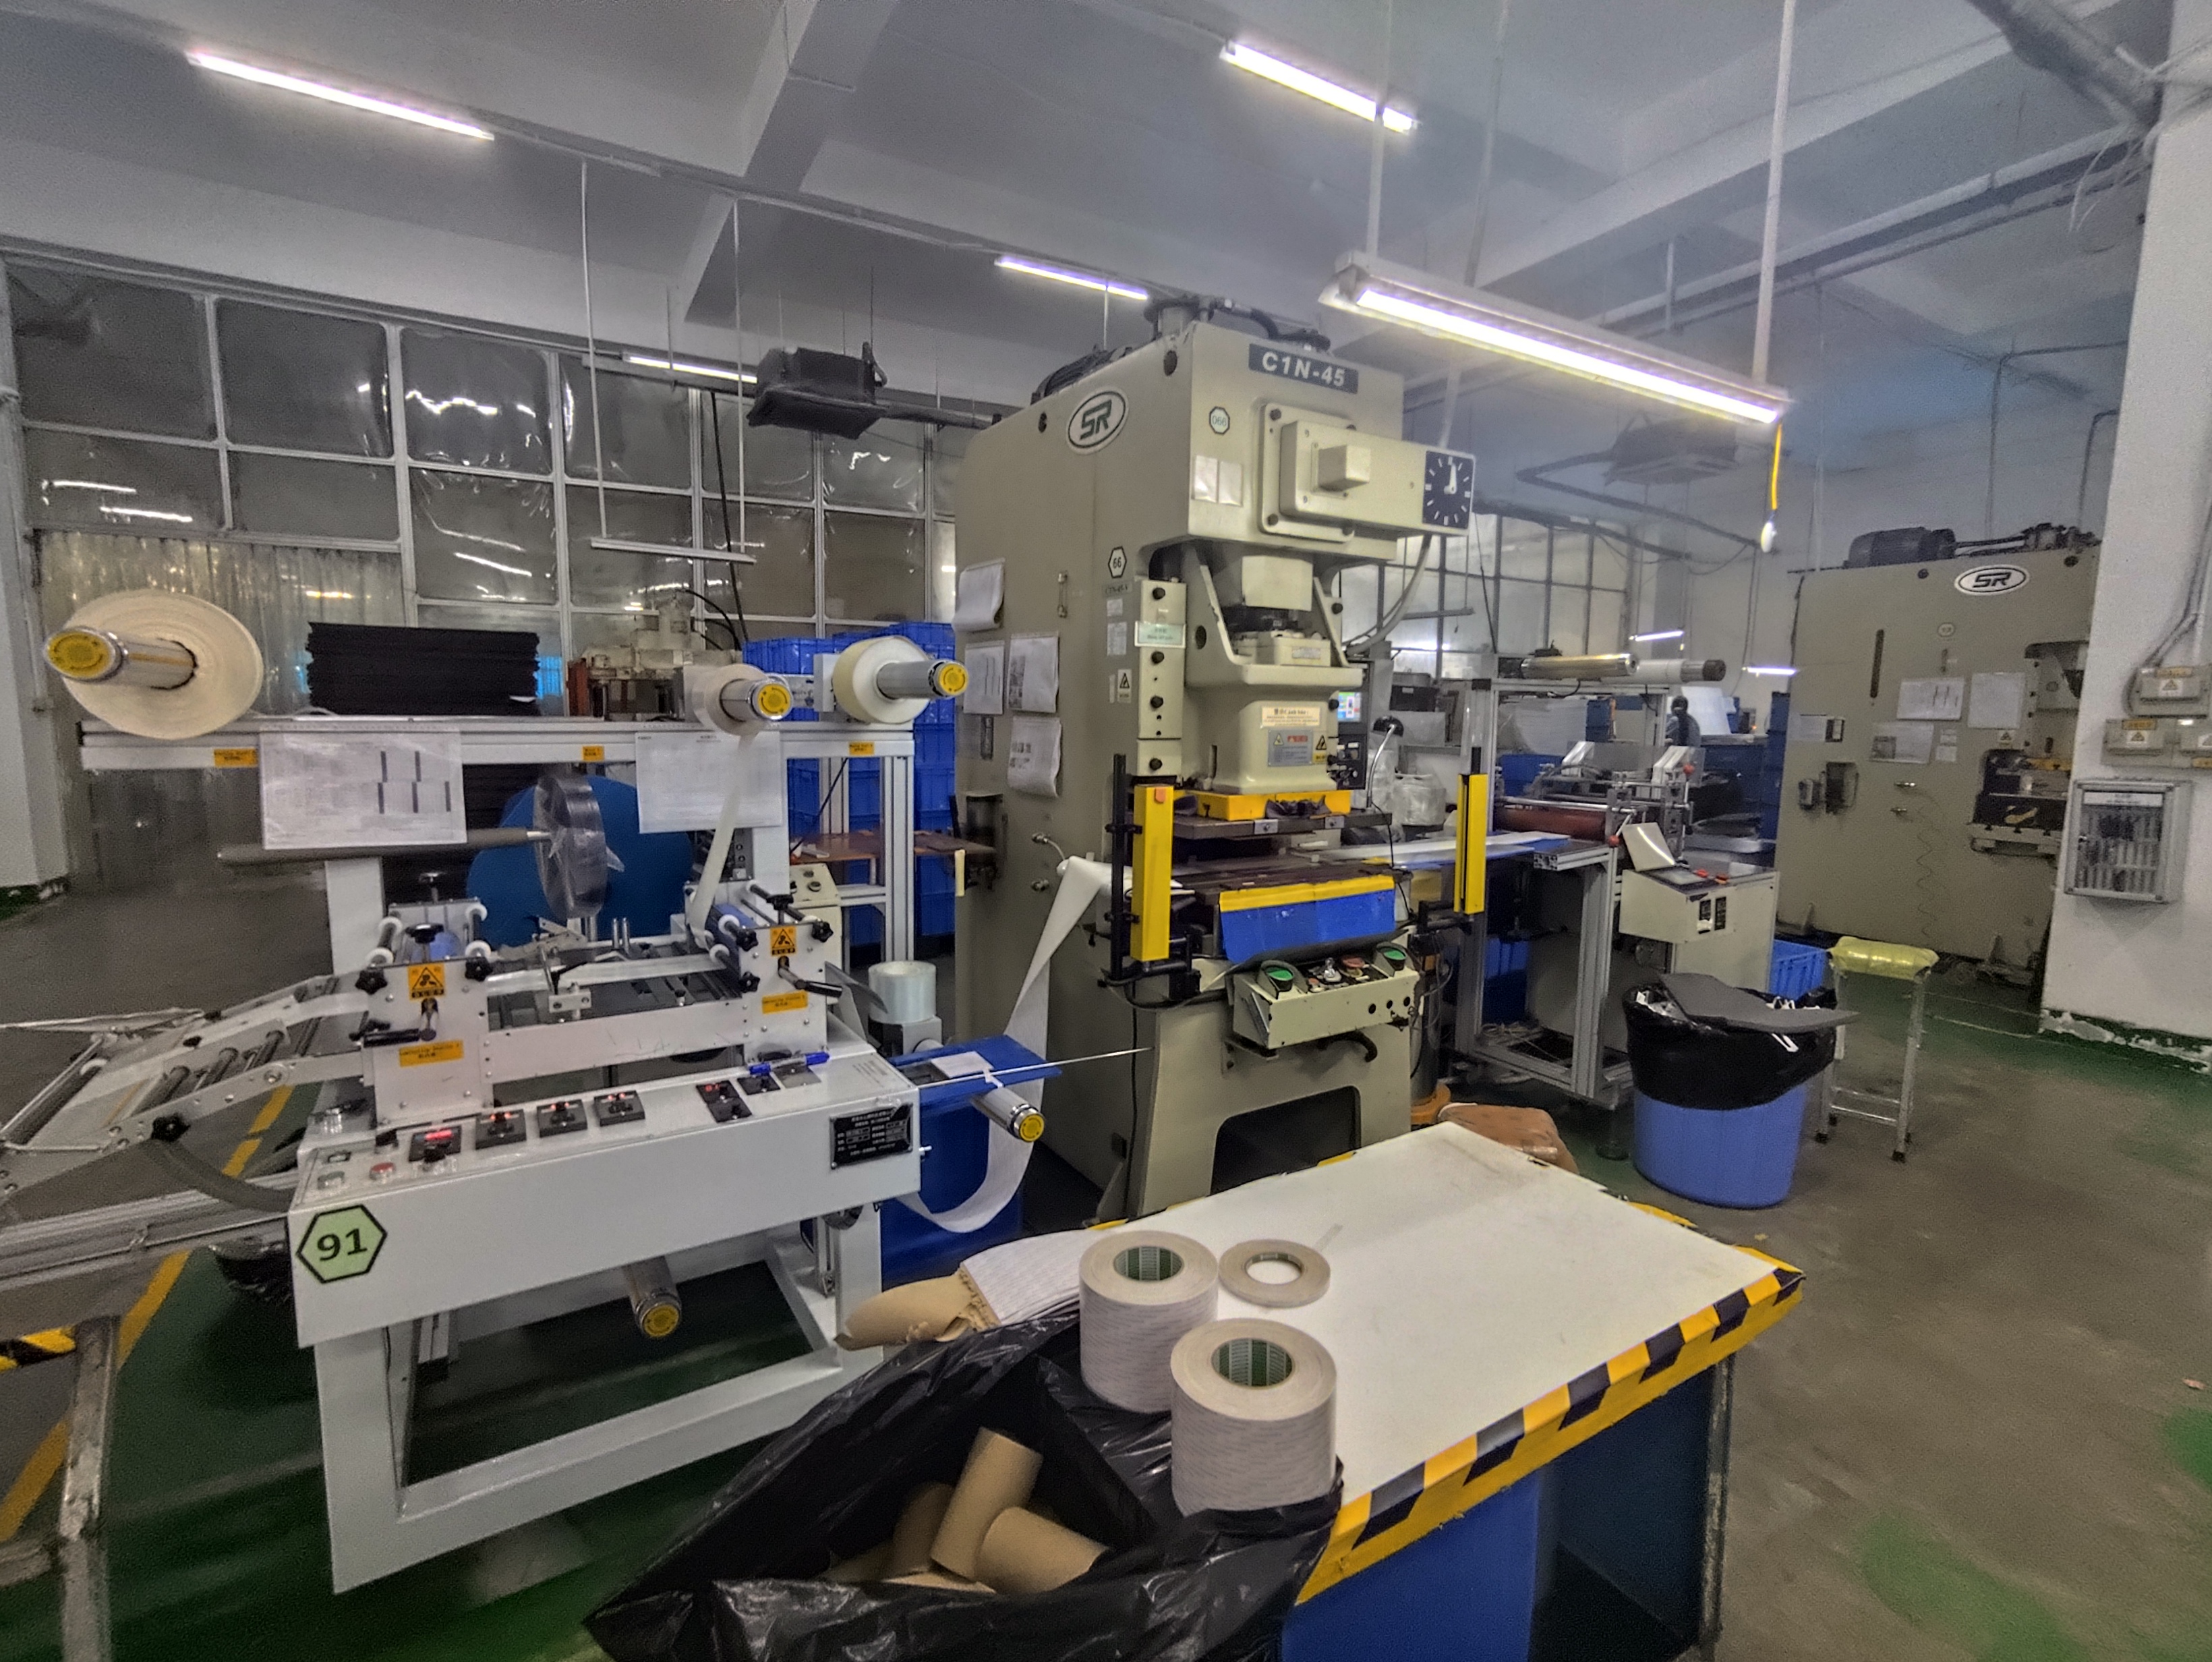
Requesting capacity and equipment utilization reports 1 from stamping parts suppliers almost cost one of our clients a full production quarter. Their supplier claimed “100% availability,” but when demand spiked, the line stopped cold — and so did our client’s assembly plant.
To request annual capacity and equipment utilization reports from stamping parts suppliers, buyers should formally integrate capacity verification forms, Overall Equipment Effectiveness data, press tonnage details, shift schedules, and tooling uptime metrics into their RFQ and onboarding processes, requiring normal, upside, and emergency capacity breakdowns before tooling release.
This guide walks you through exactly what to ask for, how to verify the numbers, and when to raise the alarm Overall Equipment Effectiveness 2. Let me break it down section by section.
What Information Should I Include When Requesting a Capacity Report from My Stamping Supplier?
A lesson I learned early in our supply chain work: asking a supplier "Can you make this?" is the wrong question. The right question is "Show me the data that proves you can — and what happens when demand changes."
When requesting a capacity report, include your annual volume forecast, monthly release schedule, peak demand scenarios, specific press tonnage requirements, tooling uptime expectations, shift plans, material specifications, and secondary process lead times — covering normal, upside, and emergency capacity assumptions.
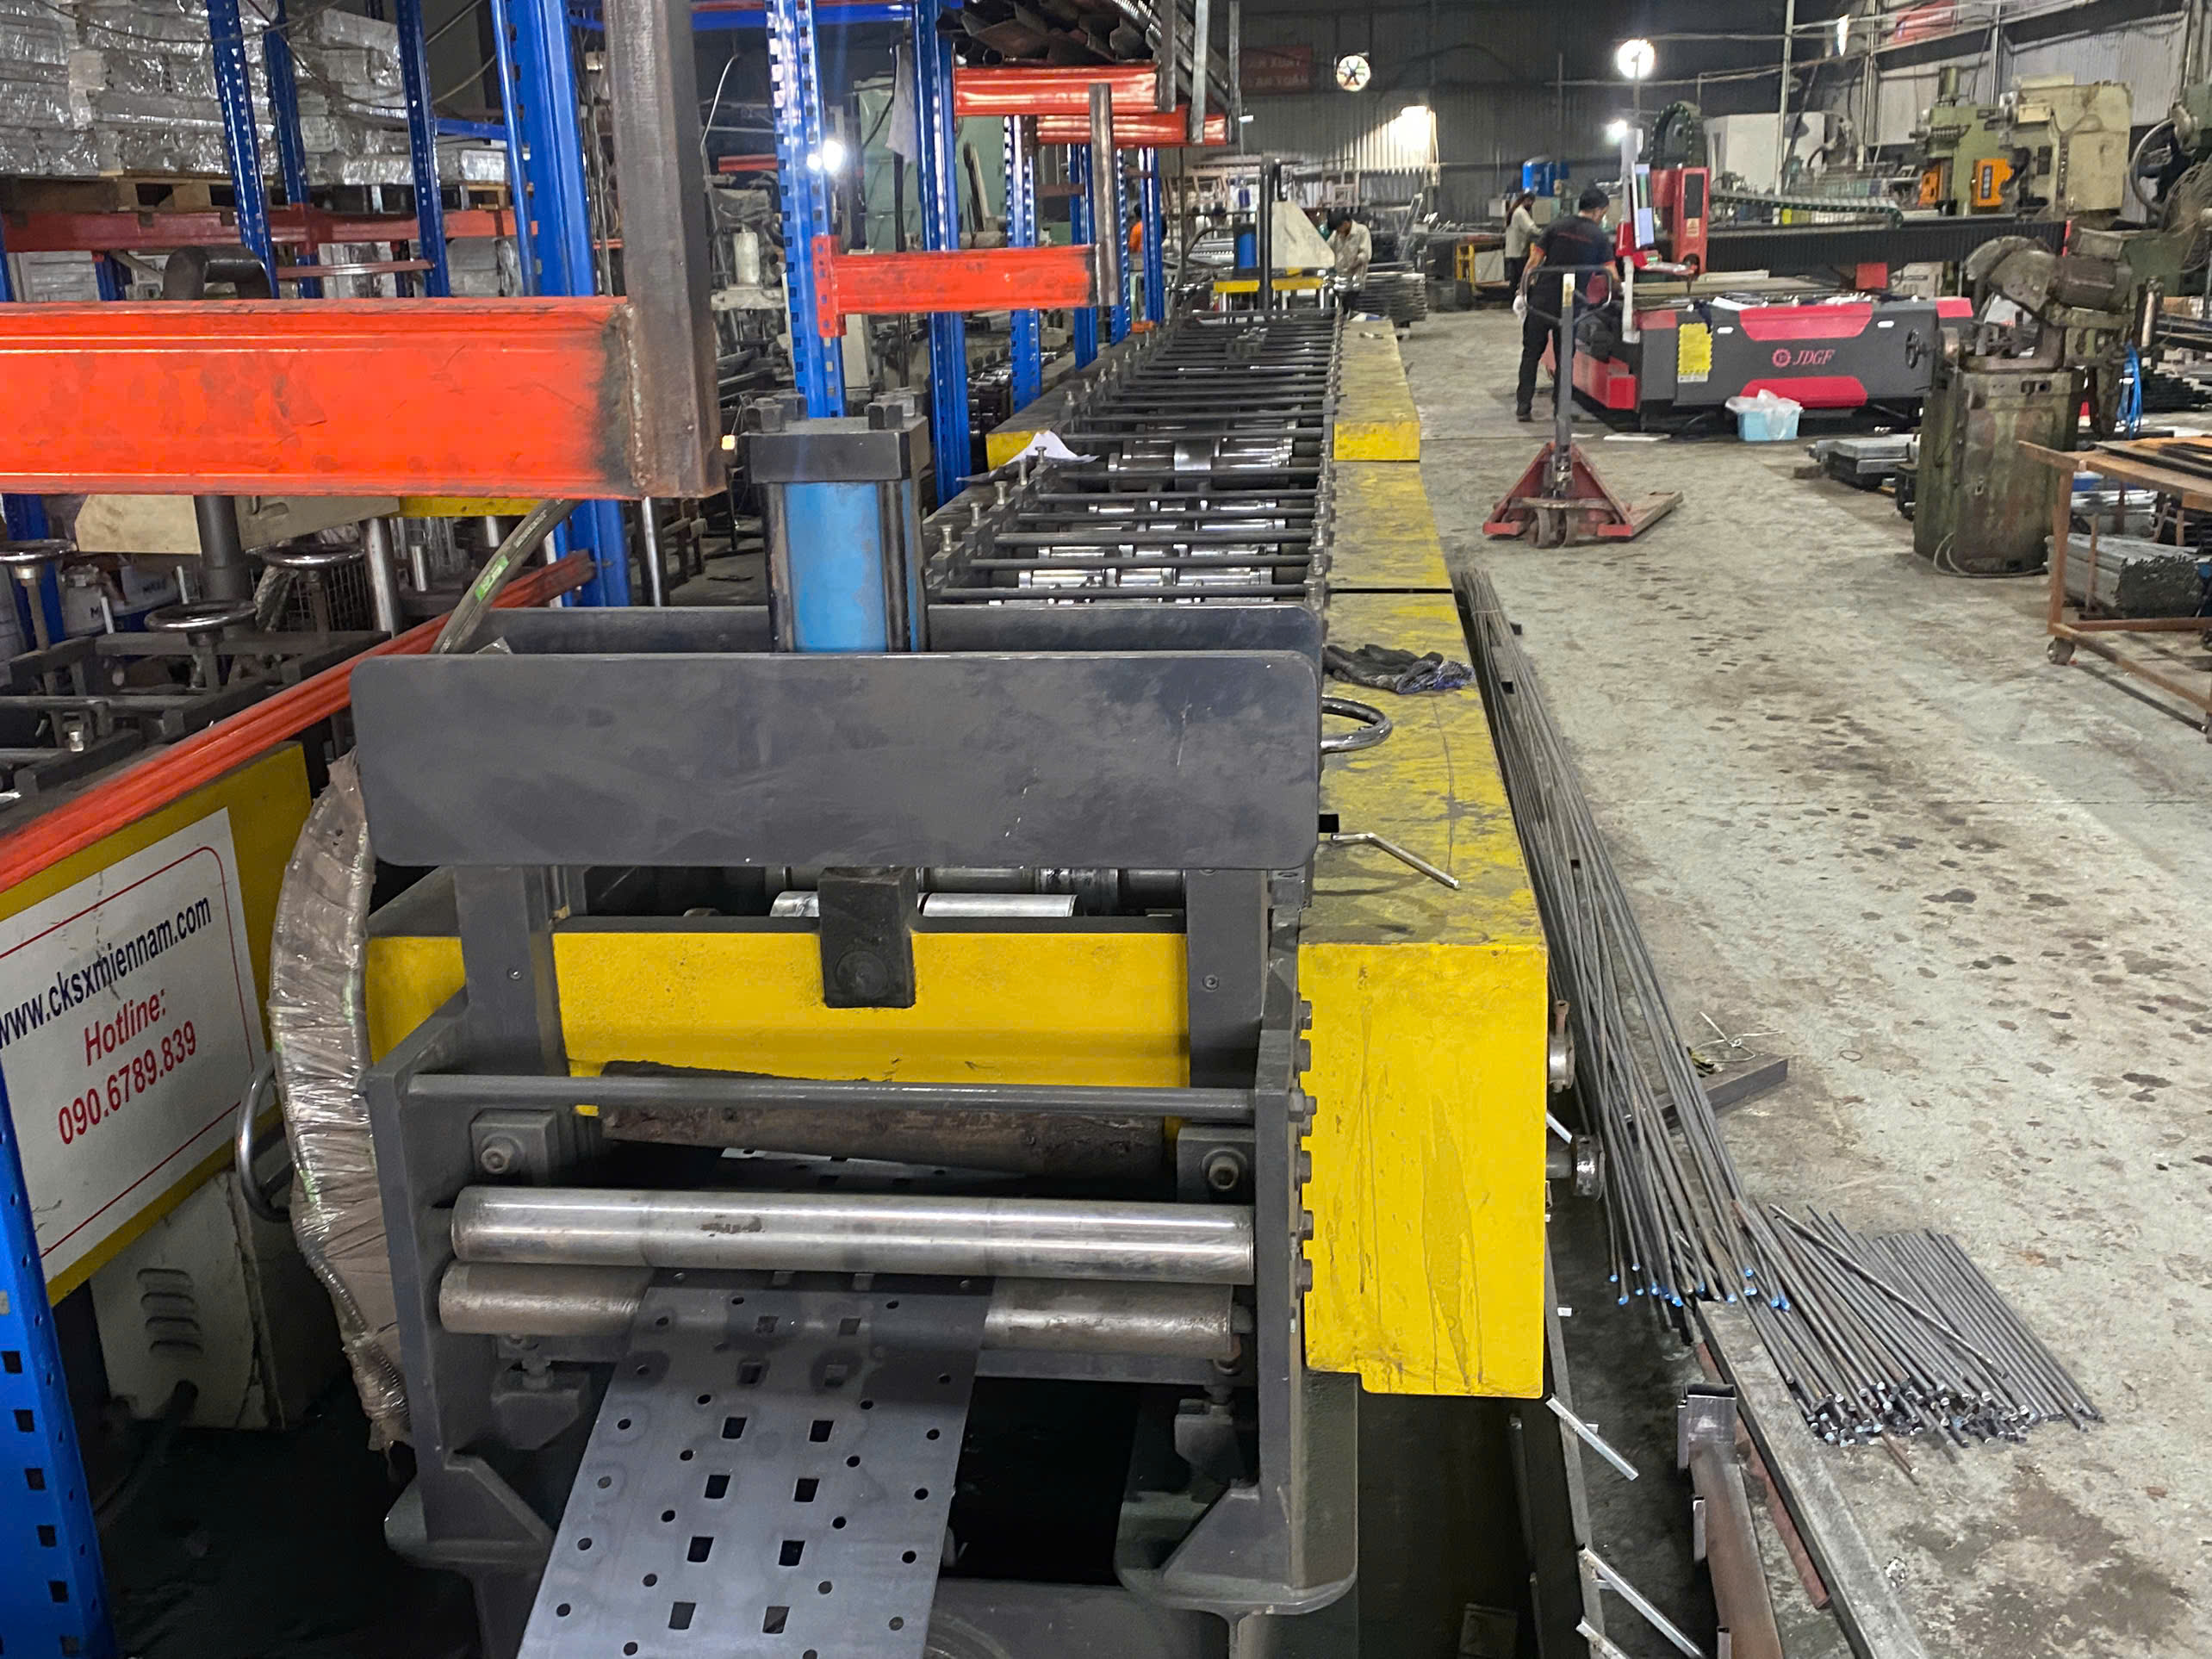
Distinguish Capacity from Utilization
Many buyers confuse annual capacity with equipment utilization Supplier Quality Manual 3. They are related but different. Annual capacity is the maximum theoretical output — the total parts per year a press can produce under ideal conditions. Equipment utilization, often measured through Overall Equipment Effectiveness 4, tells you what percentage of available time the machine actually runs productively. The formula is simple:
Capacity Utilization = (Actual Output / Maximum Capacity) × 100%
A supplier might have the capacity on paper, but if their utilization is already at 95%, there is almost no room for your order digital twin 5. That is why you need both numbers.
The Core Data Points to Request
When we help U.S. clients source stamping parts 6 from suppliers in Vietnam or other Asian countries, we insist on a structured data request. Here is the checklist we use:
| Data Point | Why It Matters |
|---|---|
| Annual volume forecast (your demand) | Sets the baseline for capacity allocation |
| Monthly release schedule | Aligns supplier production planning with your needs |
| Peak demand / upside scenario | Tests if the supplier can handle spikes |
| Press tonnage and bed size | Ensures the right machine is assigned to your part |
| Shift plan (2-shift vs. 3-shift) | Reveals how much additional capacity exists |
| Tooling uptime vs. machine uptime | Identifies the true bottleneck |
| Standard Annual Capacity (CPV) | The supplier's verified capacity for your part number |
| Material grade and coil lead times | Catches hidden material supply constraints |
| Secondary process lead times (plating, coating) | Often the real bottleneck, not the press |
| Packaging rate and target lead time | Affects production lead times and delivery scheduling |
Go Beyond the Press
One thing our team in Vietnam sees often: the press itself is not the bottleneck. Material supply, plating, heat treatment, or coating capacity can be the real constraint. When we audit stamping suppliers, we always ask for a holistic view of the production chain — not just the stamping step. If a supplier's plating vendor can only process 5,000 parts per week but the press can stamp 10,000, your real capacity is 5,000. Include questions about outside process partners in your request.
Normal, Upside, and Emergency Plans
I always recommend that buyers demand three capacity scenarios alongside the quote. The "normal plan" covers your base forecast. The "upside plan" covers what happens if demand increases 20–30%. The "emergency plan" addresses how the supplier handles a sudden surge. This makes capacity costs visible and forces the supplier to think ahead. It also helps you assess supply chain risk before the first order ships.
How Can I Verify the Accuracy of a Supplier's Equipment Utilization Data?
During a recent supplier audit at a stamping facility, we noticed the utilization report showed 92% — but the shop floor told a different story. Two presses sat idle during our walkthrough. The numbers came from a spreadsheet updated weekly by a supervisor. That gap between reported data and reality is more common than you think.
To verify equipment utilization data accuracy, buyers should require real-time software tracking instead of manual logs, demand month-long measurement periods, confirm that only good units are counted, cross-reference data with tooling maintenance logs, and conduct on-site run-at-rate studies during supplier audits.
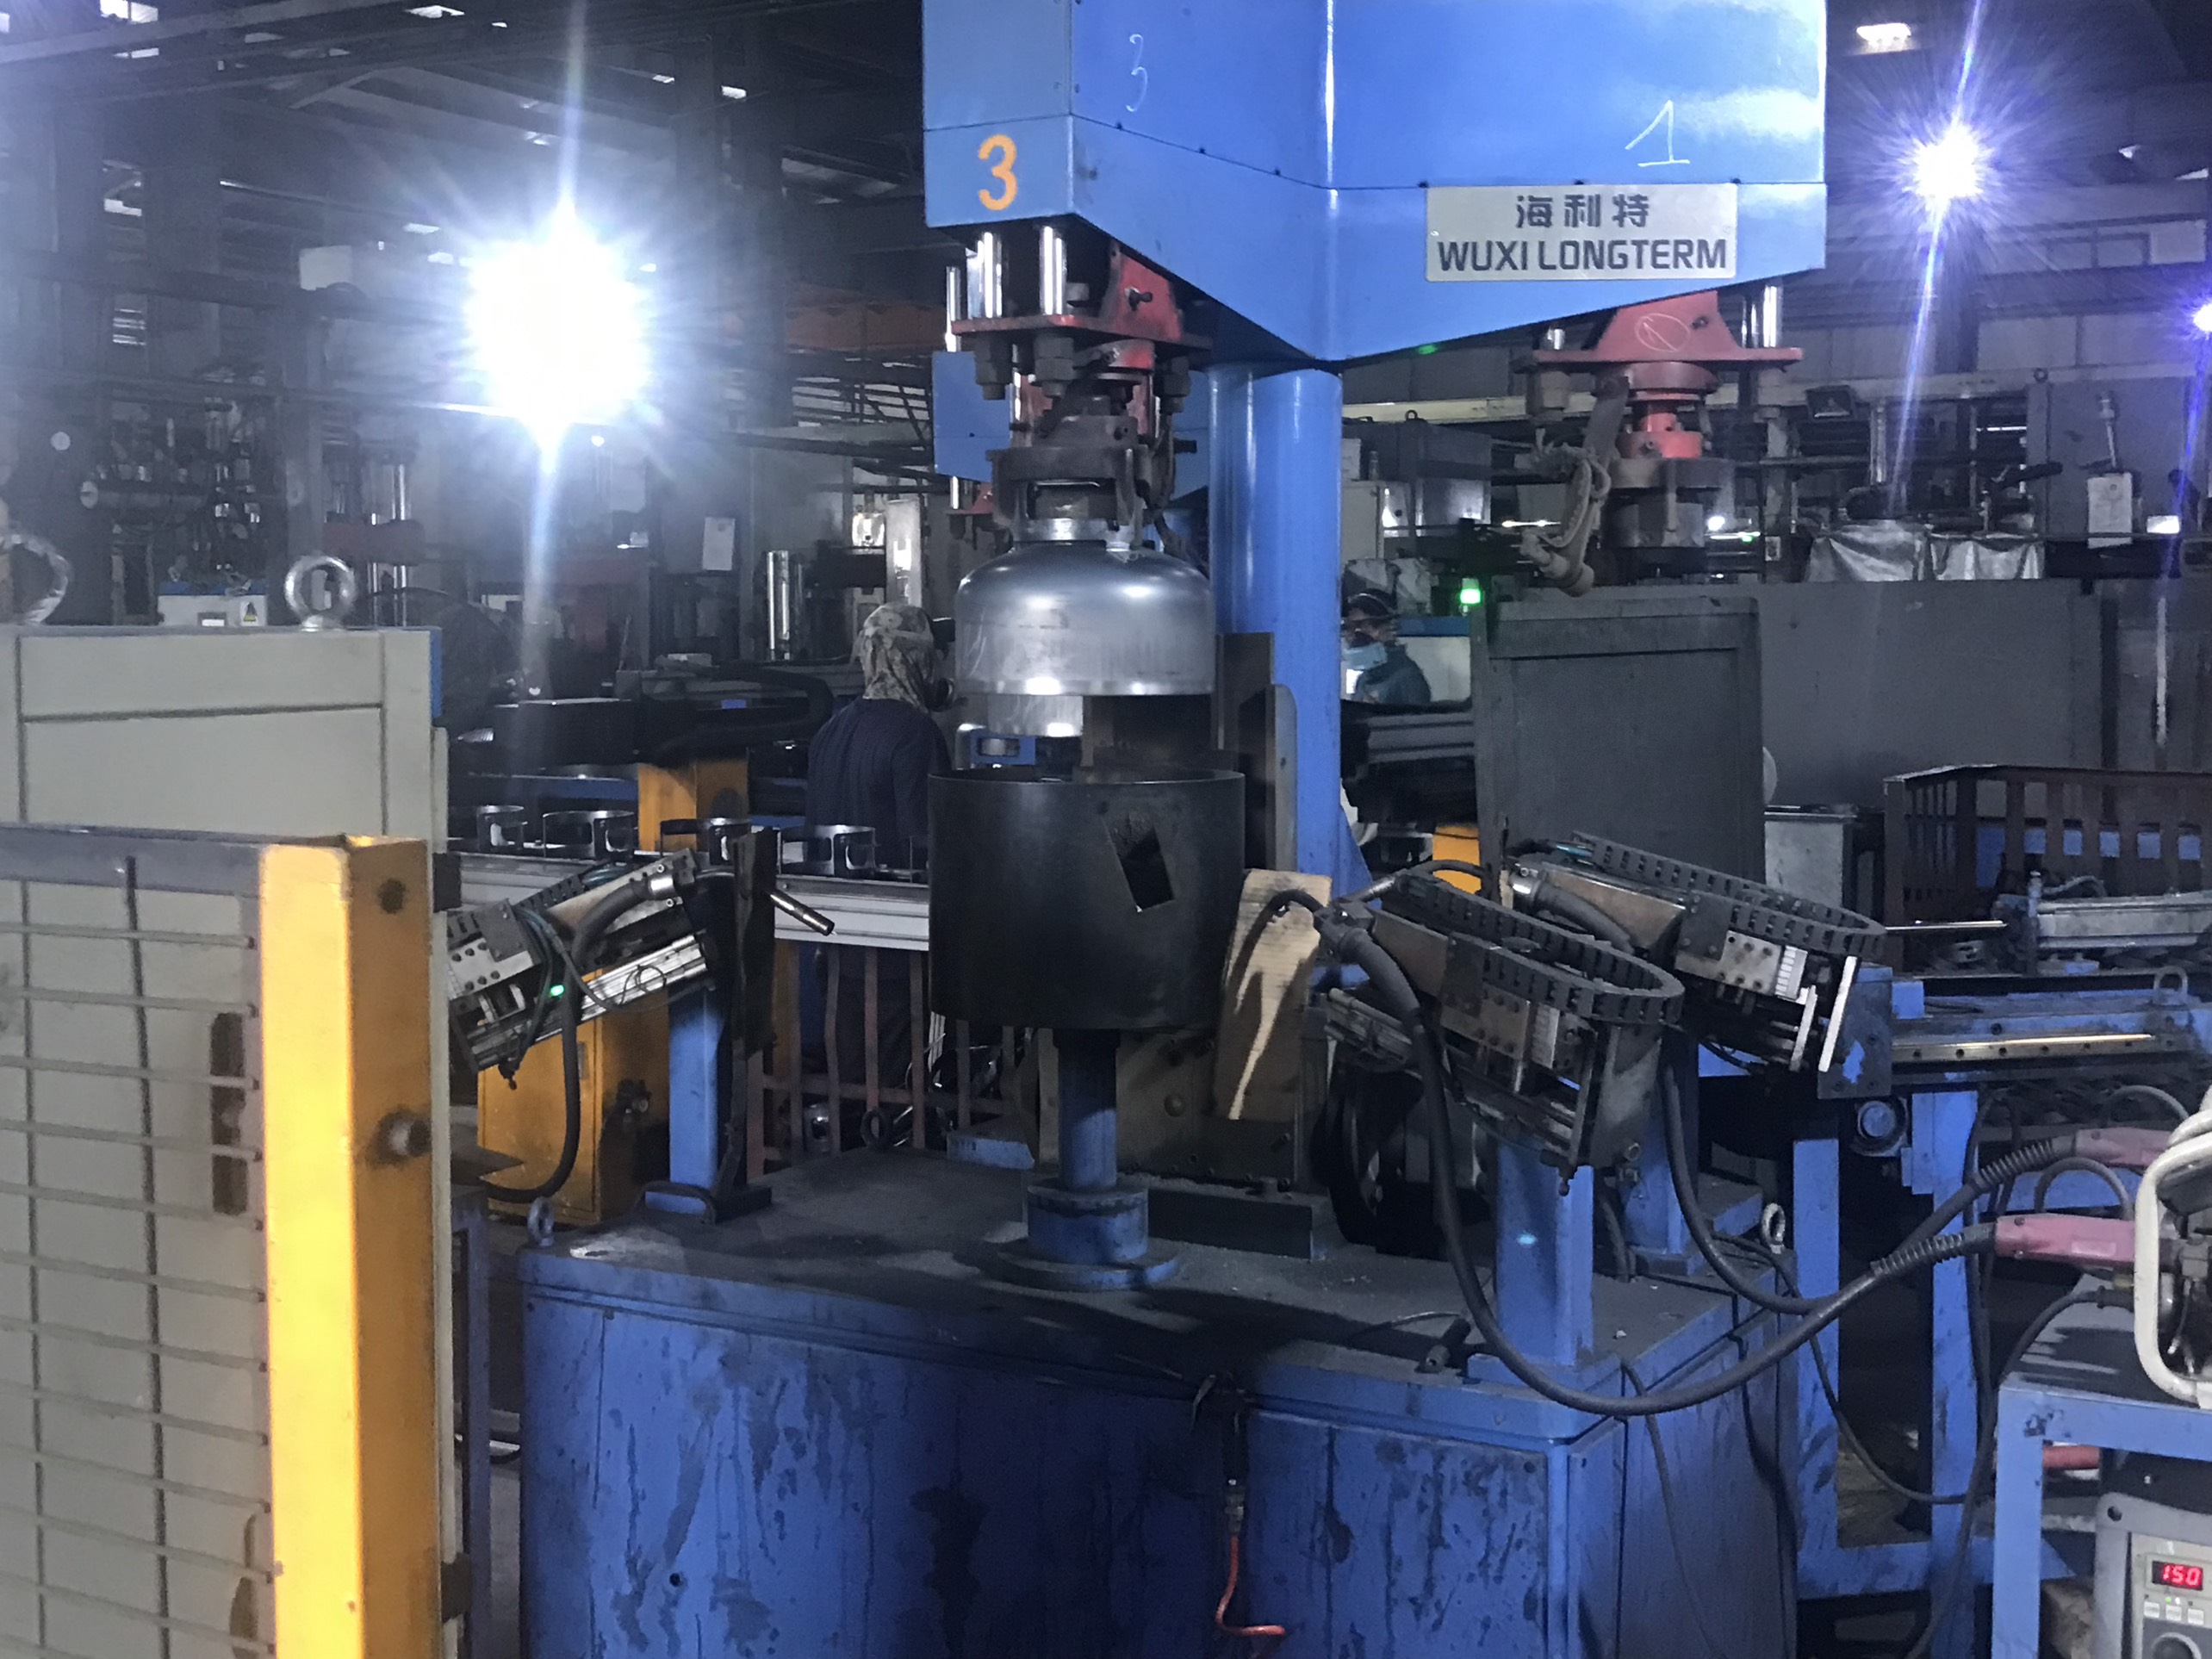
Software Tracking vs. Manual Logs
The single biggest improvement in shop floor data collection over the past decade is the shift from clipboard-based logs to automated software tracking. Tools like MachineMetrics or OnTrack3 pull data directly from the machine controller. They record run hours, idle time, cycle counts, and reject rates without human intervention. When a supplier hands you a capacity report generated from real-time software, you can trust it far more than a spreadsheet filled in at the end of a shift.
I always ask suppliers: "How do you collect your utilization data?" If the answer is "our operators log it," that is a yellow flag. Human error, rounding, and selective reporting are real problems.
Use Longer Measurement Periods
A one-day snapshot of machine utilization is meaningless. Planned maintenance, die changes, material shortages, and seasonal fluctuations all affect the numbers. We recommend requiring at least a month-long testing period to establish a credible baseline. This captures the full cycle of planned and unplanned downtime and gives you a realistic annual output figure.
The 85% Rule
Here is a critical benchmark: the optimal utilization rate for most stamping manufacturers is around 85%. This leaves room for preventive maintenance, rush orders, and unexpected machine downtime analysis. If a supplier claims sustained utilization above 95%, treat it as a risk indicator — not a strength. They have no buffer for your demand spike, and quality often suffers when machines run flat out.
| Verification Method | What It Reveals | Reliability |
|---|---|---|
| Real-time software tracking | Actual run hours, idle time, reject rates | High |
| Manual operator logs | Self-reported production counts | Low to Medium |
| Run-at-rate study (on-site) | Actual speed, yield, and cycle time under observation | High |
| Energy-per-stroke metrics | Equipment health and efficiency trends | Medium to High |
| Tooling maintenance logs review | Die condition and unplanned downtime causes | Medium |
Run-at-Rate Studies
A run-at-rate study is one of the most effective ways to validate a supplier's claims. You observe actual production over a continuous period — typically several hours to a full shift. You count good parts, track cycle time, and record any stoppages. This method is standard in IATF 16949 7 compliance environments and gives you hard evidence of manufacturing throughput.
Quality-Adjusted Output
Make sure the capacity report counts only good units. If a supplier stamps 10,000 parts but 500 are scrap, their real output is 9,500. Ask explicitly: "Does your utilization figure exclude defective parts?" If it does not, the number is inflated. This is a simple but often overlooked verification step.
Which Red Flags in Capacity Reports Signal Potential Delivery Delays?
One of our U.S. clients once received a capacity report that looked perfect on paper — high utilization, ample throughput, short lead times. Three months later, they were chasing weekly updates on late shipments. Looking back, the warning signs were there. We just did not know what to look for at the time. That experience shaped how we now review every capacity report.
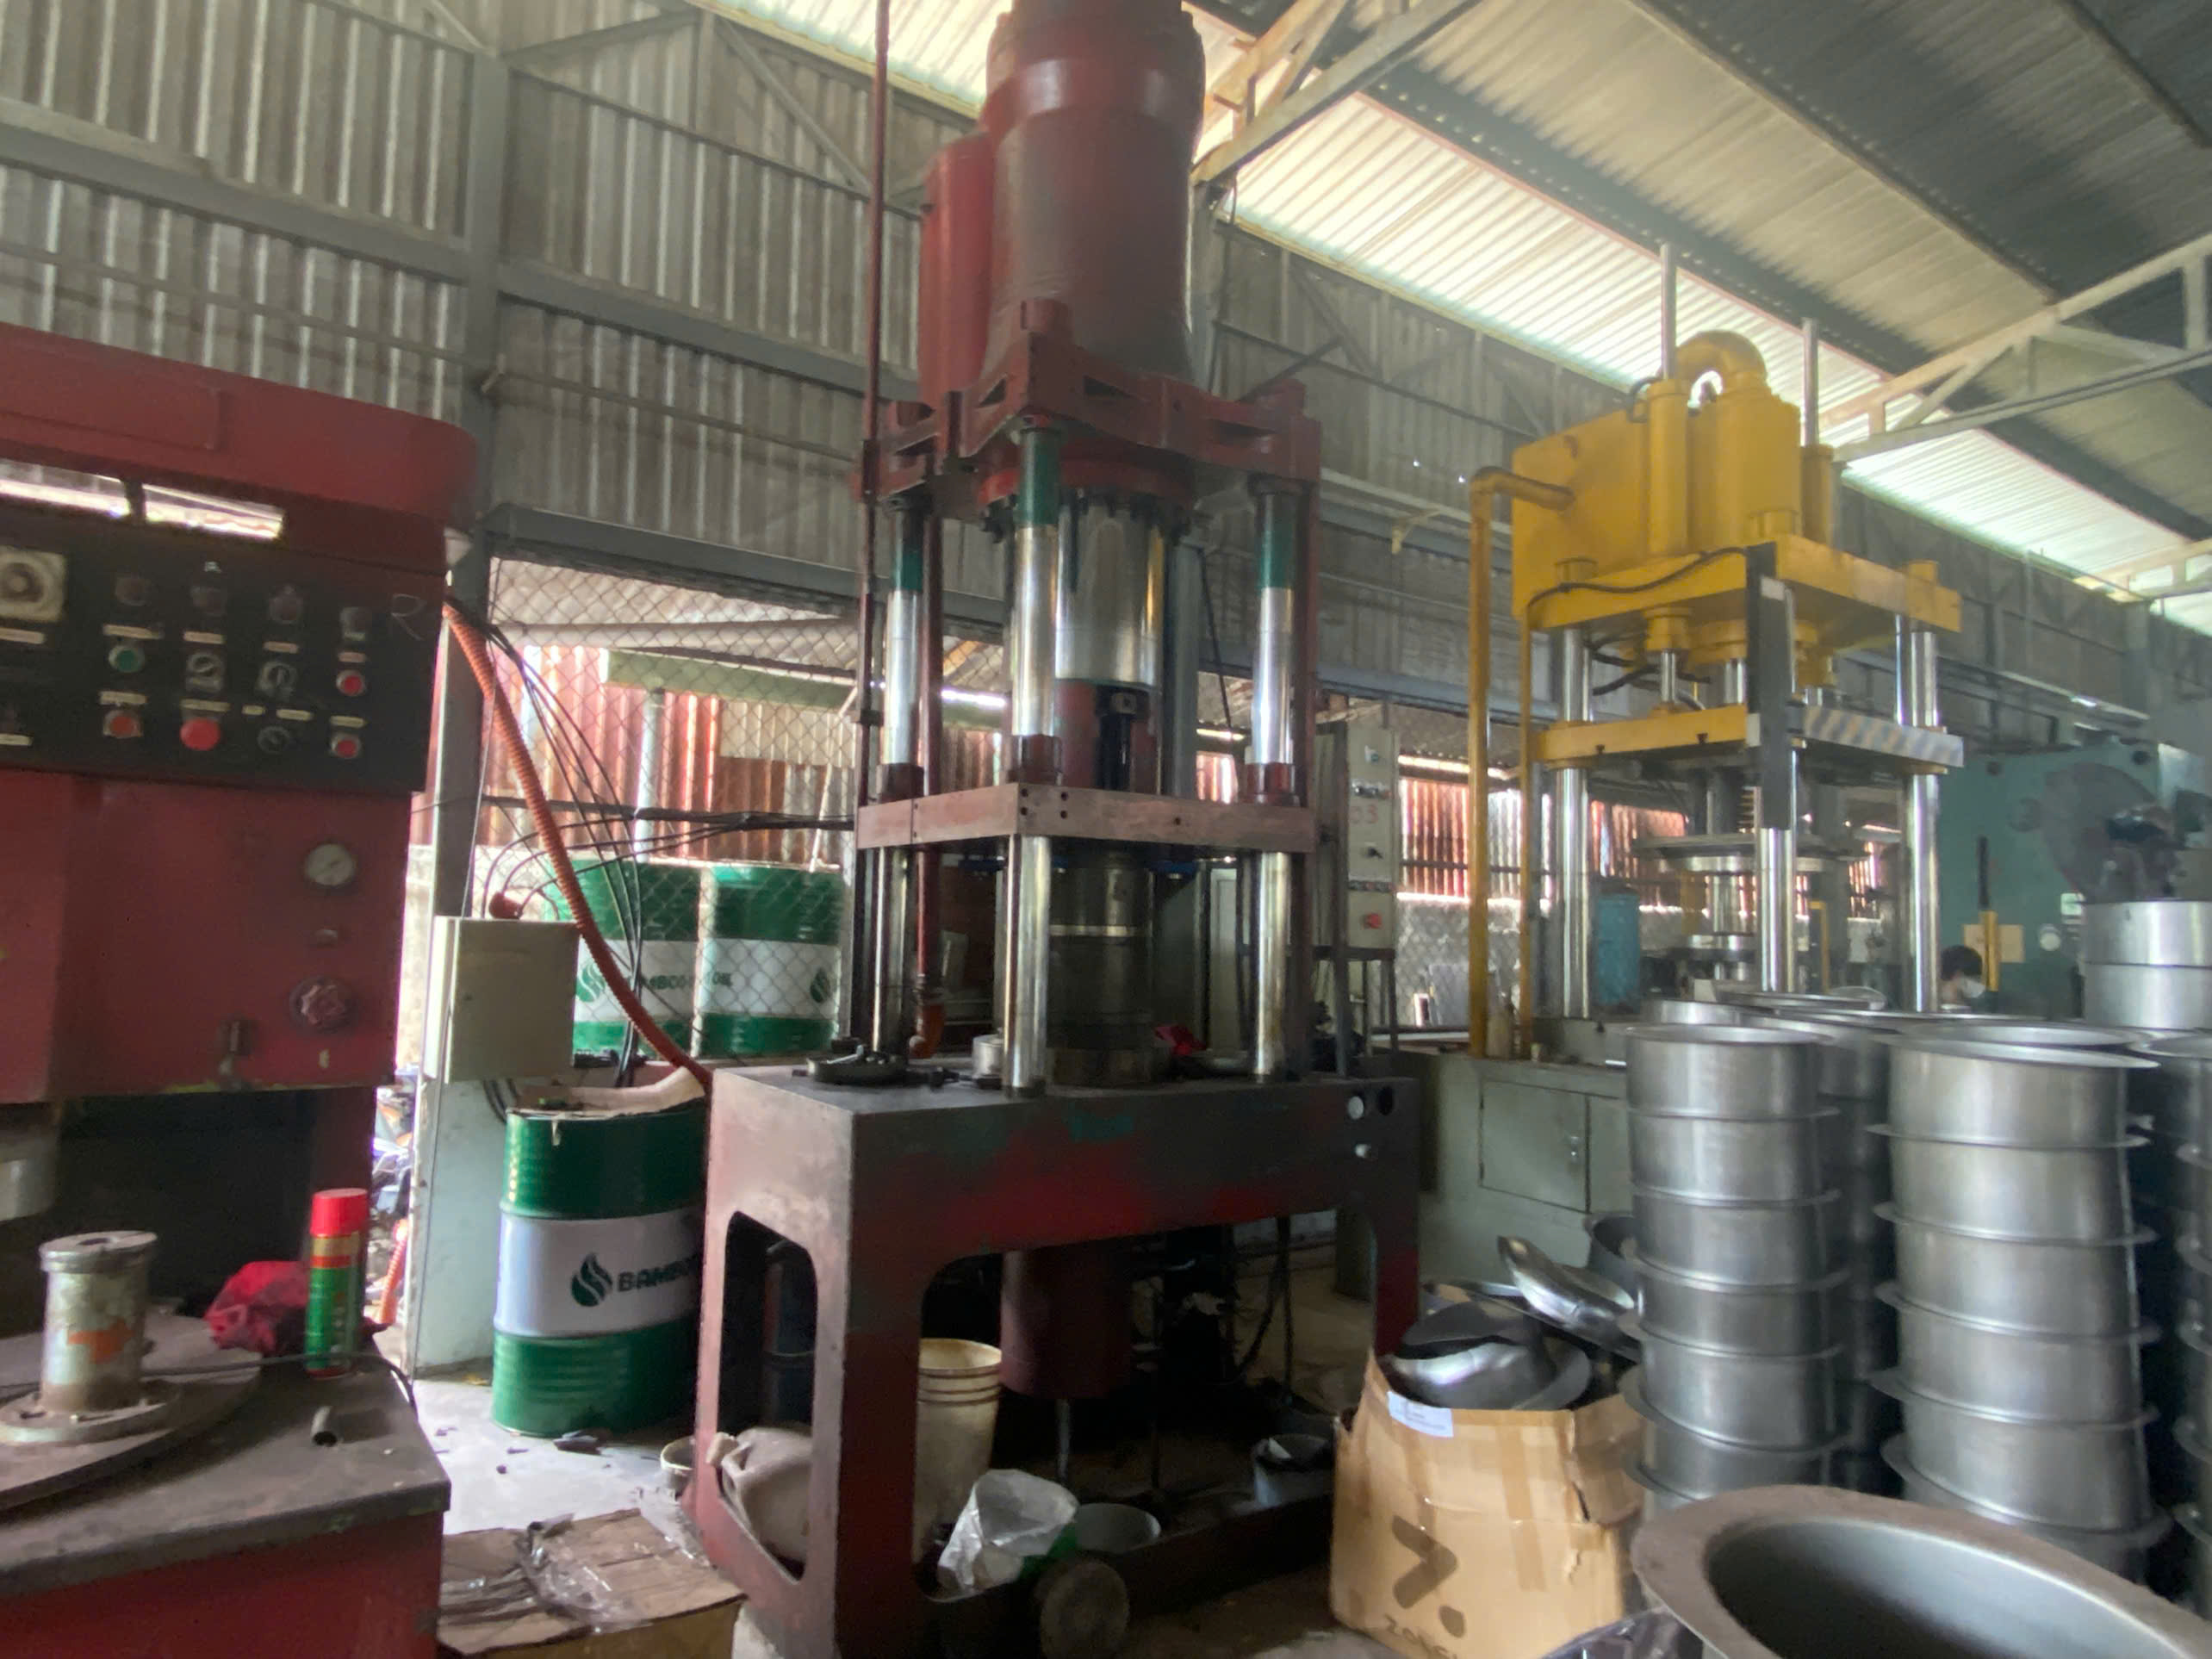
Red flags include utilization rates above 95%, missing unplanned downtime data, no distinction between tooling and machine bottlenecks, single-shift-only operations with no upside plan, undisclosed subcontractors for secondary processes, and capacity figures based on theoretical maximums rather than adjusted efficiency factors.
The Warning Signs, Ranked
Not every issue in a capacity report is equally dangerous. Here is how I rank the red flags based on our experience managing stamping supply chains across Asia:
| Red Flag | Risk Level | What It Means |
|---|---|---|
| Utilization reported above 95% sustained | High | No buffer for maintenance, rush orders, or your demand spike |
| No unplanned downtime category | High | Supplier is hiding reliability issues or not tracking them |
| Tooling vs. machine bottleneck not identified | Medium-High | Supplier does not understand their own constraints |
| Capacity based on "design capacity 8" only | Medium-High | No adjustment for real-world efficiency losses |
| No upside or emergency plan provided | Medium | Supplier has not planned for your growth |
| Single-shift operation with no scale plan | Medium | Limited ability to absorb volume increases |
| Secondary processes (plating, coating) not included | Medium | Hidden bottleneck outside the stamping press |
| No mention of material lead times | Low-Medium | Coil supply disruptions can halt production regardless of press availability |
| Data from manual logs only | Low-Medium | Numbers may be inaccurate or outdated |
Theoretical vs. Realistic Capacity
This is a common debate in supplier performance metrics reviews. Suppliers like to quote "design capacity" — the number they can produce under ideal conditions with zero downtime, zero scrap, and perfect material flow. Buyers need "realistic capacity," which accounts for adjusted efficiency factors. If a supplier cannot explain the difference or refuses to share adjusted numbers, that is a clear red flag.
Capacity Concentration Risk
Another warning sign I watch for: what percentage of a supplier's total machine hours go to your account? If your order consumes 60% or more of a single press's available time, you are highly exposed. Any disruption to that press — breakdown, tooling failure, another customer's rush order — hits you directly. Ask for capacity concentration data. Diversified allocation across multiple presses or shifts is healthier for both sides.
Missing Tooling Maintenance Logs
Tooling maintenance logs tell you the history of the die. How often does it need sharpening? How many strokes before regrinding? Has it been rebuilt? If a supplier cannot produce these records, their tooling uptime claims are guesswork. Die failures are one of the top causes of unplanned downtime in stamping, and they directly impact your delivery schedule.
The Subcontractor Question
When secondary operations like plating, heat treatment, or coating are outsourced, the supplier's capacity report should disclose those partners and their capacity. If the report covers only the stamping step, you are seeing half the picture. We have seen cases where the stamping supplier had plenty of press time, but their plating vendor was the bottleneck — and nobody flagged it until parts were late.
How Often Should I Request Updated Capacity Reports from My Stamping Parts Suppliers?
When we onboarded a new stamping supplier in Vietnam last year, their initial capacity report was solid. Six months later, they had taken on three new customers and added a second shift — but never told us. Our client's allocation priority had silently dropped. That experience reinforced a principle we now follow without exception: capacity reports expire.
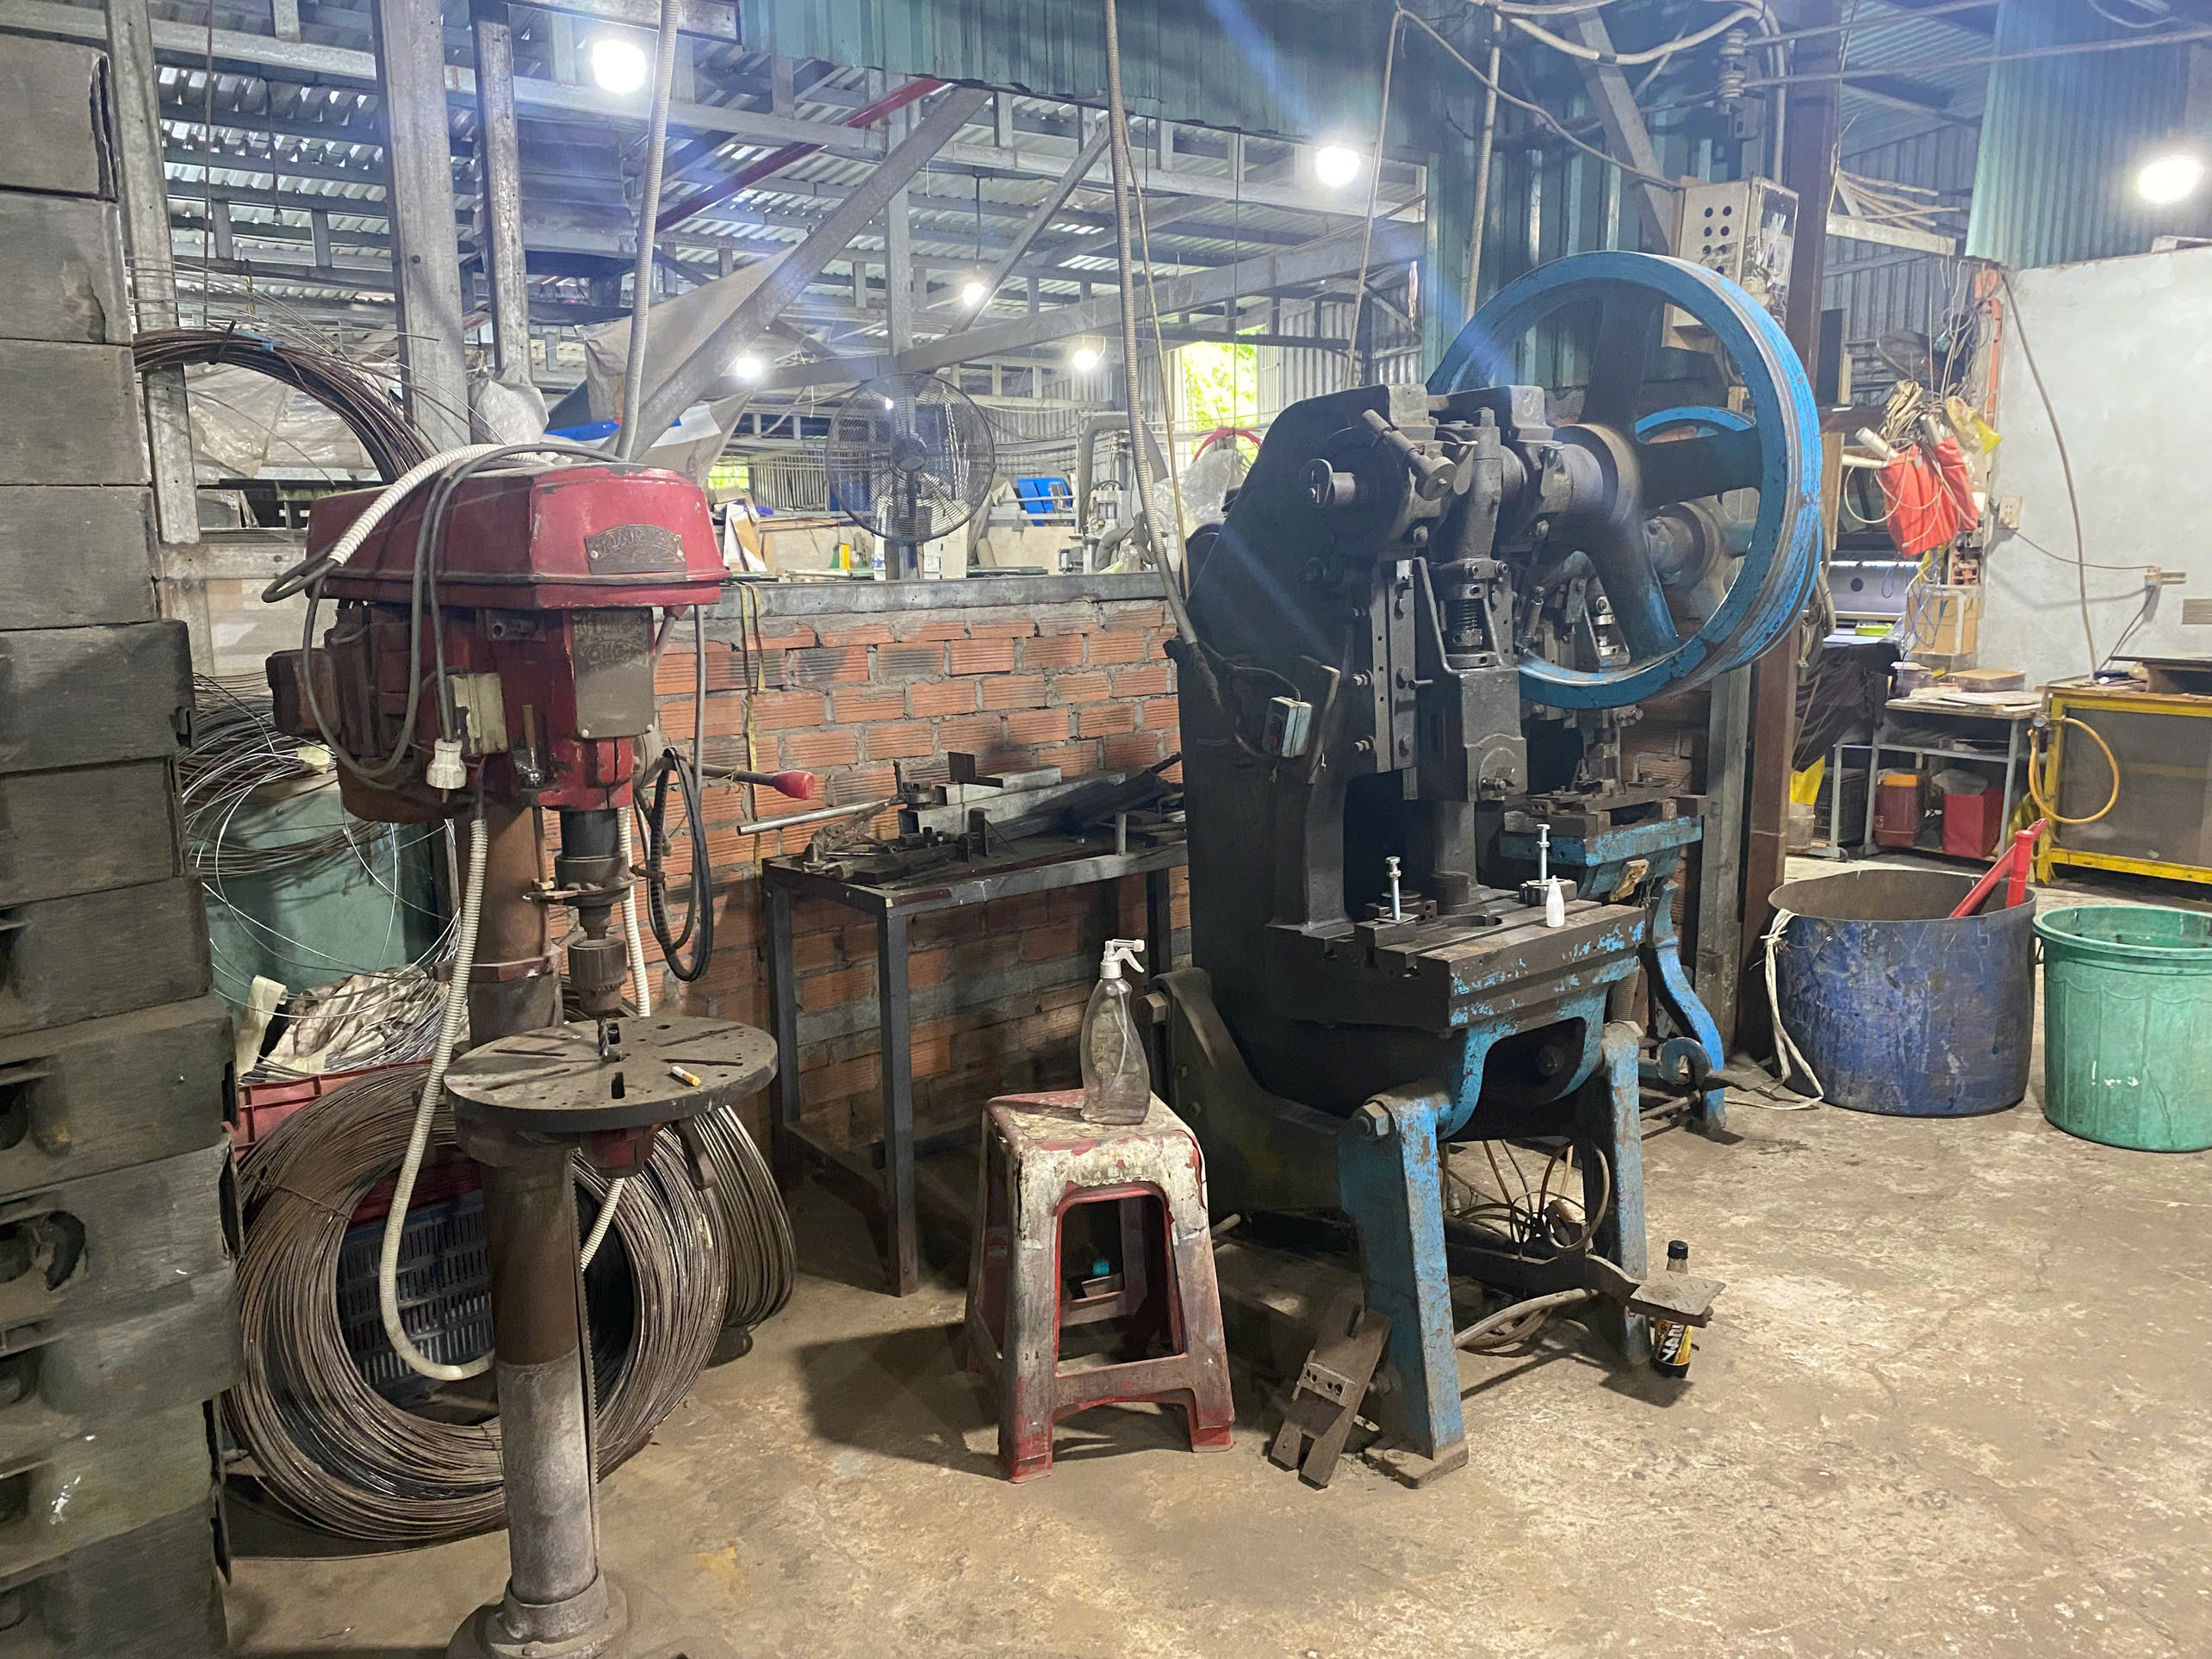
Buyers should request updated capacity reports at least annually during the strategic sourcing process, with quarterly updates for high-volume or critical parts, and immediate updates whenever the supplier adds new customers, changes shift patterns, relocates tooling, or experiences significant equipment downtime.
Setting the Right Cadence
The right frequency depends on your volume, the criticality of the part, and the volatility of your demand forecast. Here is a framework we use with our clients:
| Scenario | Recommended Frequency | Trigger for Ad-Hoc Request |
|---|---|---|
| High-volume production parts (>100K/year) | Quarterly | Any delivery miss or quality escape |
| Medium-volume parts (10K–100K/year) | Semi-annually | Supplier adds major new customer |
| Low-volume or prototype parts | Annually | Tooling transfer or press reassignment |
| Critical safety or regulatory parts | Quarterly + annual audit | Any change in shift plan or subcontractors |
| New supplier (first 12 months) | Monthly for first 3 months, then quarterly | Any discrepancy between quoted and actual lead time |
Embed It in the Supplier Quality Manual
The most effective approach is to formalize the reporting cadence in your Supplier Quality Manual 9 or supply agreement. Make it a contractual requirement — not a polite request. Specify the format, the metrics, and the deadline. When we draft supply agreements for clients, we include a clause requiring the supplier to notify us within 5 business days of any material change to their capacity allocation, shift plan, or tooling status.
Tie It to Annual Audits and RFQ Phases
Annual supplier audits are a natural checkpoint. During the audit, review the capacity report against actual delivery performance. Did the supplier meet their stated capacity? Were there unexplained misses? Use this data to inform your next year's forecast discussions and to assess whether the supplier deserves volume increases — or needs a corrective action plan.
During the RFQ phase for new parts, always request a fresh capacity report. Do not rely on data from a previous quote. Conditions change. Presses get reassigned. Tooling wears out. A current report ensures you are making sourcing decisions based on today's reality, not last year's assumptions.
Capacity as a Living Document
I think of capacity reports the same way I think of financial statements — they are snapshots in time. A report from January tells you nothing about July if the supplier has added shifts, lost a key operator, or started running a new customer's tooling on the same press. Treat capacity data as a living document. Update it regularly, cross-reference it with delivery data, and use it as a foundation for honest conversations with your supplier about what they can and cannot deliver.
Digital Twin and Simulation
A growing trend in supply chain risk assessment is the use of digital twin verification 10. Some advanced suppliers can provide simulation data showing how your projected volume fluctuations impact their current machine load. While this is not yet standard in every stamping shop, it is worth asking about — especially for high-value, high-volume programs. It gives you a forward-looking view of capacity, not just a backward-looking report.
Conclusion
Annual capacity and equipment utilization reports are not paperwork — they are your early warning system against delivery delays, quality escapes, and allocation losses in your stamping supply chain.
Frequently Asked Questions
What Information Should I Include When Requesting a Capacity Report from My Stamping Supplier?
A lesson I learned early in our supply chain work: asking a supplier "Can you make this?" is the wrong question. The right question is "Show me the data that proves you can — and what happens when demand changes."
How Can I Verify the Accuracy of a Supplier's Equipment Utilization Data?
During a recent supplier audit at a stamping facility, we noticed the utilization report showed 92% — but the shop floor told a different story. Two presses sat idle during our walkthrough. The numbers came from a spreadsheet updated weekly by a supervisor. That gap between reported data and reality is more common than you think.
Which Red Flags in Capacity Reports Signal Potential Delivery Delays?
One of our U.S. clients once received a capacity report that looked perfect on paper — high utilization, ample throughput, short lead times. Three months later, they were chasing weekly updates on late shipments. Looking back, the warning signs were there. We just did not know what to look for at the time. That experience shaped how we now review every capacity report.
Footnotes
1. Wikipedia entry defining utilization in a manufacturing and industrial context. ↩︎
2. Defines OEE metric referenced repeatedly for measuring supplier equipment utilization. ↩︎
3. Example of a corporate supplier quality manual and its requirements. ↩︎
4. Authoritative definition of OEE, a key metric for equipment productivity. ↩︎
5. Digital twin technology background supports the forward-looking capacity simulation concept mentioned. ↩︎
6. Detailed explanation of metal stamping processes and industry standards. ↩︎
7. IATF 16949 is a globally recognized automotive quality management standard referenced for compliance. ↩︎
8. Explains theoretical design capacity versus realistic capacity concept discussed in the article. ↩︎
9. ISO 9001 quality management references support formalizing supplier reporting requirements in manuals. ↩︎
10. IBM’s comprehensive guide to digital twin technology and its applications. ↩︎