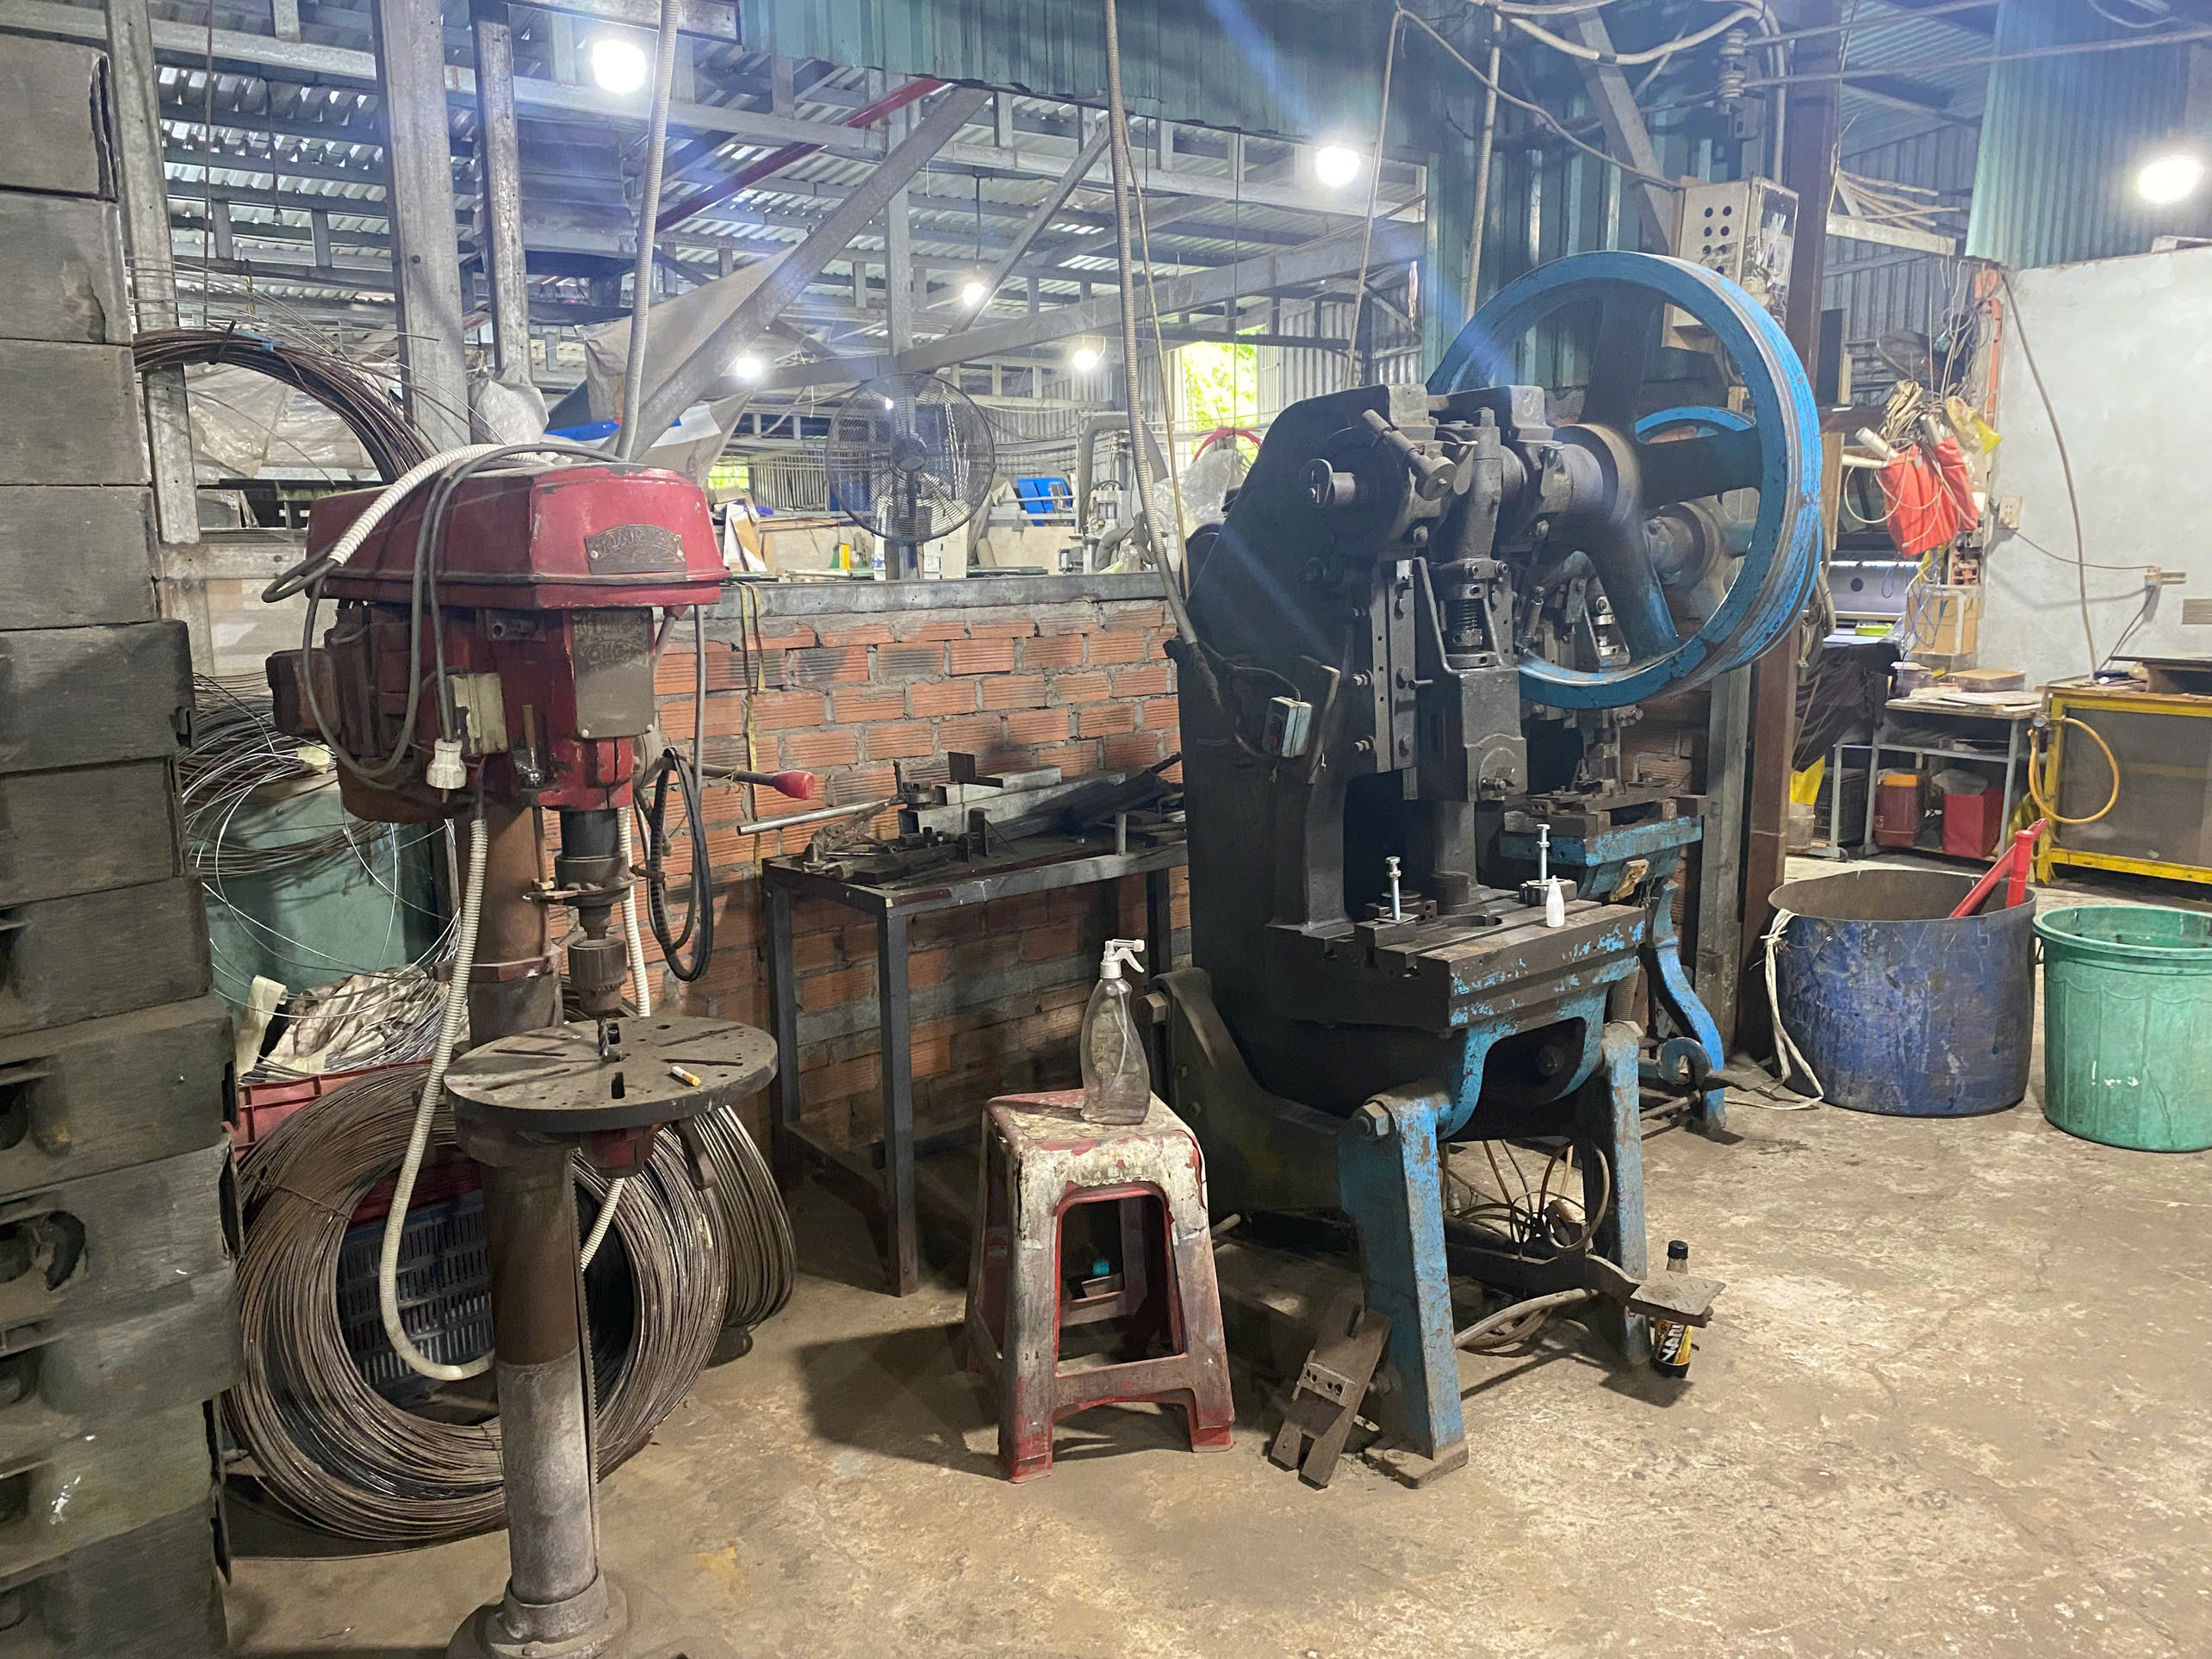
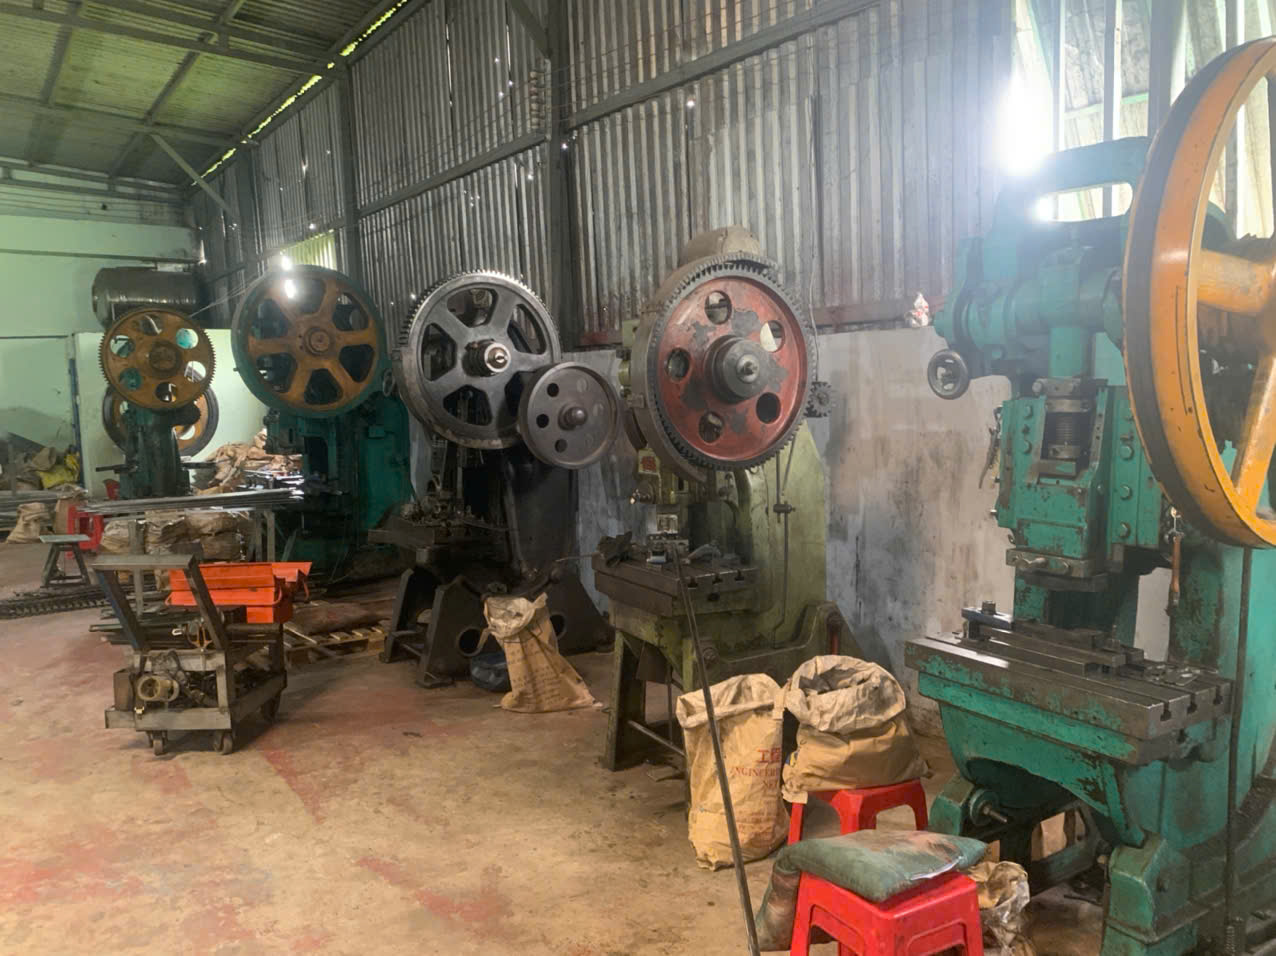
Last quarter, a vague capability request cost one of our U.S. clients three weeks of delays and a rejected shipment of stamped brackets — all because the supplier used trial-run data instead of stable production measurements.
To request Cpk and Ppk process capability reports from stamping parts suppliers, you must provide a structured checklist that specifies Critical-to-Quality dimensions, sample size requirements of at least 125 consecutive parts, target indices (Ppk ≥ 1.67 for initial runs, Cpk ≥ 1.33 for mass production), measurement protocols, and mandatory control charts with raw data.
This article walks through exactly what to include in that request, why suppliers struggle with these reports, how to verify the data, and which dimensions deserve priority. Every recommendation comes from real supply chain management experience across stamping factories in Vietnam and China.
What Should I Include in My Cpk and Ppk Request to Ensure Suppliers Understand My Requirements?
One lesson we learned early at DEWIN was that sending a one-line email — "Please provide Cpk data" — almost guarantees you will get something unusable. Suppliers interpret vague requests in the way that is easiest for them, not the way that protects your quality.
Your Cpk and Ppk request must include the drawing revision with tolerances, a list of Critical-to-Quality features, the measurement equipment and method to use, a sample plan of at least 125 consecutive parts, specific capability targets, required output formats (control charts, histograms, raw data), and a reaction plan for out-of-control conditions.
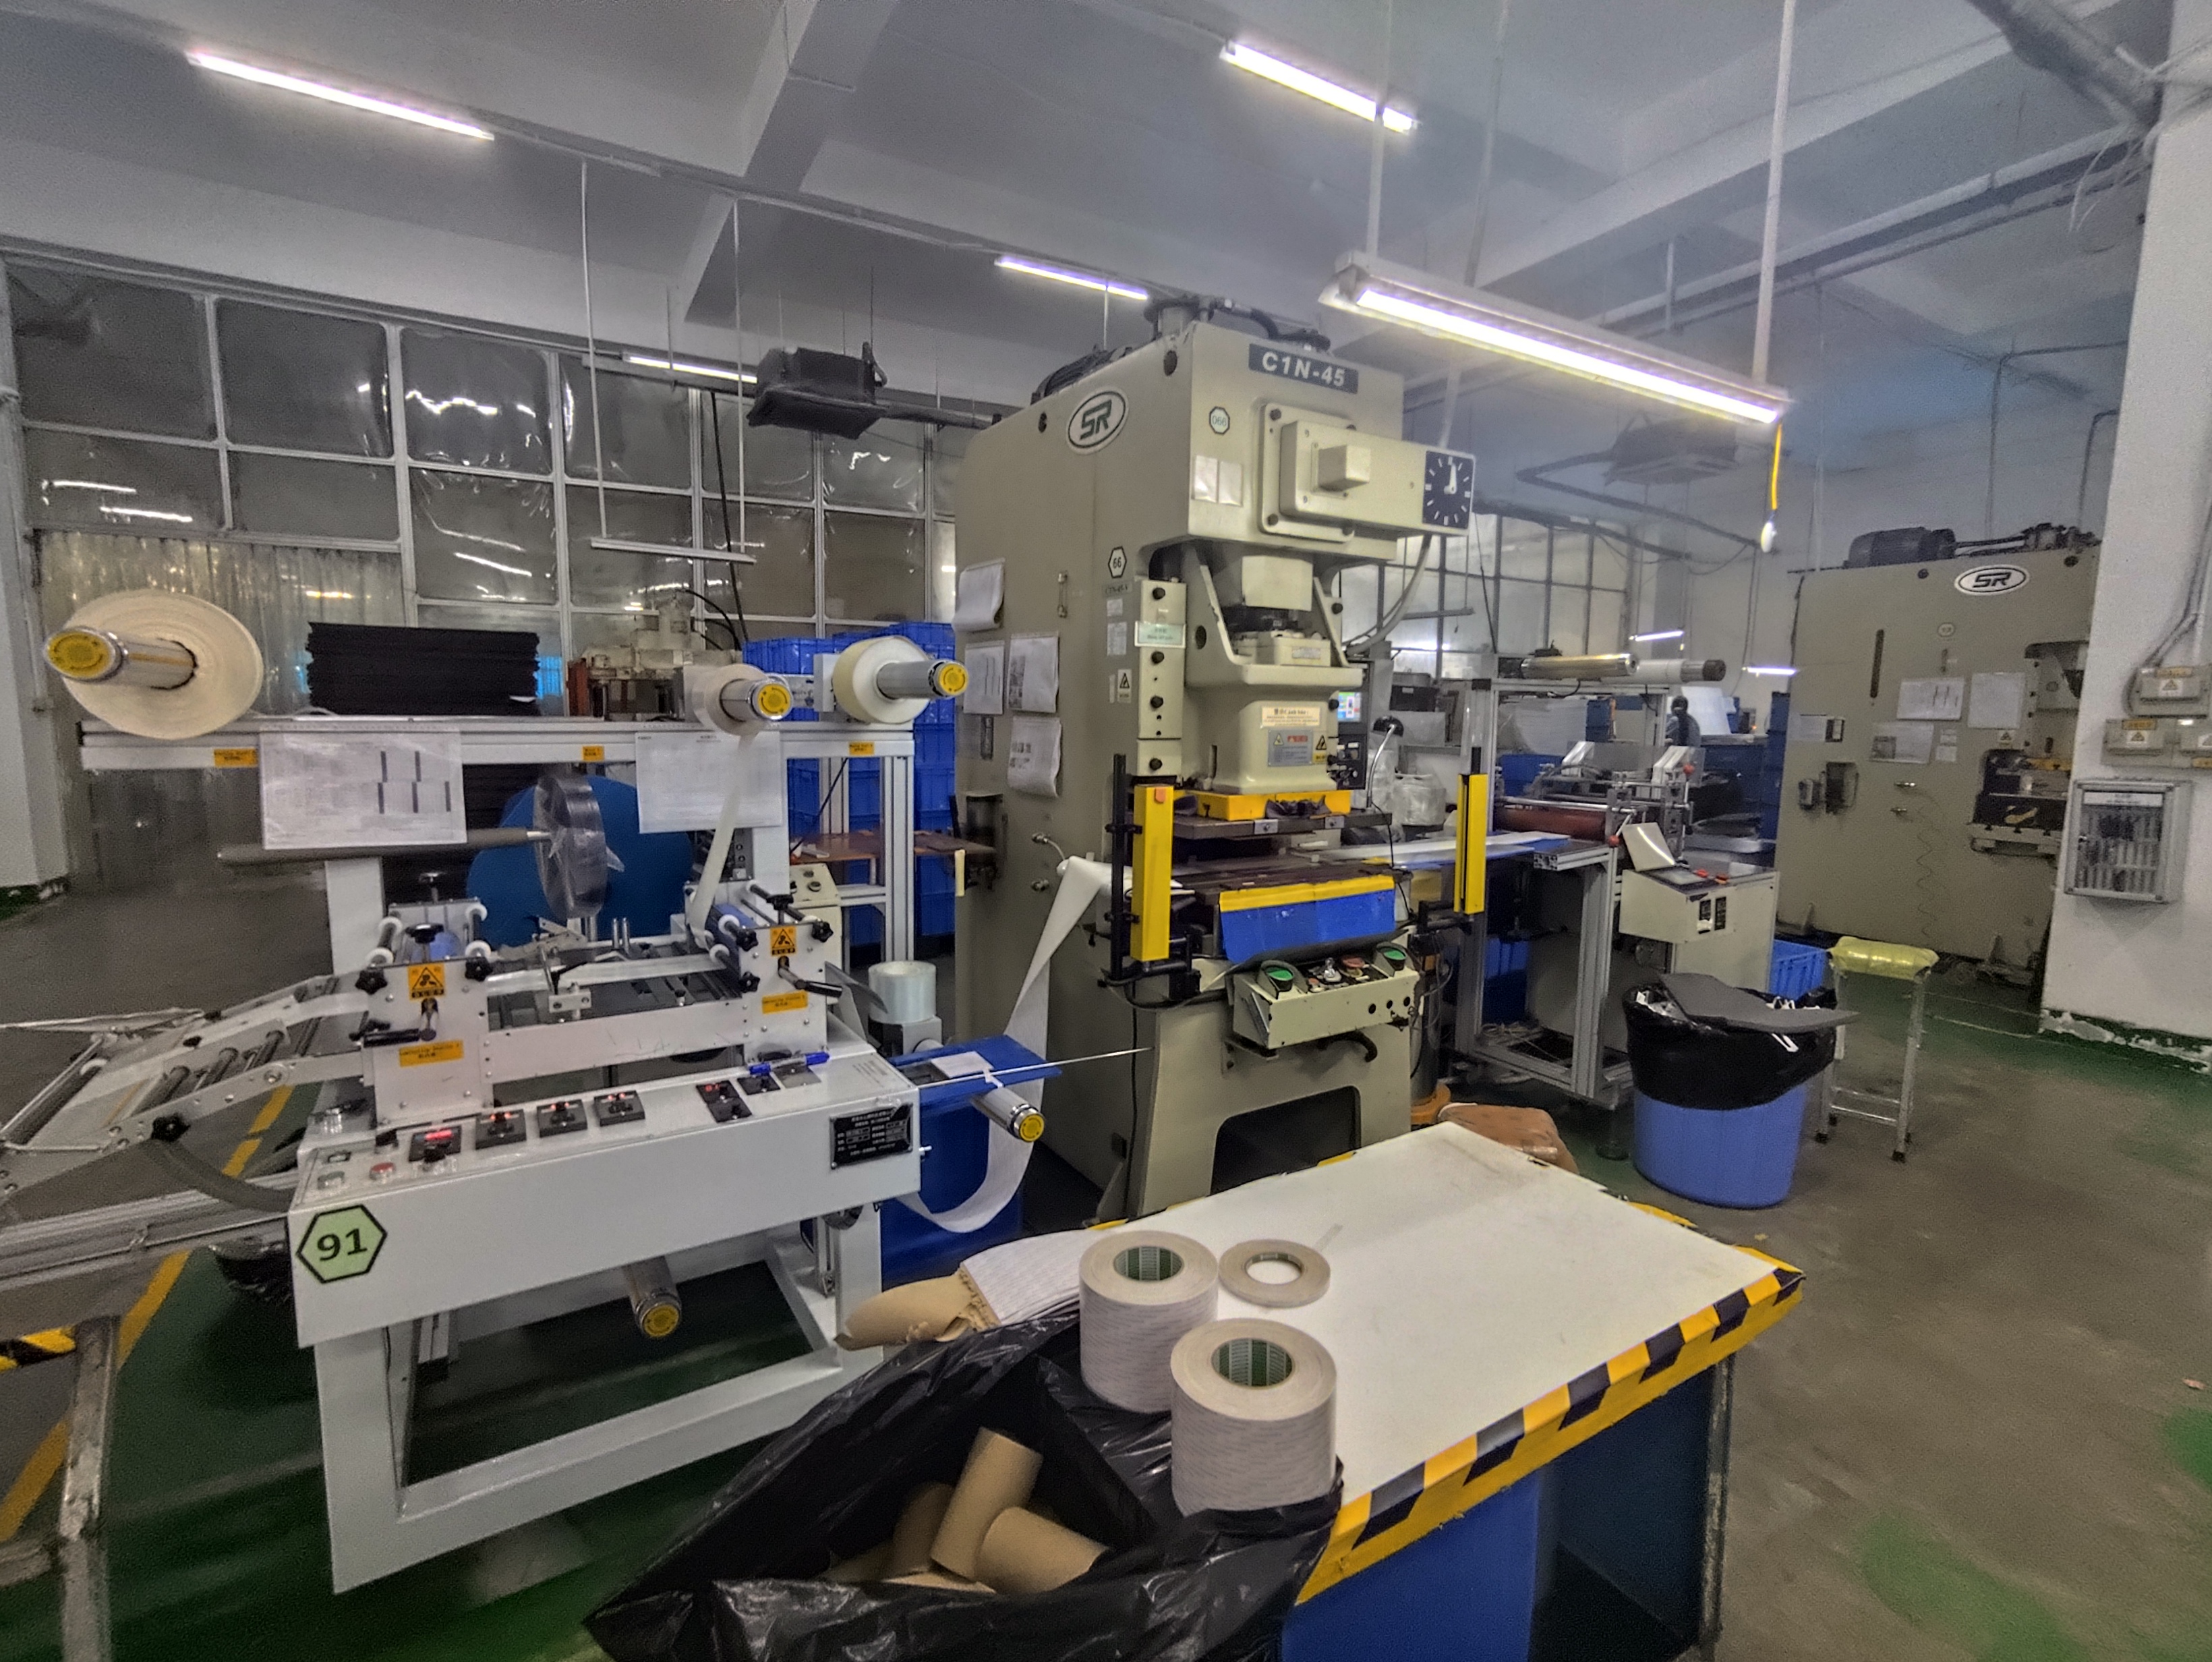
The 8-Point RFQ Checklist
A robust request eliminates ambiguity. Below is the checklist we include in every supplier quality agreement when we manage stamping projects for our clients.
| # | Item | What to Specify | Why It Matters |
|---|---|---|---|
| 1 | Drawing & Revision | Material grade, thickness, finish, process route | Prevents suppliers from using outdated specs |
| 2 | CTQ Features | List dimensions with upper and lower specification limits and datum references | Focuses SPC on features that affect fit, safety, or function |
| 3 | Measurement Protocol | Equipment type, fixture method, operator method, units | Ensures repeatability and removes gage bias |
| 4 | Sample Plan | 125 consecutive parts; subgroup size of 5; from stable production, not trial run | Provides statistical confidence |
| 5 | Capability Targets | Ppk ≥ 1.67 (initial PPAP), Cpk ≥ 1.33 (mass production) | Sets a clear pass/fail threshold |
| 6 | Required Output | X-bar/R charts, histograms, trend reports, and raw data in CSV or Excel | Allows independent verification |
| 7 | Reaction Plan | Actions for out-of-control signals, tool adjustments, or out-of-spec parts | Prevents silent failures |
| 8 | Data Retention | How long records must be kept; traceability to coil or heat number | Supports root cause analysis later |
Why a Measurement System Analysis Comes First
Before any capability study begins, the supplier's gages must be validated. We require a Measurement System Analysis — specifically a Gage R&R study 1 — as a prerequisite. The rule is simple: gage resolution must be at least 1/10th of the specification tolerance. If a hole diameter tolerance is ±0.10 mm, the measuring instrument 2 must read to 0.01 mm or better. Without this, even a perfect Cpk number is meaningless because the measurement noise drowns out the real process variation.
Specifying the Production Stage
A common conflict arises when a supplier provides capability data from a trial run where everything was manually tuned. The process looked great because an engineer stood next to the press the entire time. That is not reality. Your request must state explicitly: "Data must come from stable production at normal operating speed, with normal operators, using production tooling." This single sentence prevents a massive category of misleading reports.
Raw Data and Digital Formats
We strongly recommend requesting raw measurement data in digital formats such as CSV or Excel files. Static PDF summaries do not allow you to verify data normality, check for cherry-picked samples, or recalculate indices. When our team in Vietnam reviews supplier reports, the first thing we do is re-run the calculations from raw data. If the numbers do not match, we flag the report immediately.
Why Do My Stamping Parts Suppliers Struggle to Provide Accurate Cpk and Ppk Reports?
A buyer we work with in the Midwest once told me, "I have asked five stamping suppliers for Ppk reports, and I got five completely different formats, none of which I could use." That frustration is more common than most people realize, and it usually is not because suppliers are dishonest — it is because they lack the systems and training.
Stamping suppliers struggle with accurate Cpk and Ppk reports because many lack trained SPC personnel, use inadequate measurement systems, confuse short-term Cpk with long-term Ppk calculations, rely on insufficient sample sizes, and often submit data from manually tuned trial runs rather than stable mass production conditions.
The Knowledge Gap in Statistical Process Control
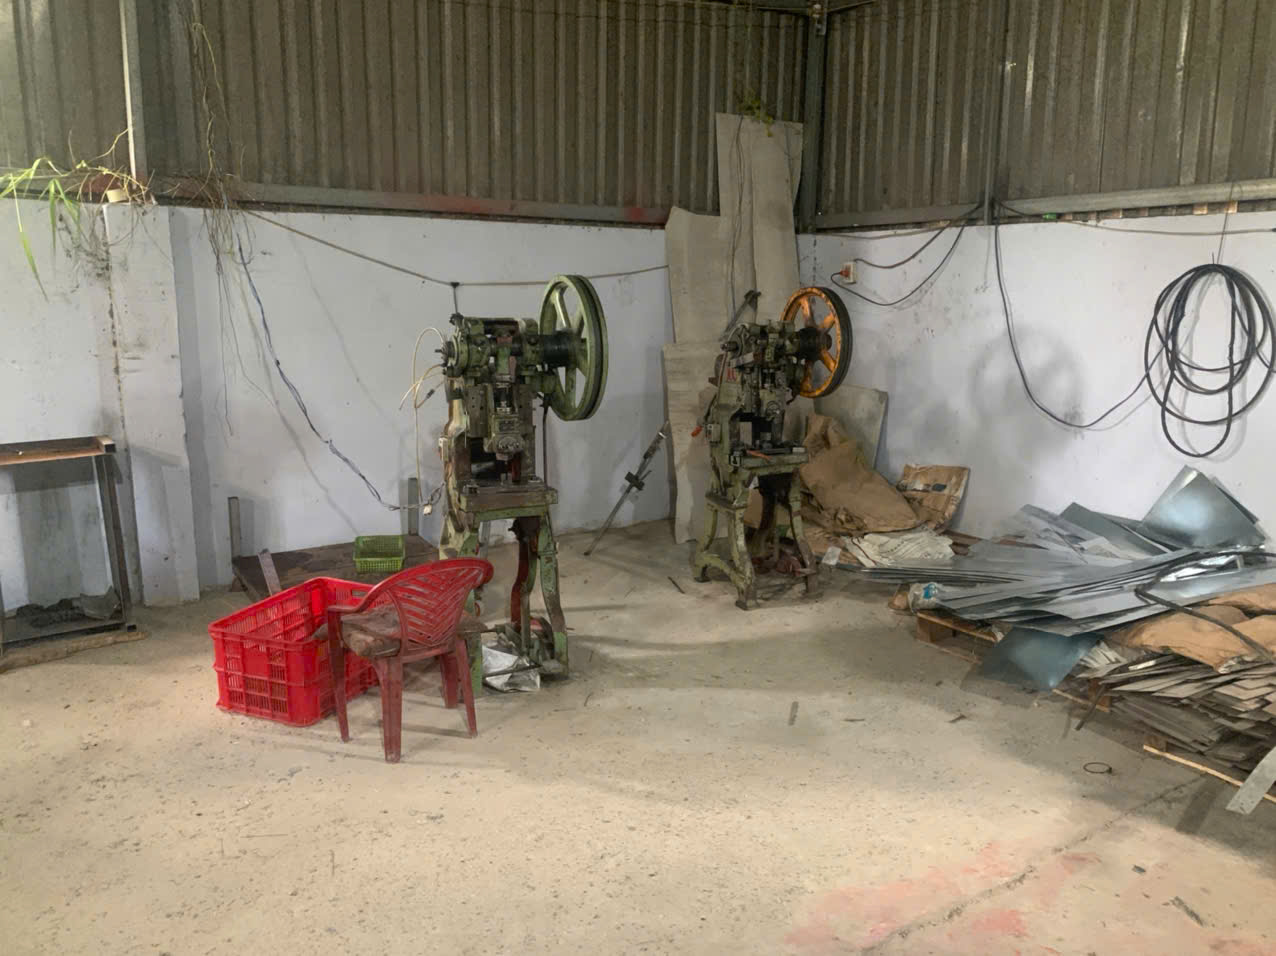
Many small to mid-size stamping shops — especially in Southeast Asia — have quality inspectors who are skilled at go/no-go checks but have never been trained in Statistical Process Control 4. They may have heard the term "Cpk" but do not understand the difference between Cp, Cpk, Pp, and Ppk. This is not a character flaw; it is a training gap. When we onboard a new supplier in Vietnam, our quality team spends time walking them through what each index means, why process stability matters before calculating capability, and how to collect data in production order.
Equipment and Gage Limitations
Another barrier is measurement equipment. A stamping shop may own a basic caliper with 0.02 mm resolution. If the tolerance on a Critical-to-Quality hole is ±0.05 mm (total tolerance of 0.10 mm), that caliper cannot meet the 1/10th-of-tolerance rule. The result is noisy data that inflates variation and produces artificially low capability indices. Or worse, the supplier rounds readings, creating artificial clusters in the histogram.
Confusing Trial Runs with Production Data
In stamping, the first 50–100 parts off a new die often look perfect. The die is sharp, the material is fresh, and the press operator is paying close attention. This is a trial run — not reality. After 10,000 hits, tool wear changes the game. Material variation between coils adds another layer. A Ppk study must capture all of these variation sources. When a supplier submits data from a tryout, the numbers look great but predict nothing about what will happen at 50,000 parts.
The Cpk vs. Ppk Confusion
Many suppliers treat Cpk and Ppk as interchangeable. They are not. Cpk measures short-term capability within subgroups. Ppk captures long-term performance including all variation — shift changes, coil changes, tool wear, and environmental factors. For a Production Part Approval Process submission, Ppk is typically the required metric because it reflects real-world conditions. For ongoing monitoring during mass production, Cpk is used to check within-subgroup consistency. A large gap between Cpk and Ppk signals inter-group variation that needs investigation.
| Issue | Root Cause | Impact on Report |
|---|---|---|
| Untrained personnel | No SPC education | Wrong formulas, misinterpreted results |
| Poor gage resolution | Inadequate measurement equipment | Noisy data, artificially low indices |
| Trial-run data | No stable production baseline | Overly optimistic Ppk values |
| Cpk/Ppk confusion | Lack of statistical literacy | Wrong index reported for the context |
| Small sample size | Cost/time pressure | Statistically invalid conclusions |
| No control charts | No understanding of process stability | Capability calculated on unstable process |
How Can I Verify That the Cpk and Ppk Data From My Suppliers Is Reliable and Not Fabricated?
During a supplier audit at a stamping factory near Ho Chi Minh City, our quality engineer asked to see the raw data behind a Ppk report that showed a perfect 2.10 index. The supplier hesitated. When we finally got the spreadsheet, the data had 30 measurements — not 125 — and every value was suspiciously close to the nominal. That report went straight into the reject pile.
To verify supplier Cpk and Ppk data, request raw measurement data in digital format, recalculate the indices independently, check histograms for abnormal distribution patterns, confirm that control charts show process stability, validate the sample size is at least 125 consecutive parts, and cross-reference data against the production log and coil traceability records.
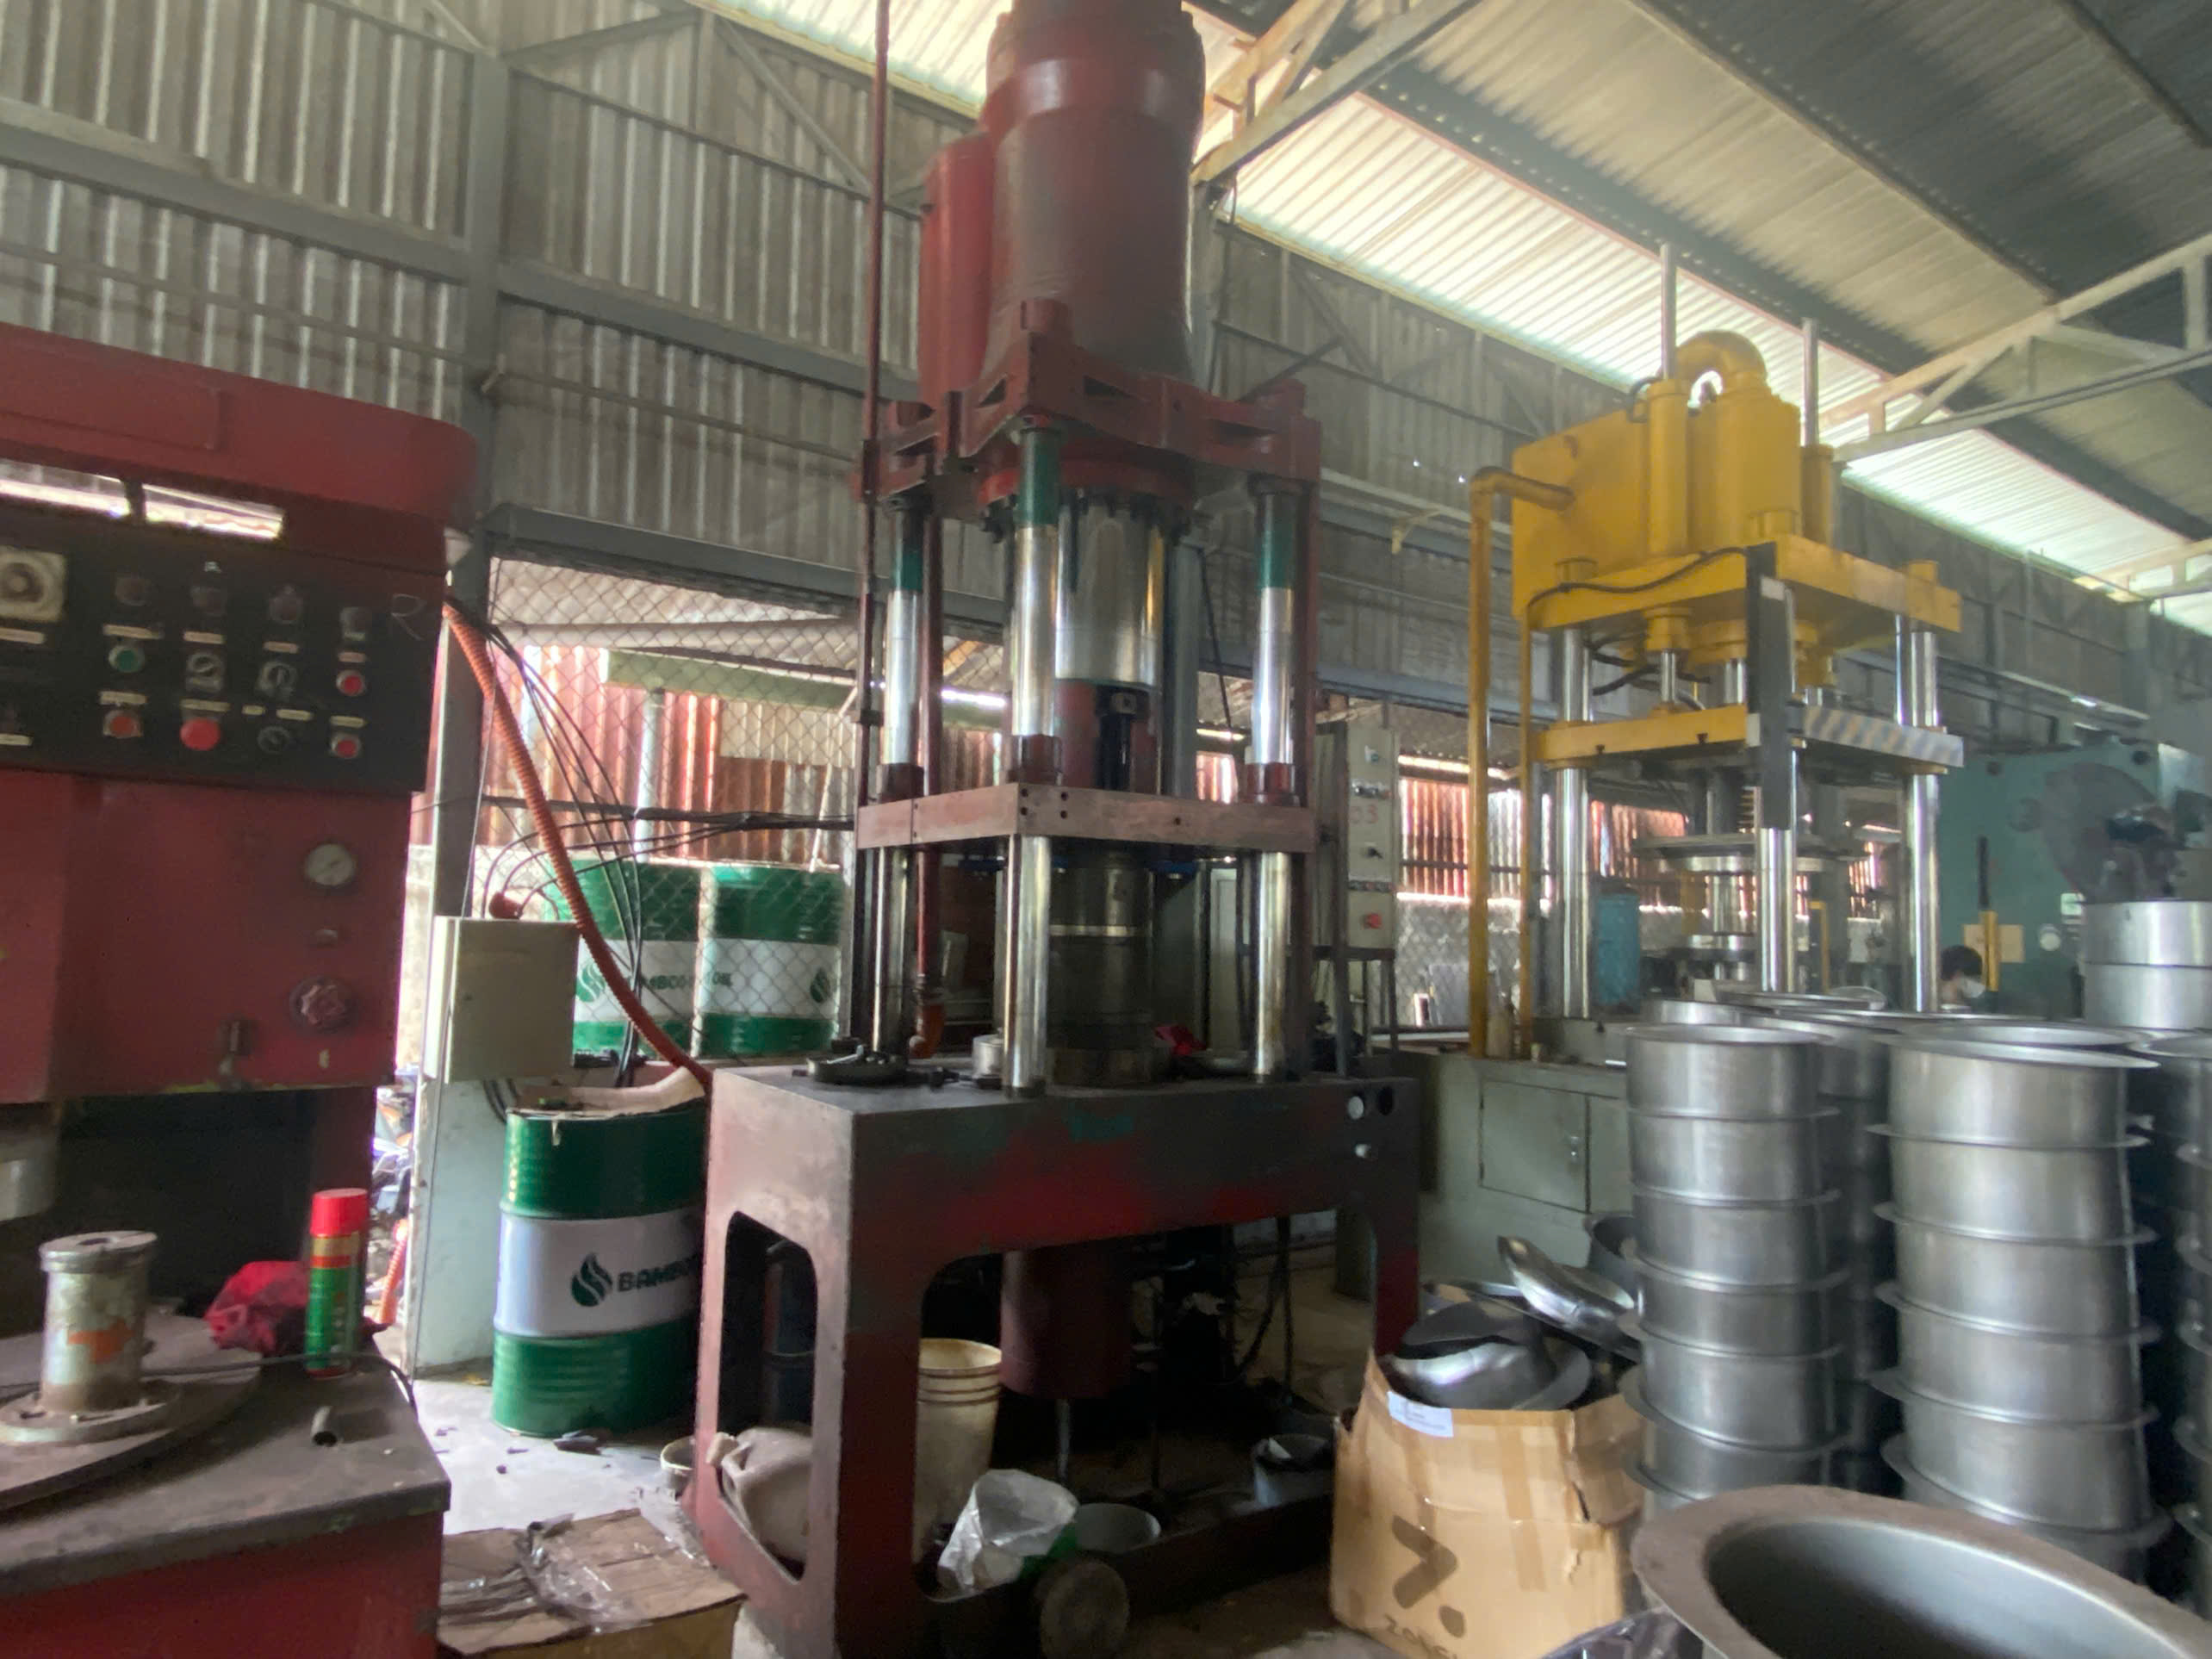
Step 1: Demand Raw Data, Not Just Summary Numbers
A supplier who provides only a Cpk value on a dimensional inspection report — with no supporting data — is giving you a number you cannot trust. Always request the raw measurements in a spreadsheet. This lets you check the math, assess normality, and look for patterns that indicate tampering.
Step 2: Recalculate Independently
Open the raw data. Calculate the mean, standard deviation 5, and capability indices yourself. Compare your results to the supplier's submitted values. If they do not match, ask why. Common errors include using the wrong sigma estimate (sample standard deviation vs. within-subgroup standard deviation) or using the wrong specification limits.
Step 3: Inspect the Histogram
A legitimate histogram from 125 stamped parts should show a roughly bell-shaped distribution. Watch for these red flags:
- Cliff edges at specification limits: This suggests the supplier screened out-of-spec parts and only measured the good ones.
- Bimodal distribution: Two peaks may indicate data from two different dies, two different coils, or two different setups mixed together.
- Perfectly uniform distribution: Real production data is never perfectly flat. This pattern suggests fabricated numbers.
- Too-tight clustering: If every measurement is within 0.01 mm of the nominal on a ±0.10 mm tolerance, the data may have been rounded or invented.
Step 4: Check the Control Charts
Control charts are the backbone of process stability verification. X-bar and R charts should show random variation within control limits. Look for runs (seven or more points on one side of the centerline), trends (seven consecutive rising or falling points), or points outside control limits. If these patterns exist, the process was not stable, and any Cpk calculation from that data is invalid.
Step 5: Cross-Reference with Production Records
Ask for the production log that corresponds to the capability study. What date and shift were the parts made? What coil or heat number was used? Who was the operator? What were the press parameters? If the supplier cannot provide this traceability linking data to man, machine, method, material, measurement, and environment, the report lacks the context needed for IATF 16949 standards compliance.
Step 6: Request Confidence Intervals
A Cpk of 1.35 from 125 parts has a confidence interval. The true capability could be lower. Ask the supplier to report confidence intervals 6 alongside point estimates. This practice is becoming standard in modern quality management and helps you understand the reliability of the estimate itself.
Verification Audit Checklist
| Check Item | What to Look For | Action If Failed |
|---|---|---|
| Raw data provided | CSV or Excel with all individual measurements | Reject the report; request raw data |
| Sample size ≥ 125 | Count the rows in the data file | Reject; require full study |
| Data in production order | Sequential numbering, timestamps | Flag as non-compliant |
| Histogram shape | Bell-shaped, no cliff edges or bimodal peaks | Investigate root cause with supplier |
| Control chart stability | No runs, trends, or out-of-control points | Capability indices are invalid; require corrective action |
| Coil/heat traceability | Production log matches data timestamps | Require traceability documentation |
| Gage calibration | Current calibration certificate for the measurement tool | Halt study; recalibrate first |
| Independent recalculation | Your Cpk matches supplier's within ±0.05 | Investigate discrepancy |
Which Critical Dimensions Should I Prioritize When Asking for Cpk and Ppk Reports on Stamped Parts?
When we start a new stamping project — say a powder-coated L-bracket with multiple mounting holes — the engineering drawing might have 25 or more dimensions. Asking for capability studies on every single one is impractical and expensive. The key is knowing which dimensions truly matter and focusing your Statistical Process Control resources there.
Prioritize dimensions that affect fit, assembly, safety, or function — specifically hole positions and diameters for bolted joints, critical bend angles, flatness of mating surfaces, and any feature identified as a Special Characteristic on the control plan. These are the Critical-to-Quality features most sensitive to tool wear and process drift in stamping.
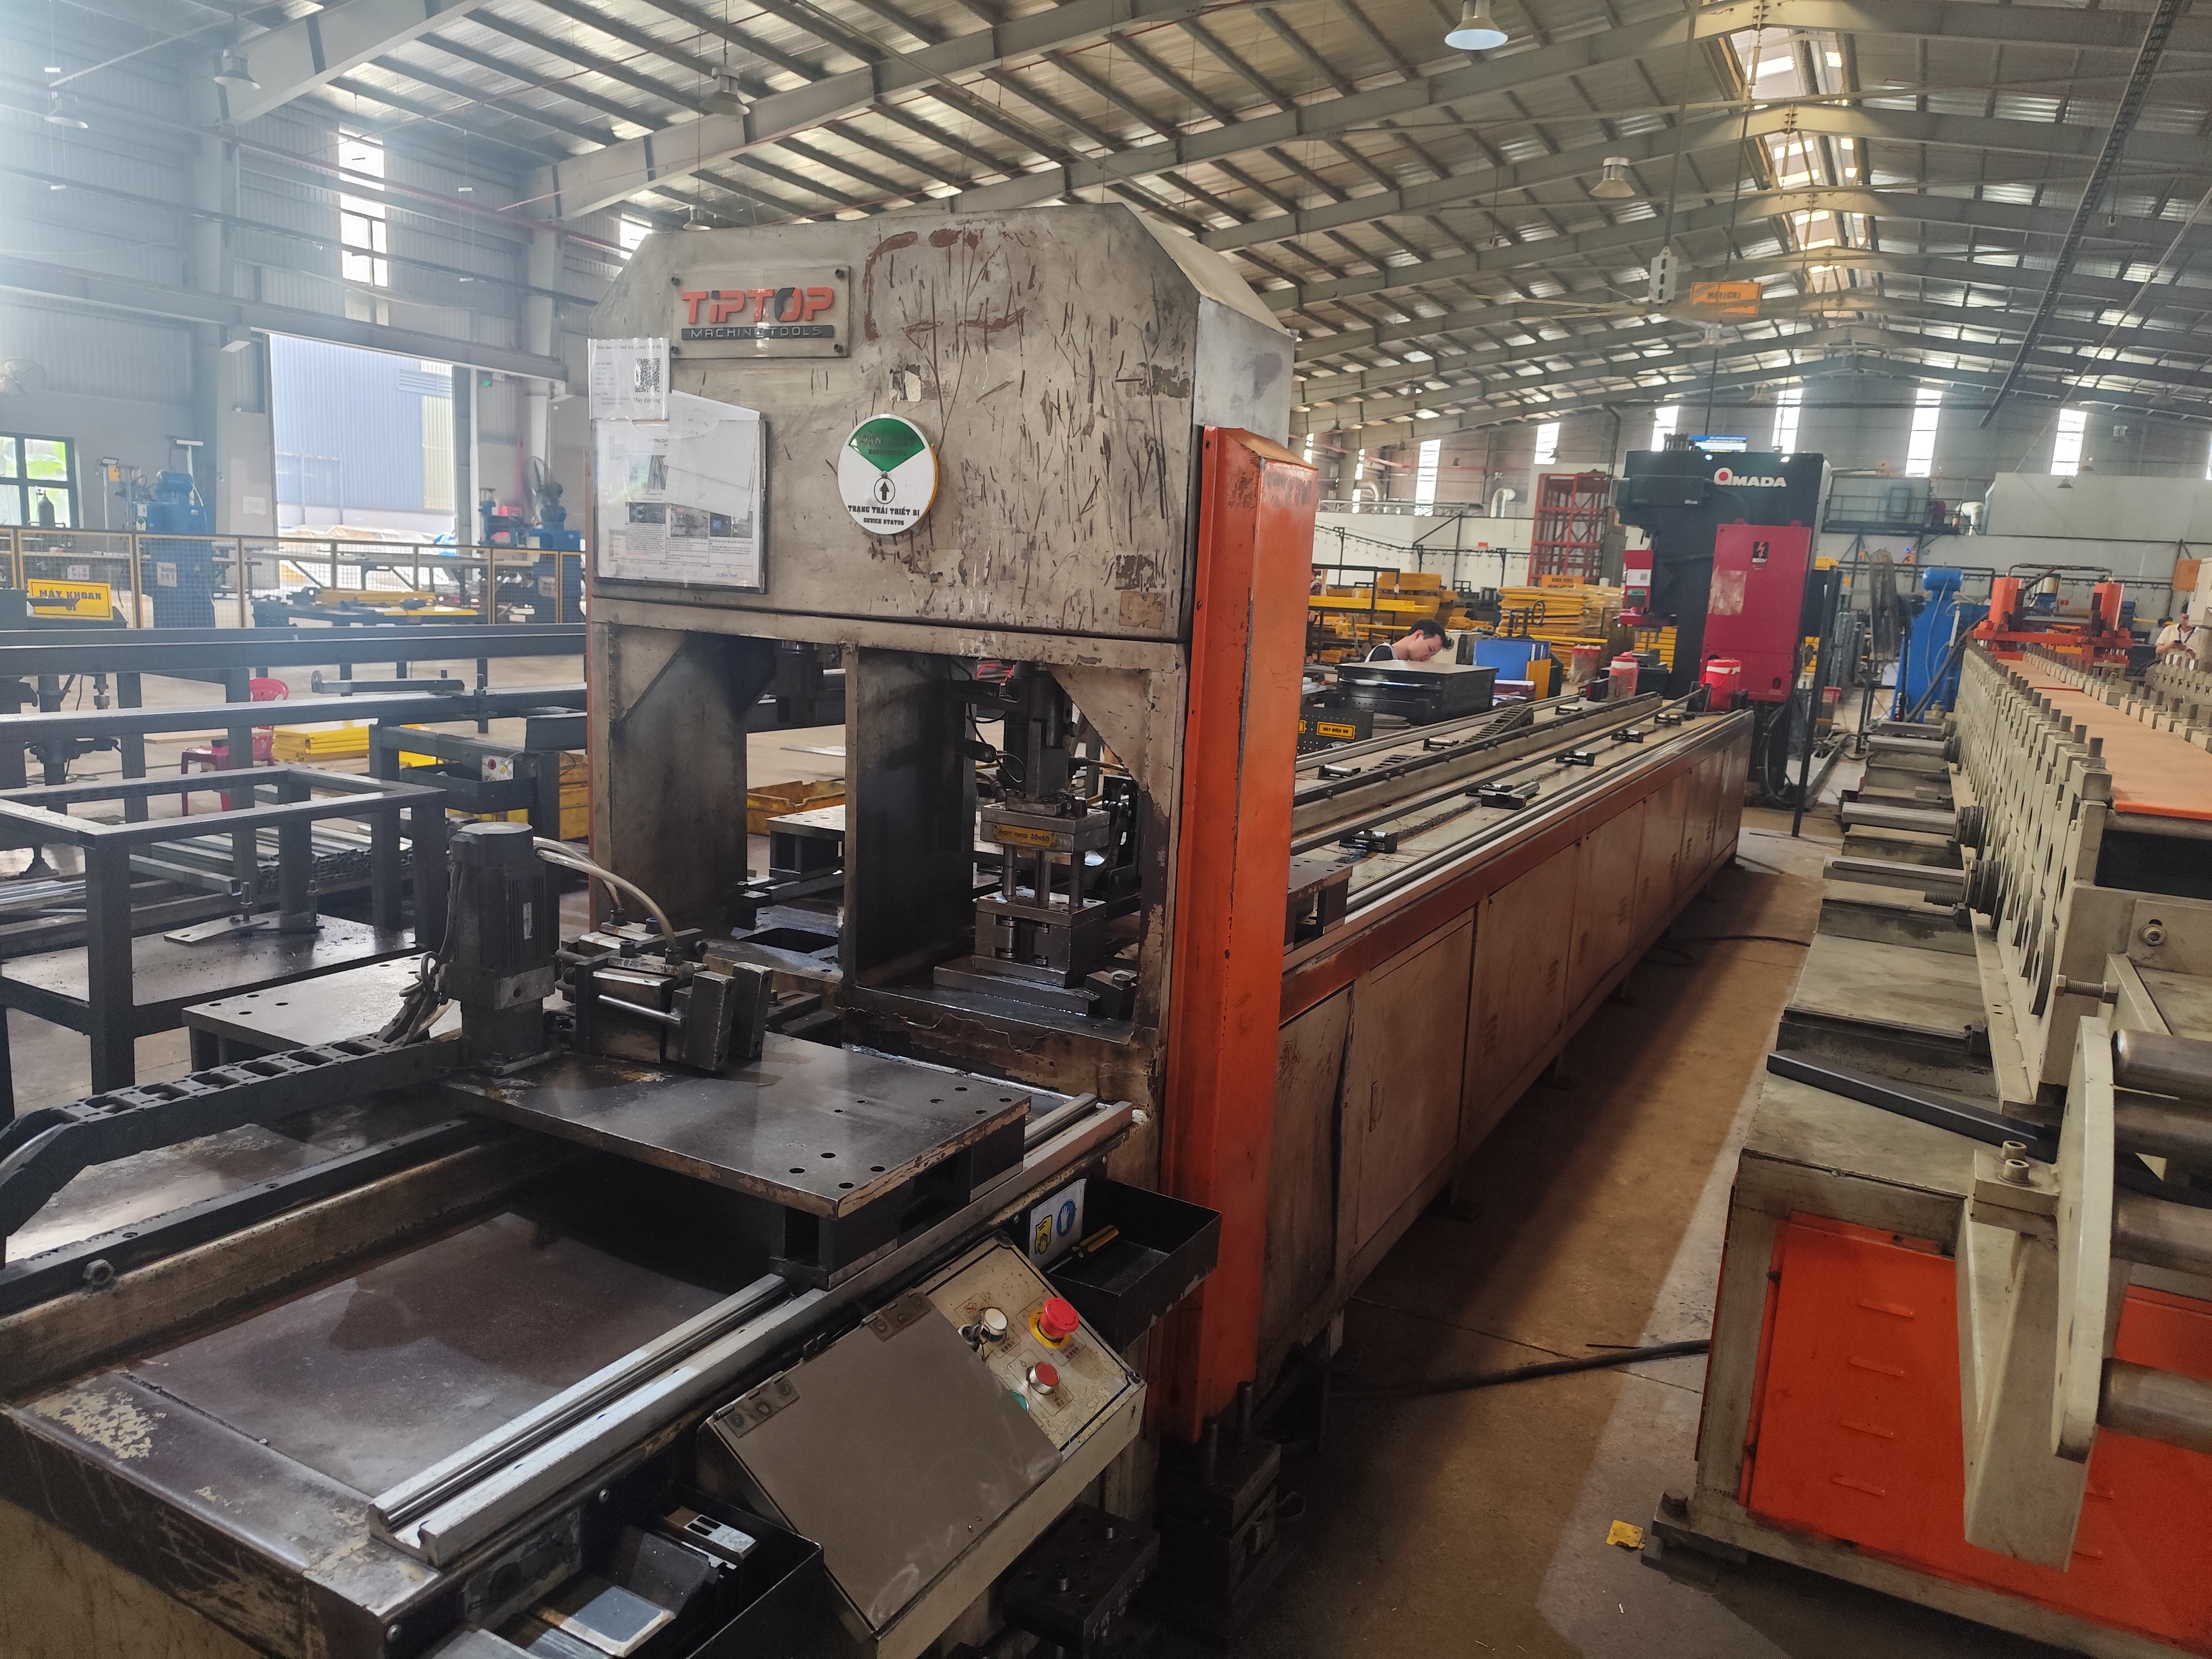
Understanding What Makes a Dimension "Critical"
Not all dimensions on a stamped part carry the same risk. A flange width that has a generous ±1.0 mm tolerance and no mating function is low risk. A hole-to-hole distance that must align with a threaded insert on a mating part within ±0.15 mm is high risk. The second dimension deserves a capability study. The first probably does not.
In our experience coordinating PPAP submissions for U.S. clients, we classify dimensions into three tiers:
- Tier 1 — Safety/Regulatory: Any dimension tied to structural integrity, electrical clearance, or regulatory compliance. These always require Ppk ≥ 1.67 at initial approval.
- Tier 2 — Fit/Function: Hole positions, bend angles, and mating surface flatness that directly affect assembly. These require Cpk ≥ 1.33 during mass production.
- Tier 3 — Cosmetic/Non-Critical: Edge radii, surface finish appearance zones, and dimensions with wide tolerances. These are monitored by standard inspection, not SPC.
Stamping-Specific Features That Drift
Metal stamping has unique failure modes. Certain features are more prone to variation than others due to tool wear, material springback 7, and press dynamics.
Hole diameters and positions shift as the punch wears. After thousands of hits, a punch that originally produced a 6.00 mm hole may produce 6.05 mm or larger. This is why hole-related dimensions are almost always on the Critical-to-Quality list for stamped brackets and mounting hardware.
Bend angles are sensitive to material thickness variation and springback. If the incoming steel coil is 1.52 mm instead of the nominal 1.50 mm, the bend angle changes. A 90° bend might come out at 89° or 91°. For L-brackets and channel brackets, this directly affects fit.
Flatness of base plates matters when the part is bolted to a surface. A warped base plate on a post anchor or mounting bracket creates gaps, reduces clamping force, and can lead to field failures. Flatness is often overlooked in capability studies but should be included for any mating surface.
Edge-to-hole distances are critical for structural integrity. If the hole is too close to the edge, the material between them can crack under load. This dimension is driven by the strip layout in the progressive die 8 and can shift if the coil feeds inconsistently.
End-of-Run Capability: A Hidden Priority
Here is something many buyers miss: process capability at the start of a production run is almost always better than at the end. Tool wear is progressive. By the time the die has completed a full run — perhaps 50,000 or 100,000 hits — the critical dimensions may have drifted significantly. We recommend establishing end-of-run capability reporting requirements for Tier 1 and Tier 2 dimensions. This captures the worst-case scenario and tells you whether the die maintenance interval is appropriate.
Indexing Reports by Material Batch
For stamped parts, raw material properties — yield strength, tensile strength 9, thickness — vary between coils. A coil of SPCC steel from one mill may behave differently from another. We ask our suppliers to index capability reports by material heat or coil number. This practice reveals whether dimensional shifts correlate with material changes, which is invaluable for root cause analysis.
Conclusion
Requesting Cpk and Ppk process capability reports from stamping suppliers requires precision, structure, and verification. Define your CTQ features, mandate 125-part samples, require raw data with control charts, and always validate independently before accepting any report. Complement your capability requirements with a robust control plan from your suppliers to ensure consistent mass production and well-defined quality standards in your contracts to set clear acceptance criteria.
Frequently Asked Questions
What Should I Include in My Cpk and Ppk Request to Ensure Suppliers Understand My Requirements?
One lesson we learned early at DEWIN was that sending a one-line email — "Please provide Cpk data" — almost guarantees you will get something unusable. Suppliers interpret vague requests in the way that is easiest for them, not the way that protects your quality.
Why Do My Stamping Parts Suppliers Struggle to Provide Accurate Cpk and Ppk Reports?
A buyer we work with in the Midwest once told me, "I have asked five stamping suppliers for Ppk reports, and I got five completely different formats, none of which I could use." That frustration is more common than most people realize, and it usually is not because suppliers are dishonest — it is because they lack the systems and training.
How Can I Verify That the Cpk and Ppk Data From My Suppliers Is Reliable and Not Fabricated?
During a supplier audit at a stamping factory near Ho Chi Minh City, our quality engineer asked to see the raw data behind a Ppk report that showed a perfect 2.10 index. The supplier hesitated. When we finally got the spreadsheet, the data had 30 measurements — not 125 — and every value was suspiciously close to the nominal. That report went straight into the reject pile.
Footnotes
1. Authoritative Wikipedia entry explaining measurement system analysis and Gage R&R methodology. ↩︎
2. General reference for the types and precision of instruments used in metrology. ↩︎
3. Detailed Wikipedia overview of process capability indices and statistical process control. ↩︎
4. Overview of SPC principles and their application in manufacturing quality control. ↩︎
5. Comprehensive Wikipedia article defining standard deviation and its statistical significance. ↩︎
6. Technical explanation of confidence intervals for process capability indices from NIST. ↩︎
7. Technical Wikipedia page describing the springback phenomenon in metal forming and manufacturing. ↩︎
8. Wikipedia entry detailing the progressive stamping process and die design. ↩︎
9. Scientific Wikipedia entry defining tensile strength and material deformation properties. ↩︎
10. Definition of CTQ features in quality management and process improvement. ↩︎