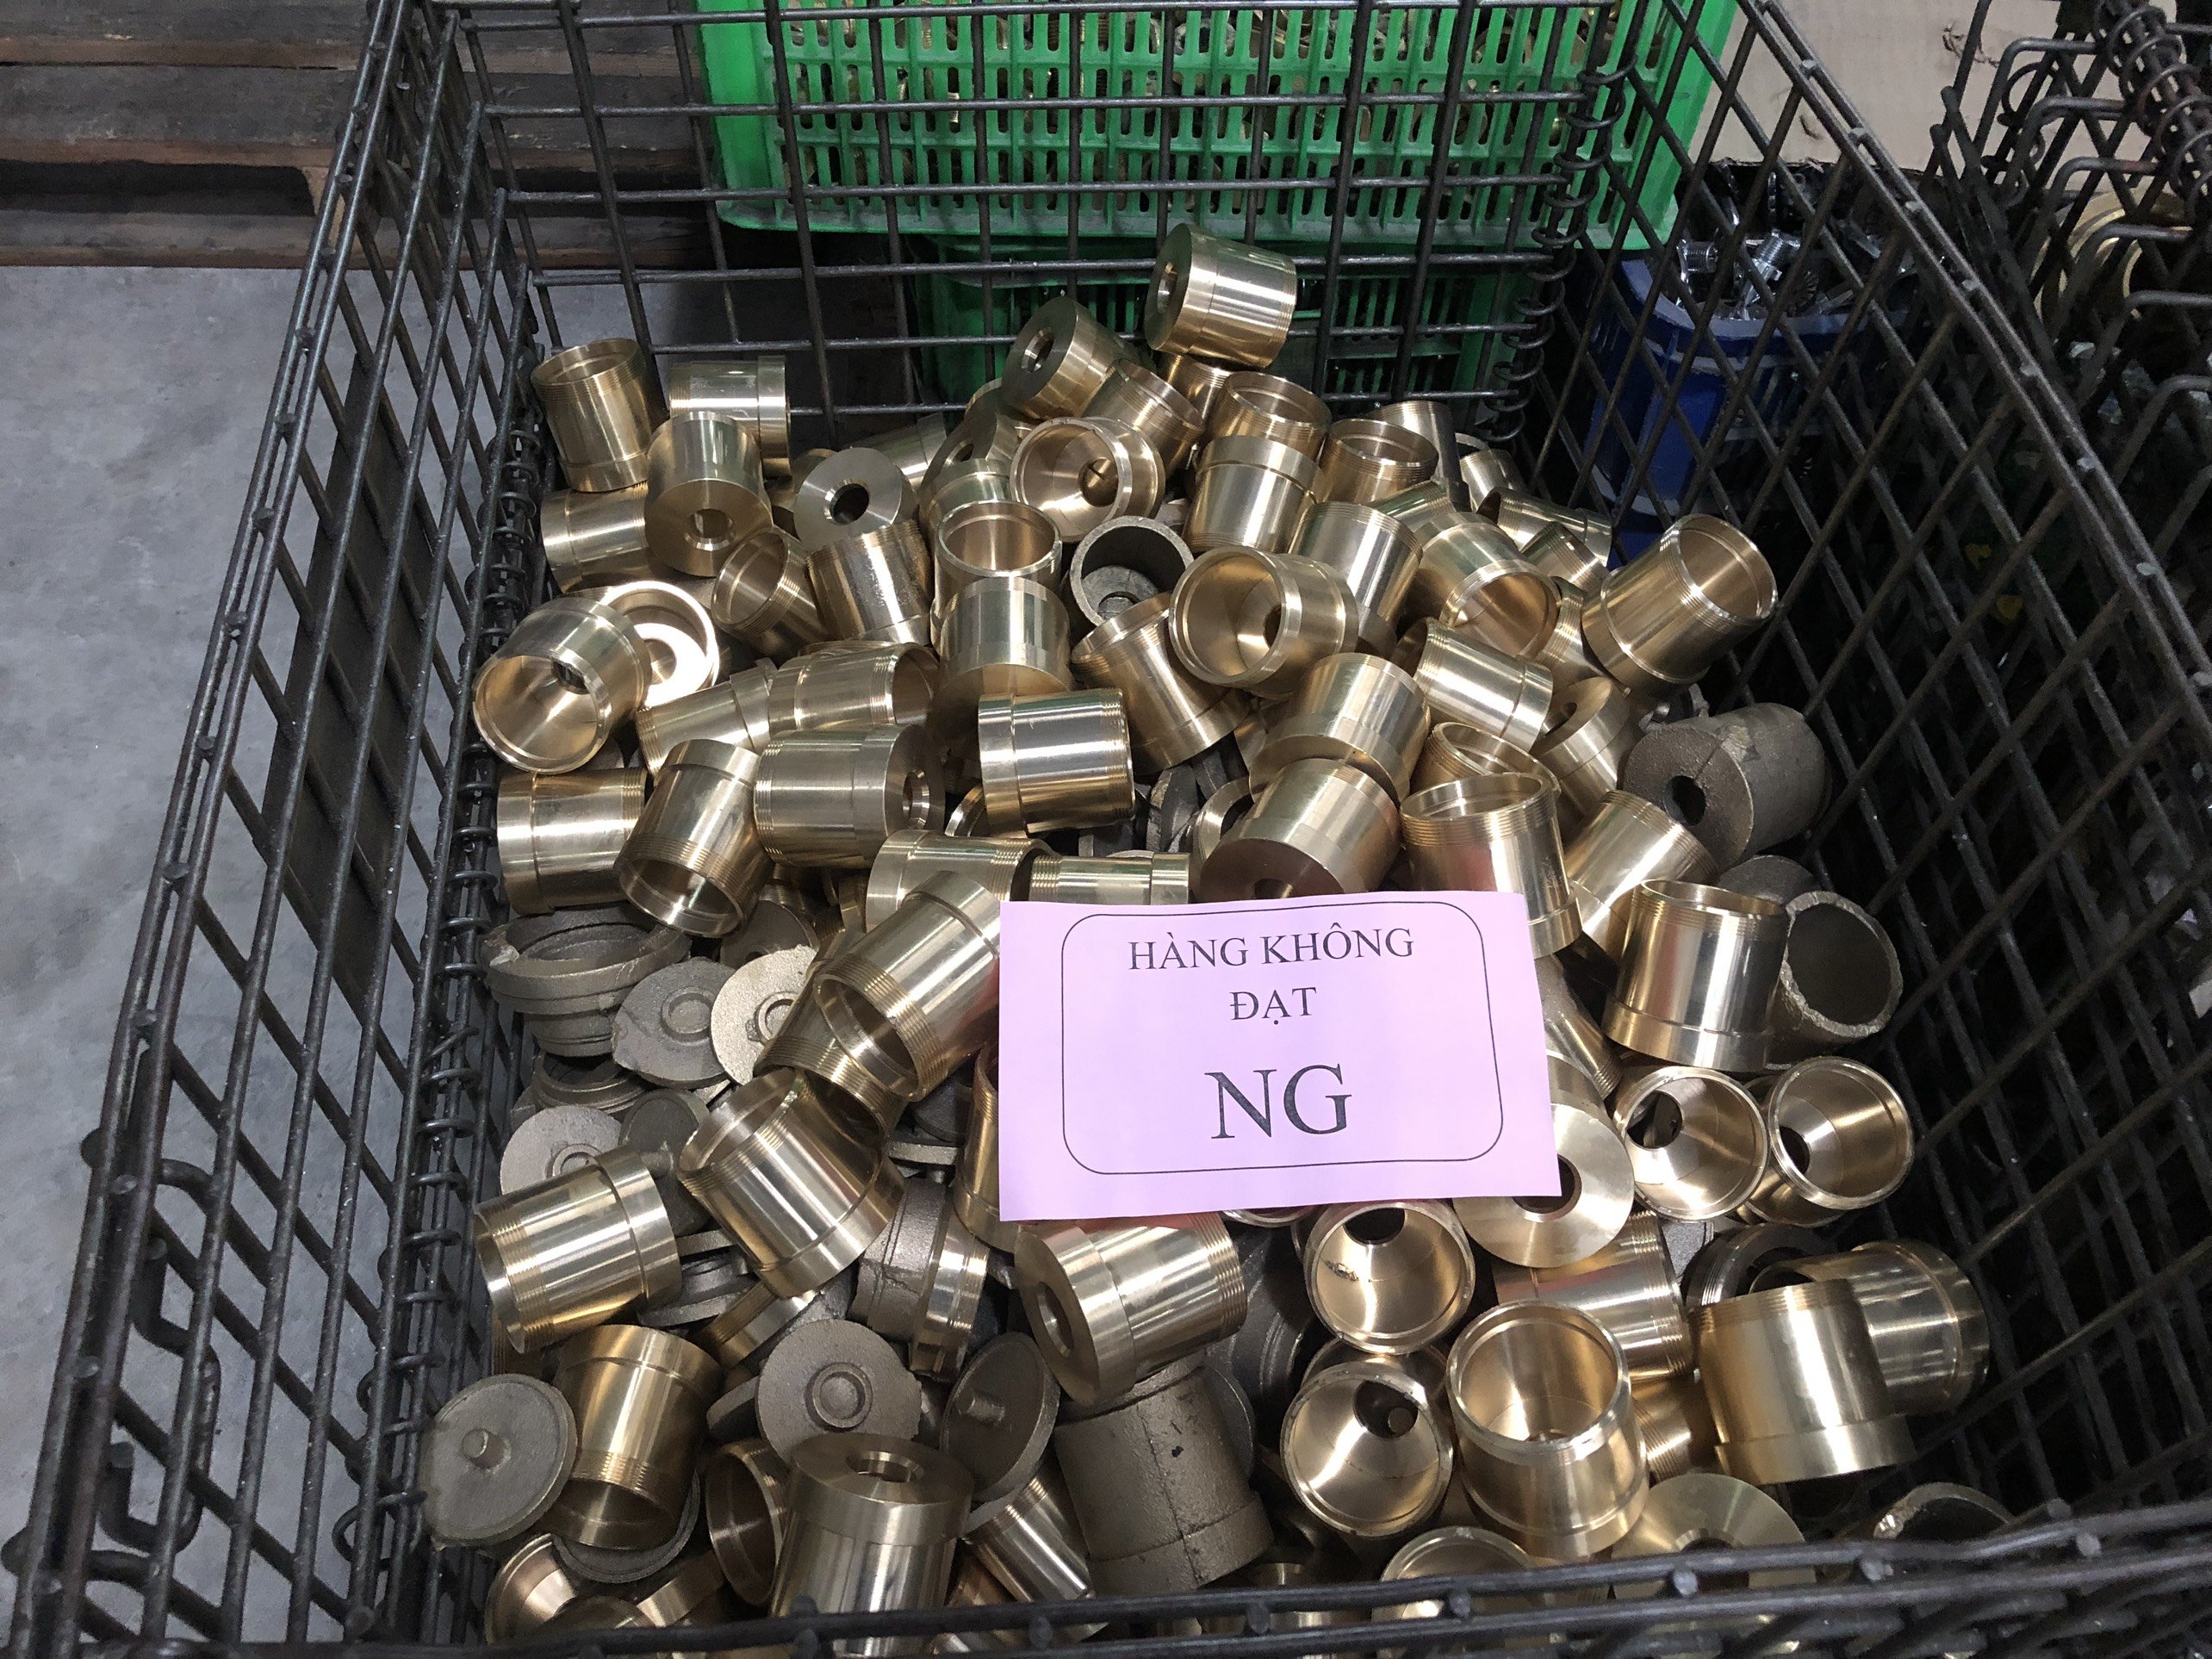
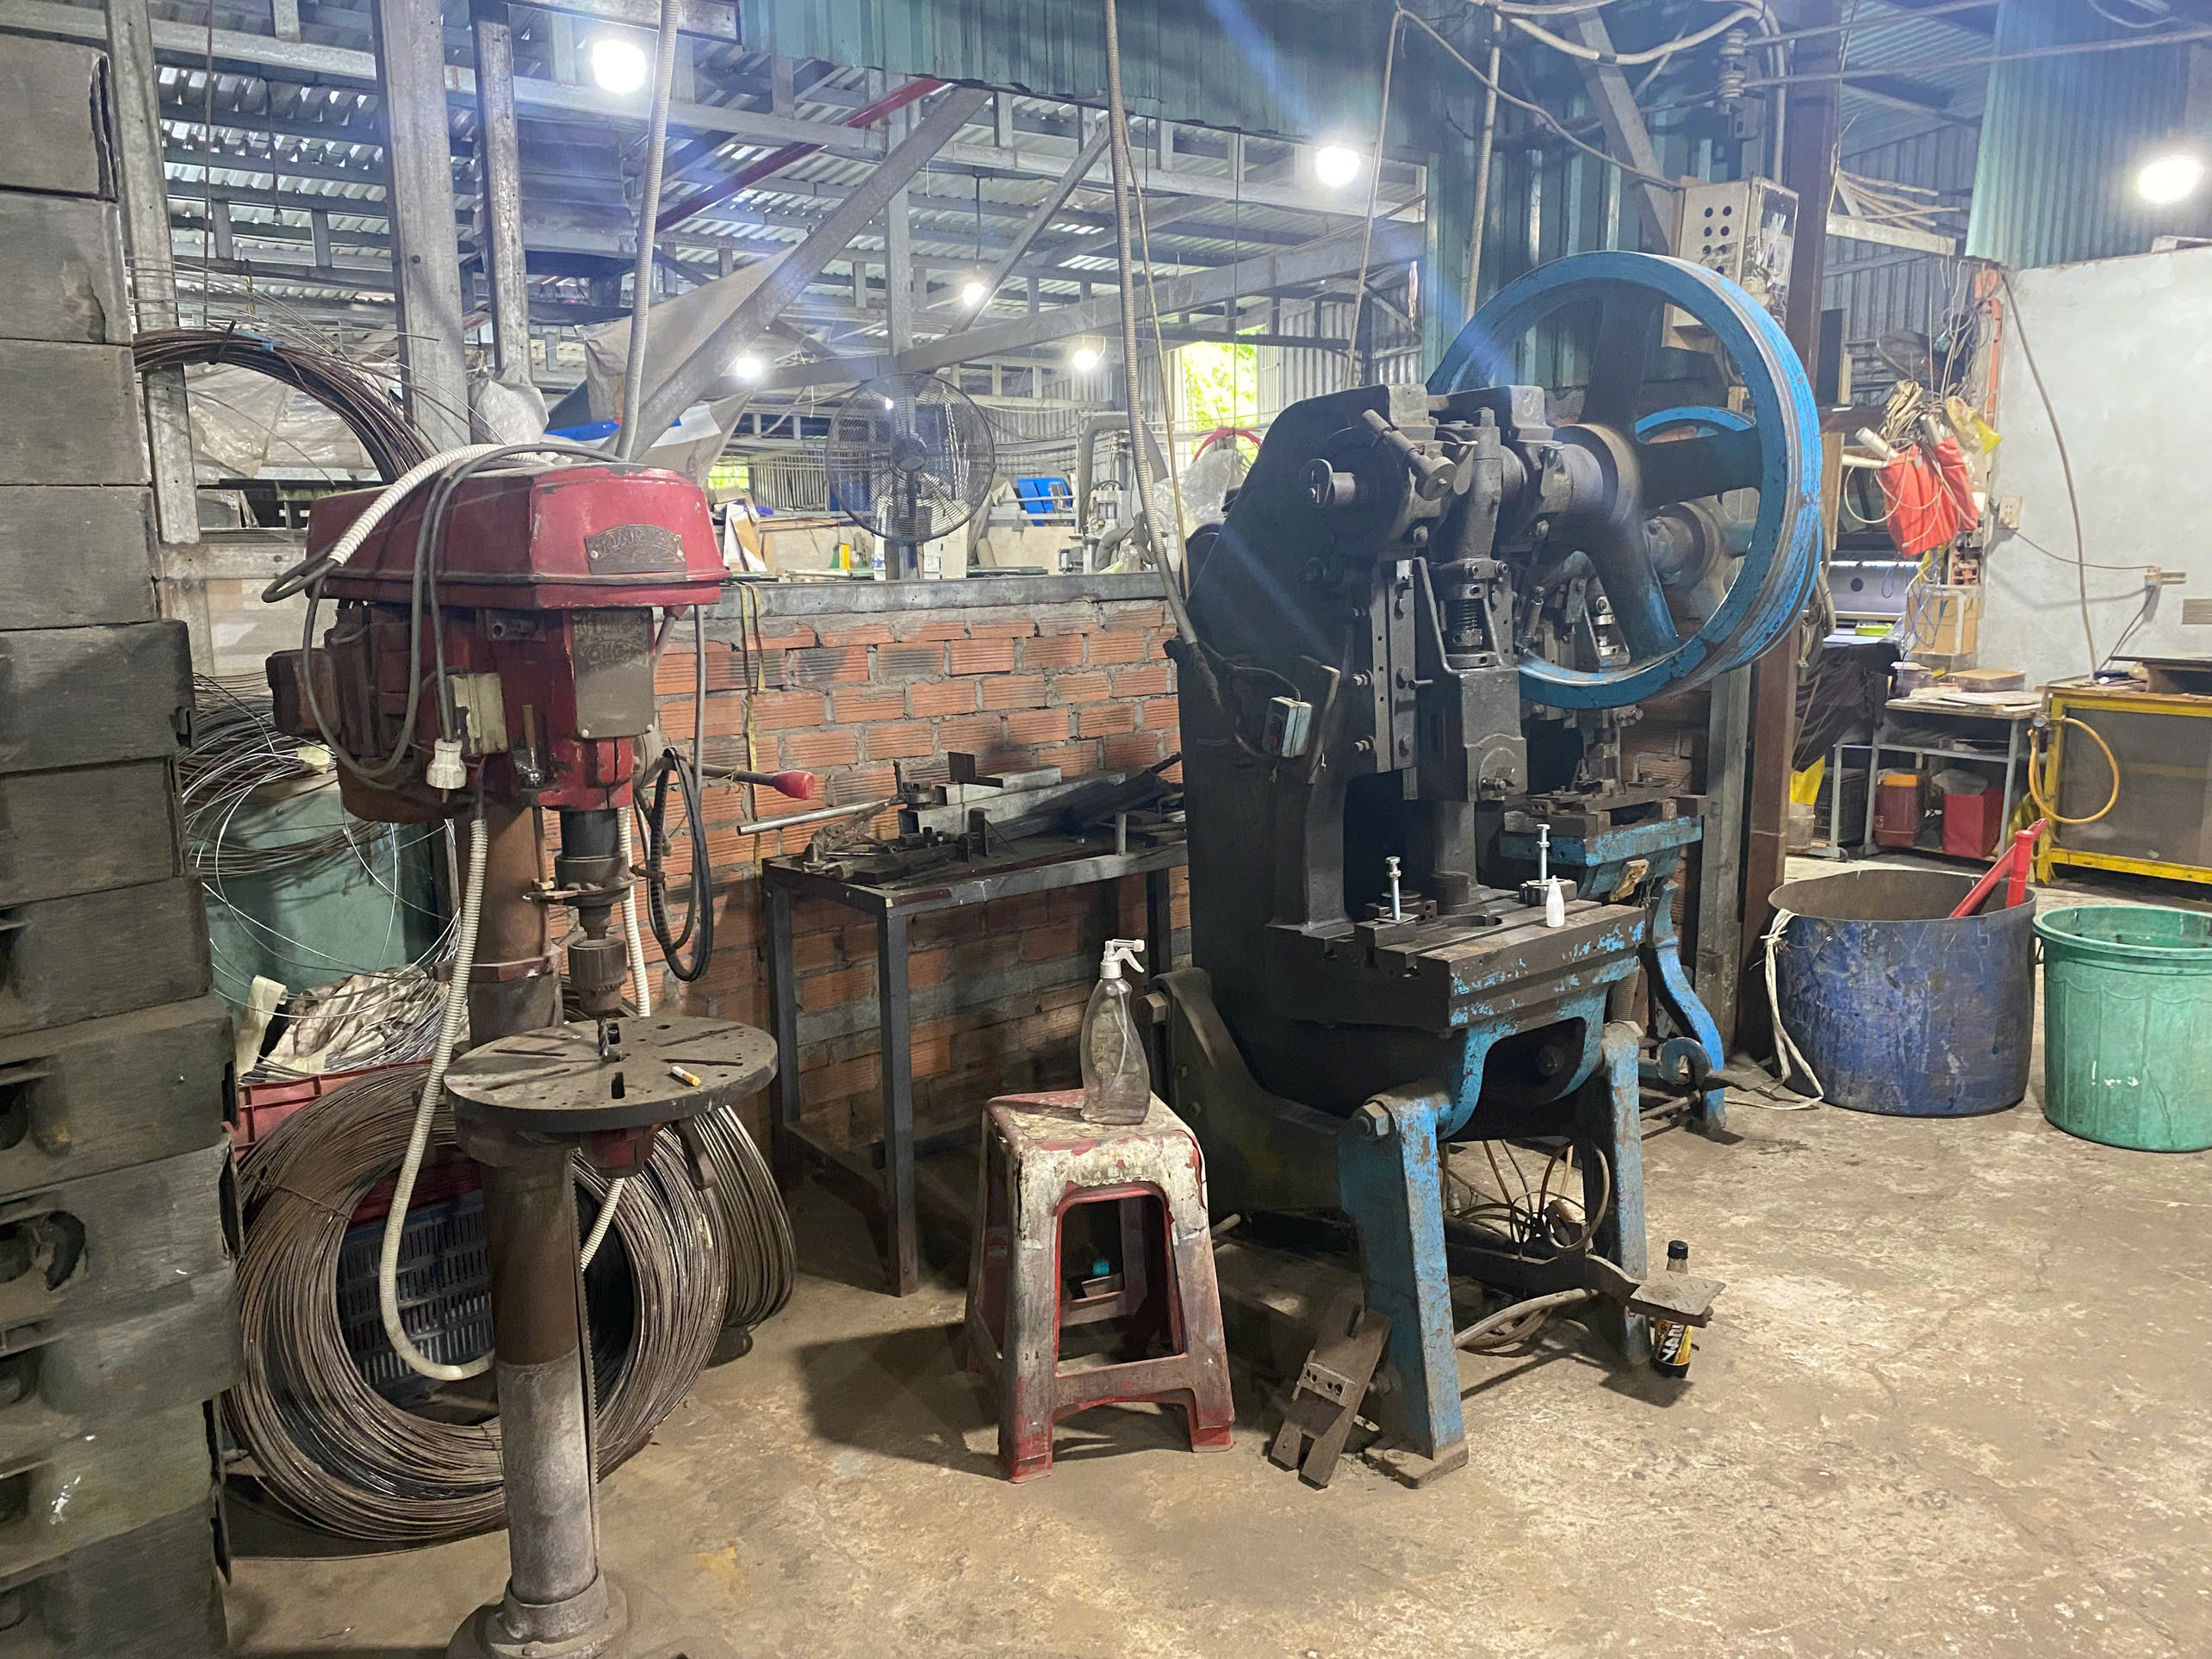
Last quarter, a client sent us a batch of sheet metal brackets that their previous supplier had shipped with a Cpk of 0.87 — every single part needed rework. That painful experience reminded our team why requesting SPC data 1 upfront isn’t optional.
To request SPC data when sourcing sheet metal fabrication, define critical-to-quality dimensions in your RFQ, require Cp and Cpk values of at least 1.33, demand raw measurement data with control charts, and verify supplier calibration systems before trusting any process capability study results.
This article walks through the exact steps to build SPC requirements into your sourcing process critical-to-quality dimension 2. Whether you buy precision brackets, mounting housings, or complex bent components, these practices will help you get reliable quality data from your sheet metal suppliers.
How do I clearly define my SPC expectations in my initial sheet metal RFQ?
One lesson we learned early while managing supplier audits across Vietnam and Southeast Asia: if your RFQ doesn't spell out SPC expectations in black and white, you will get vague capability claims and unusable data every time.
In your RFQ, list each critical-to-quality dimension, specify the required process capability index (Cpk ≥ 1.33 minimum), define sample sizes (30+ consecutive parts), mandate calibrated measurement tools, and require raw data submission — not just summary statistics or certificates.
Identify Your Critical-to-Quality Characteristics First
Before you write a single line in your RFQ, sit down with your engineering team and mark which dimensions actually matter. Not every hole location or bend angle on a sheet metal bracket needs SPC monitoring. Focus on the features that affect fit, function, or safety.
For example, on the heavy-duty mounting brackets we help source — the ones with multiple precise folds, mounting holes, and weld joints — we typically flag 3 to 5 critical dimensions. These might include hole-to-hole distances, bend angles at ±0.5°, and flatness on mating surfaces. These become the dimensions you call out for SPC in your RFQ.
Structure Your RFQ Language
Here is a practical framework for the SPC section of your RFQ:
| RFQ Element | What to Specify | Why It Matters |
|---|---|---|
| CTQ Dimensions | List each dimension with nominal value and tolerance | Ensures supplier knows exactly which features require SPC |
| Cpk Threshold | Minimum 1.33 for production; 1.67 for safety-critical | Sets a clear pass/fail criterion for process capability |
| Sample Size | 30–40 consecutive parts per capability study | Provides statistically valid data for capability analysis |
| Data Format | Raw measurements, not just Cpk summary values | Allows you to independently verify the supplier's claims |
| Control Chart Type | Xbar-R charts for subgroup monitoring | Standardizes the statistical control charts 3 method used |
| Measurement System | Calibrated instruments with valid certification | Ensures the dimensional inspection report is trustworthy |
| Submission Timing | With PPAP documentation 4 or first article inspection | Ties SPC data to your existing quality gate process |
Don't Assume — State Everything Explicitly
Many purchasing managers assume their supplier understands what "SPC data" means. In our experience coordinating between U.S. buyers and Asian fabrication shops, that assumption fails more often than it succeeds. Some suppliers interpret "SPC" as "send a few measurement readings in a spreadsheet." Others think a single Cpk number on a cover page is enough.
Your RFQ should specify the exact deliverables: control charts showing process stability, a capability study with both Cp and Cpk values 5, the raw measurement data behind those calculations, and calibration certificates for the gauges used. When we manage PPAP submissions for our clients, we build these requirements into a quality checklist that travels with the purchase order. This eliminates ambiguity and sets the supplier up for success from day one.
Also consider requiring the supplier to identify their measurement techniques — are they using CMM, calipers, optical comparators, or go/no-go gauges? The method matters because it affects measurement uncertainty, which directly impacts the reliability of the SPC results.
What specific process capability metrics should I demand to ensure my tolerances are consistently met?
A buyer we work with once received a capability report showing Cp = 1.85 and celebrated — until we pointed out the Cpk was only 0.72. The process had potential but was badly off-center, and nearly 15% of parts fell outside the tolerance band.
Demand both Cp (process potential) and Cpk (actual centered capability) values. For standard sheet metal dimensions, require Cpk ≥ 1.33. For safety-critical features or pre-production PPAP, require Cpk ≥ 1.67. Always verify that the process is stable and in statistical control before reviewing any capability numbers.
Understanding Cp vs. Cpk
These two metrics answer different questions. Cp tells you whether your process spread fits within the tolerance range. Cpk tells you whether the process is also centered within that range. You need both.
Think of it this way: Cp is like asking "Is this parking space wide enough for my car?" Cpk is like asking "Did I actually park in the middle, or am I scraping one wall?"
| Metric | Formula Concept | What It Tells You | Limitation |
|---|---|---|---|
| Cp | (USL – LSL) / (6σ) | Process spread relative to tolerance width | Ignores whether the process is centered |
| Cpk | Min of (USL – Mean) / (3σ) or (Mean – LSL) / (3σ) | Worst-case capability considering centering | Does not capture process stability over time |
A Cp of 1.33 means the tolerance band is 33% wider than the natural process variation. A Cpk of 1.33 means the process is both narrow enough and centered enough to keep defects below roughly 63 parts per million. When Cp is high but Cpk is low, the process needs centering — often a simple tooling adjustment on the press brake or a die alignment correction.
Minimum Thresholds by Application
Not all sheet metal parts carry the same risk. Our team uses a tiered approach when advising clients on what to require:
| Application Type | Minimum Cpk | Sample Requirement | Typical Context |
|---|---|---|---|
| Standard production dimensions | ≥ 1.33 | 30+ consecutive parts | General brackets, enclosures, non-critical panels |
| Safety-critical or high-reliability | ≥ 1.67 | 30–40 consecutive parts | Automotive structural brackets, mounting components near moving parts |
| Pre-production PPAP approval | ≥ 1.67 | 30 consecutive parts from production tooling | Initial supplier qualification before volume production |
| Low-volume or prototype | Consider 100% inspection | All parts measured | Custom one-off runs where SPC is impractical |
What Happens When Cpk Falls Below 1.0
A process capability index 6 below 1.0 means the process is not capable. Period. The natural variation exceeds the tolerance band. In this situation, requesting SPC data is premature. The supplier must first reduce variation — through better tooling, tighter material controls, or improved fixturing — before a meaningful capability study can be performed.
When we encounter this during supplier audits, we work with the fabricator to create a control plan for manufacturing that addresses the root cause. Sometimes it's worn tooling. Sometimes it's inconsistent material thickness from the steel mill. Sometimes it's operator technique on manual bending operations. Whatever the cause, the fix must come before the SPC study — never the reverse.
This sequence matters: first prove stability with statistical control 7 charts, then calculate capability. A process that is out of control may produce a high Cpk by accident on one batch, only to fail catastrophically on the next.
Connecting Capability to Your Advanced Product Quality Planning
If your organization follows Advanced Product Quality Planning, SPC data feeds directly into your control plan and ongoing production monitoring. The initial capability study during PPAP becomes the baseline. Ongoing SPC monitoring then confirms the process stays in control over time.
We help clients build this linkage into their supplier quality assurance framework so that SPC isn't a one-time gate but a continuous feedback loop.
How can I validate that my supplier is performing actual SPC rather than just providing paperwork data?
During a supplier audit at a sheet metal shop last year, we asked to see the control charts for a critical bend angle. The quality manager printed a beautiful Xbar-R chart — with every single data point perfectly inside the control limits. No variation. No trends. That's not a real process. That's fabricated data.
Validate supplier SPC by requesting raw measurement data for independent analysis, conducting on-site audits of data collection practices, verifying calibration certificates for all gauges, checking that subgroup sizes and sampling frequency match your requirements, and looking for natural variation patterns in control charts — perfectly clean data is a red flag.
Red Flags in Supplier SPC Data
Real manufacturing processes show variation. Even a well-controlled process will have data points that move within the control limits, occasional points near the limits, and natural patterns. Here are signs that the data may not be genuine:
- Every data point falls exactly at or near the nominal value
- No trends, shifts, or runs in the data — it looks randomly perfect
- The reported Cpk is unusually high (above 3.0) for a sheet metal bending or forming operation
- Subgroup standard deviations are suspiciously uniform across all subgroups
- The supplier cannot explain their rational subgrouping strategy
- Calibration certificates are missing or expired
Ask for Raw Data, Not Summaries
The single most effective validation step is to request the raw measurement data — every individual reading, not just the calculated Cp and Cpk. When our quality team receives SPC submissions from suppliers, we re-run the capability analysis independently. If our numbers don't match the supplier's report, we investigate.
This is where having access to the actual data points matters. A summary report can hide problems. Raw data cannot. We use this approach as a core part of our quality management system, and it has caught discrepancies more than once.
Verify the Measurement System
Before you trust any SPC data, confirm that the supplier's measurement system is valid. This means:
- Calibrated instruments — Ask for calibration certificates from an accredited lab. The certificates should be current and traceable to national standards.
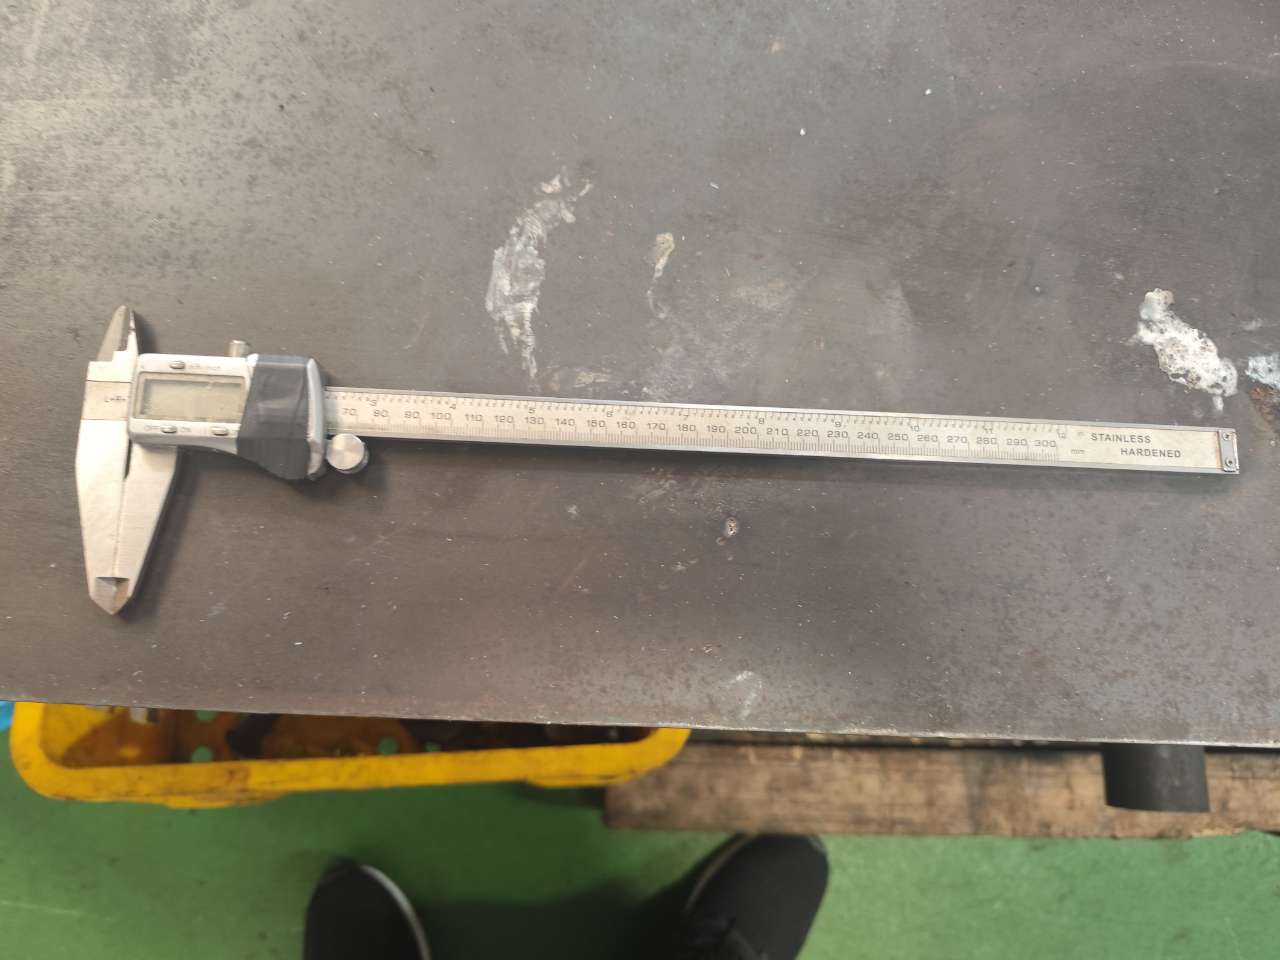
- Appropriate resolution — The measuring instrument should have resolution at least 10 times finer than the tolerance. For a ±0.1 mm tolerance, the gauge should read to 0.01 mm minimum.
- Gauge repeatability and reproducibility (GR&R) — A GR&R study shows whether the measurement system itself contributes excessive variation. Gauge repeatability and reproducibility 8 If measurement variation consumes more than 30% of the tolerance, the SPC data is unreliable.
Conduct Periodic On-Site Audits
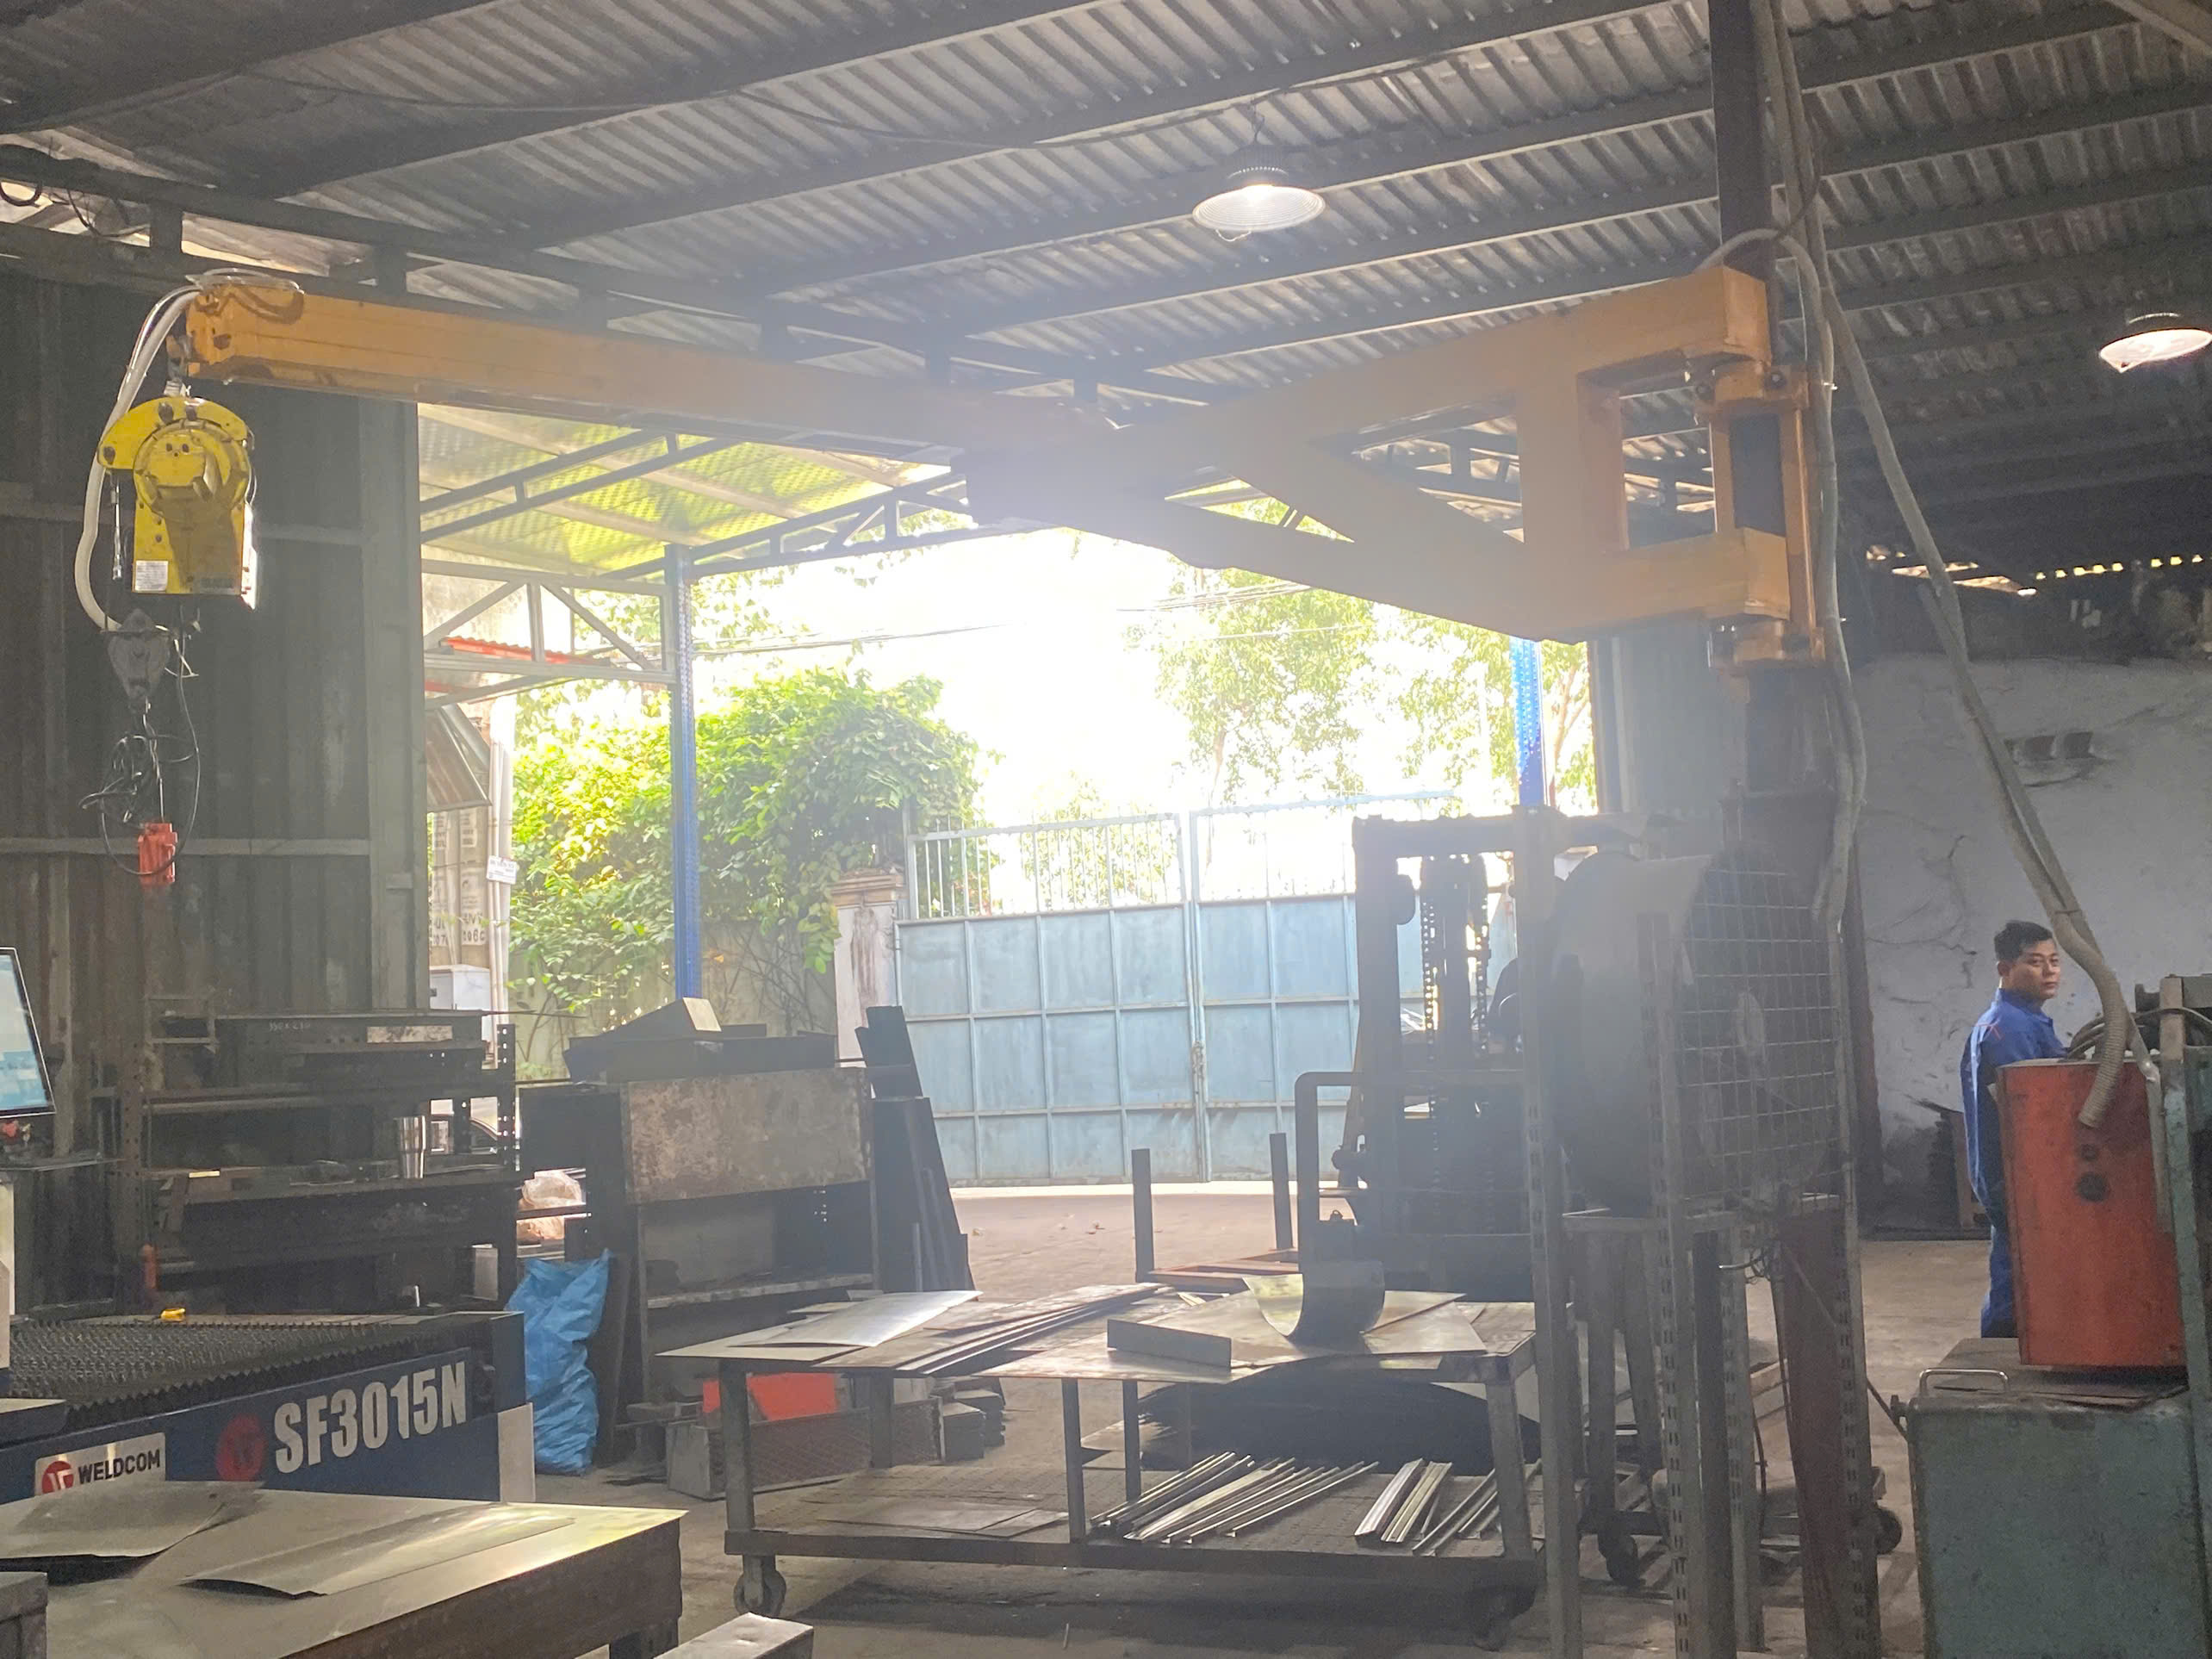
There is no substitute for seeing the process in person. When we perform supplier audits in Vietnam or across Southeast Asia, we watch operators take measurements during production. We verify that they follow the sampling plan. We check that data goes into the system in real time — not backfilled at the end of the shift.
For clients who cannot visit the supplier, we serve as their eyes on the ground. Our team photographs the measurement setup, records the data collection workflow, and interviews the quality staff. This is part of the supplier quality assurance process that prevents non-conforming products from ever reaching the shipping dock.
Leverage Digital SPC Tools
A growing number of fabricators now use real-time SPC software connected to digital gauges and CMM systems. Data flows directly from the instrument to the database with no manual entry. This reduces the risk of transcription errors and makes data manipulation much harder.
When evaluating suppliers, ask whether they use automated data collection. It's not a hard requirement for every job, but it signals a more mature quality infrastructure. Some platforms even support standardized data exchange formats that integrate with your own quality management system for seamless first article inspection and ongoing monitoring.
How will having access to my supplier's SPC data help me reduce my total cost of quality and avoid rework?
The brackets I mentioned at the start of this article — the ones with a Cpk of 0.87 — cost our client over $14,000 in rework, re-inspection, and air freight for replacements. That single quality escape wiped out the entire cost savings they had negotiated on the purchase price.
Access to supplier SPC data reduces your total cost of quality by predicting defects before they ship, eliminating incoming inspection redundancy, preventing rework and returns, enabling data-driven tolerance optimization, and building a continuous improvement loop that drives long-term yield gains across your supply chain.
From Reactive Inspection to Predictive Quality
Without SPC data, your quality strategy is reactive. You wait for parts to arrive, inspect them, find problems, reject or rework them, and then argue with your supplier about who pays. This cycle is expensive, slow, and exhausting.
With SPC data, you shift to a predictive model. You can see process trends before they produce non-conforming products. If a control chart shows a drift toward the upper specification limit, you alert the supplier to adjust before defects occur. This is the difference between firefighting and fire prevention.
Quantifying the Cost Impact
Consider a typical sheet metal bracket program. Here's how SPC data affects costs at each stage:
| Cost Category | Without SPC Data | With SPC Data | Impact |
|---|---|---|---|
| Incoming inspection | 100% inspection of every lot | Reduced or skip-lot inspection based on demonstrated capability | 40–60% reduction in inspection labor |
| Rework and scrap | Discovered only after receipt; high rework costs | Predicted and prevented at the supplier; minimal rework | 70–90% reduction in rework events |
| Returns and air freight | Frequent for non-conforming lots | Rare, because process drift is caught early | Near-elimination of expedited shipping costs |
| Engineering changes | Reactive tolerance changes after failures | Proactive tolerance optimization using real process data | Faster, cheaper design iterations |
| Supplier management time | High — constant firefighting and corrective actions | Low — data-driven reviews replace crisis calls | Significant time savings for purchasing managers |
Using SPC as a Design-for-Manufacturing Tool
One overlooked benefit of SPC data: it helps your engineers set smarter tolerances. If your supplier's SPC study shows that their bending process naturally holds ±0.15 mm, and your drawing calls for ±0.10 mm, you have a conversation to have. Maybe the tighter tolerance isn't functionally necessary. Maybe a different fabrication method achieves it. Maybe you need a different supplier.
This alignment between design tolerances and realistic process capabilities is a core principle of design for manufacturing. It prevents the common scenario where engineering specifies a tolerance the process cannot hold, leading to perpetual non-conformance and arguments about whether parts are "good enough."
Building a Continuous Improvement Loop
SPC data isn't a one-time deliverable. It's a living dataset that grows with every production run. Over time, you and your supplier can track capability trends, identify seasonal or material-related variation, and implement targeted improvements.
In our control plan manufacturing approach, we require suppliers to maintain ongoing SPC records and review them at quarterly business reviews. This discipline has helped several of our client programs achieve Cpk levels above 1.67 after starting below 1.33 — simply by using the data to guide incremental process adjustments.
The long-term payoff is a supplier relationship built on data and trust, not just price. When your supplier knows you will review their SPC data, they invest in process control. When they invest in process control, your parts arrive right the first time. And when parts arrive right the first time, your total cost of quality 9 drops — often by far more than any unit price negotiation could achieve.
Conclusion
Requesting SPC data when sourcing sheet metal fabrication 10 is not about adding paperwork — it's about building a quality-first supply chain that delivers right the first time, every time, and drives down your true total cost.
Frequently Asked Questions
How do I clearly define my SPC expectations in my initial sheet metal RFQ?
One lesson we learned early while managing supplier audits across Vietnam and Southeast Asia: if your RFQ doesn't spell out SPC expectations in black and white, you will get vague capability claims and unusable data every time.
What specific process capability metrics should I demand to ensure my tolerances are consistently met?
A buyer we work with once received a capability report showing Cp = 1.85 and celebrated — until we pointed out the Cpk was only 0.72. The process had potential but was badly off-center, and nearly 15% of parts fell outside the tolerance band.
How can I validate that my supplier is performing actual SPC rather than just providing paperwork data?
During a supplier audit at a sheet metal shop last year, we asked to see the control charts for a critical bend angle. The quality manager printed a beautiful Xbar-R chart — with every single data point perfectly inside the control limits. No variation. No trends. That's not a real process. That's fabricated data.
Footnotes
1. Replaced HTTP 403 link with an authoritative Wikipedia page on Statistical Process Control. ↩︎
2. Replaced HTTP unknown link with a relevant and comprehensive article on Critical to Quality (CTQ). ↩︎
3. Describes what control charts are, their history, and various types for process monitoring. ↩︎
4. Replaced HTTP 404 link with an authoritative Wikipedia page explaining Production Part Approval Process (PPAP). ↩︎
5. Differentiates between Cp and Cpk, explaining their individual meanings in process capability analysis. ↩︎
6. Explains the concept and significance of the process capability index (Cpk) in manufacturing. ↩︎
7. Defines what it means for a process to be in statistical control and its importance for stability. ↩︎
8. Explains Gage R&R studies and their role in evaluating measurement system variation and accuracy. ↩︎
9. Defines the total cost of quality (CoQ) and its components, highlighting its financial impact. ↩︎
10. Provides a comprehensive overview of the sheet metal fabrication process and its methods. ↩︎