
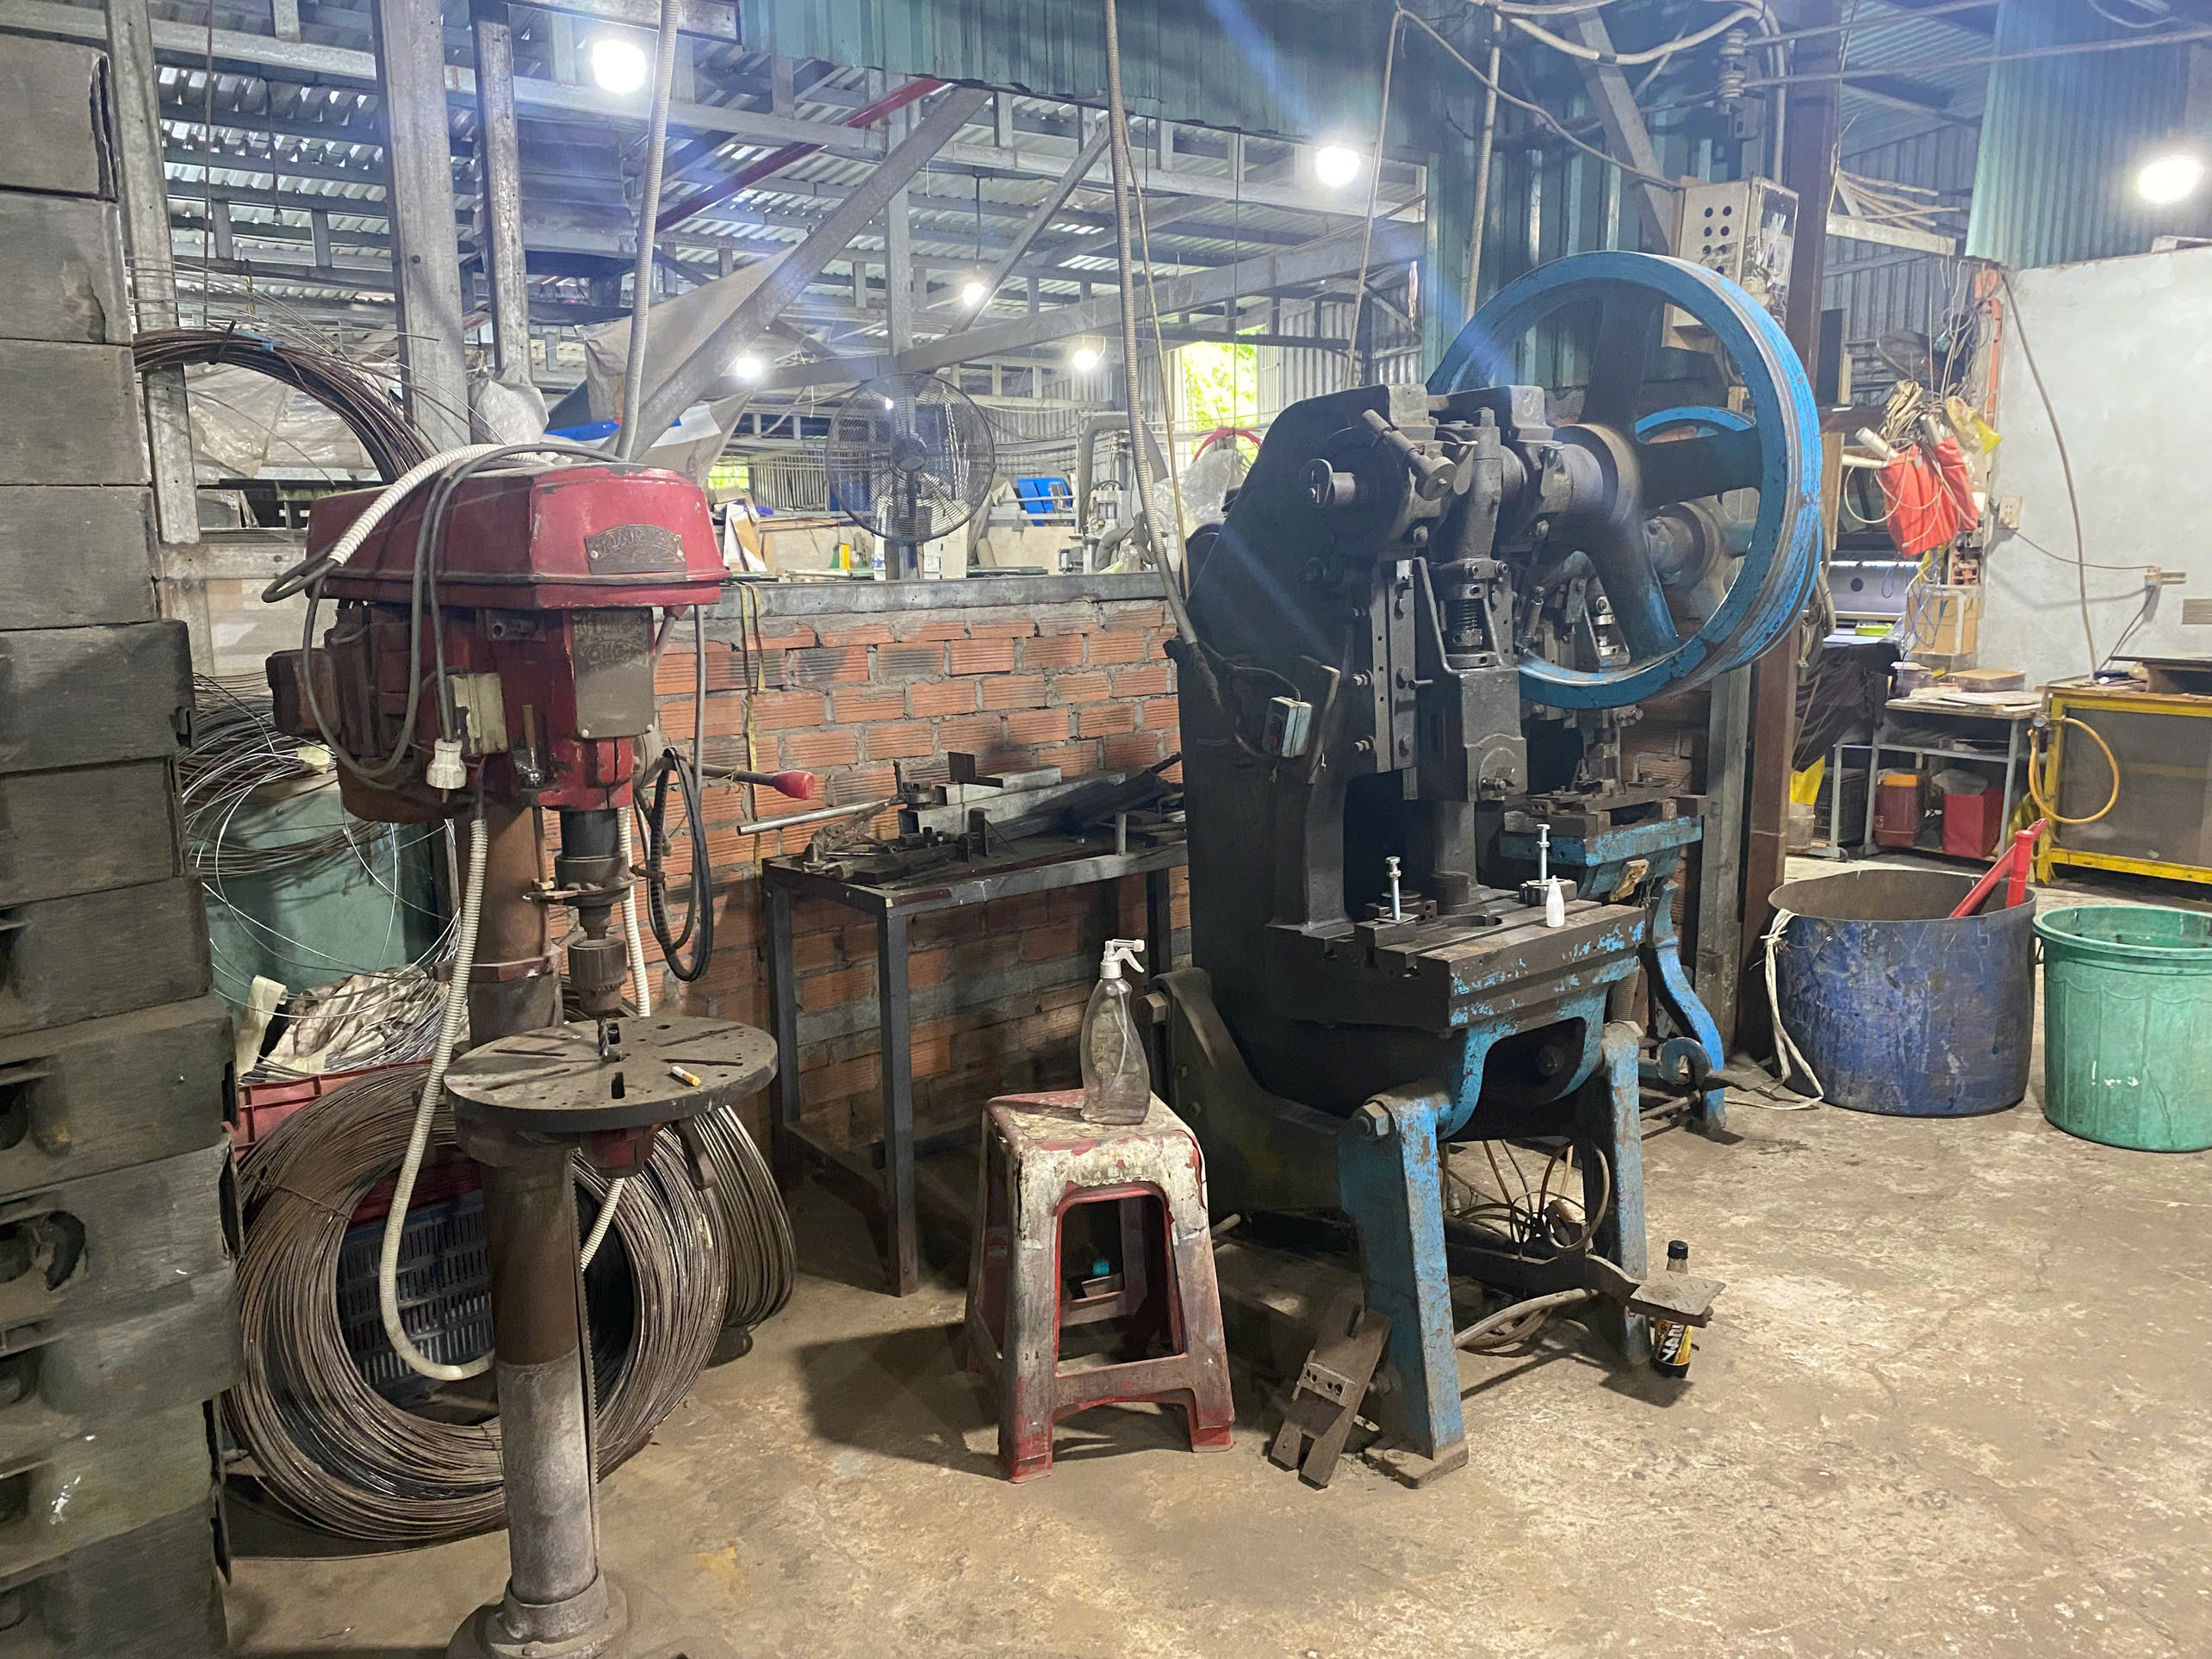
Last year, one of our U.S. clients received 15,000 stamped brackets — and 8% were out of tolerance Critical-to-Quality characteristics 1. No SPC data 2 existed. No control charts. No process capability records. The supplier had no idea the die was drifting. That single shipment cost our client weeks of rework, a delayed product launch, and a painful conversation with their end customer Cpk and Ppk reports 3. The frustrating part? This was entirely preventable. If the buyer had insisted on SPC data upfront, the drift would have been caught in the first hundred parts. On our side, we learned this lesson years ago when building out quality control processes 4 for stamping projects across Vietnam and China. Now, requesting SPC data from suppliers is the first quality conversation we have — not the last.
To request SPC data from suppliers when sourcing stamping parts, define your Critical-to-Quality characteristics, mandate Cpk and Ppk reports above 1.33, require X-bar and R control charts, specify sampling size and frequency, and make SPC a binding contract clause before production begins.
This guide walks you through exactly what to ask for, how to verify it, and why it matters — especially when importing custom stamping parts from Asia. Let’s break it down section by section.
What specific SPC reports should I ask for when sourcing custom stamping parts?
When our engineering team reviews a new stamping project, the first document we draft is not the purchase order — it is the list of SPC deliverables the supplier must provide. Without this list, you are flying blind on metal stamping quality.
You should request Cpk and Ppk capability reports, X-bar and R control charts, histograms for critical dimensions, run charts showing real-time trends, and a process capability summary tied to each Critical-to-Quality characteristic on your engineering drawing.

Start With Your Critical-to-Quality (CTQ) Characteristics
Before you ask for any report, you need to tell the supplier which dimensions matter most. Not every hole diameter or bend angle needs SPC monitoring. Focus on the features that affect fit, function, and safety. For a stamped mounting bracket with a circular hole and an elongated slot — like the parts we regularly source — the CTQ list might include the hole diameter tolerance, slot length, bend angle, and overall flatness.
Mark these characteristics clearly on the engineering drawing. Use symbols like "CC" (Critical Characteristic) or "SC" (Significant Characteristic). If you skip this step, suppliers will either monitor everything (expensive and slow) or nothing (dangerous).
The Reports You Must Demand
Here is a breakdown of each SPC report and what it tells you:
| Report Type | What It Shows | Why You Need It |
|---|---|---|
| Cpk / Ppk Report | Process capability index — how centered and tight the process is relative to spec limits | Tells you if the supplier can consistently hold your tolerances |
| X-bar and R Chart | Average and range of sample measurements over time | Reveals trends, shifts, and out-of-control conditions in real time |
| Histogram | Distribution shape of measured values | Shows whether the process output is normal, skewed, or bimodal |
| Run Chart | Individual measurements plotted in production sequence | Catches gradual drift that averages might hide |
| Process Capability Summary | Combined view of all CTQ dimensions with pass/fail status | Gives you a single-page snapshot of supplier quality |
Defining Acceptable Thresholds
Not all Cpk values are equal. Here is how to interpret them:
| Cpk Value | Interpretation | Action Required |
|---|---|---|
| > 1.67 | Excellent — Six Sigma level | No action needed; monitor and maintain |
| 1.33 – 1.67 | Good — meets most automotive and industrial standards | Acceptable for production; continue monitoring |
| 1.00 – 1.33 | Marginal — process is barely capable | Request corrective action and tighter controls |
| < 1.00 | Not capable — defects are likely | Stop production; require root cause analysis and CAPA |
For most custom stamping parts, I recommend setting the contractual minimum at Cpk ≥ 1.33. If your parts serve automotive or safety-critical applications, push for 1.67. These thresholds are consistent with IATF 16949 5 and the Production Part Approval Process (PPAP) requirements used by major OEMs.
Variable Data vs. Attribute Data
One distinction buyers often miss: SPC works best with variable data — actual measured dimensions like 12.05 mm, 12.03 mm, 12.07 mm. This is far more informative than attribute data, which is simply pass/fail. Variable data vs. Attribute data 6 Control charts built from variable data catch process variation early. Attribute data only tells you something is wrong after the defect has already occurred.
When you write your SPC requirements, specify that the supplier must report variable data for all CTQ dimensions. Attribute data is acceptable only for cosmetic features like surface scratches or burr presence.
How can I verify that the SPC data provided by my supplier is actually accurate?
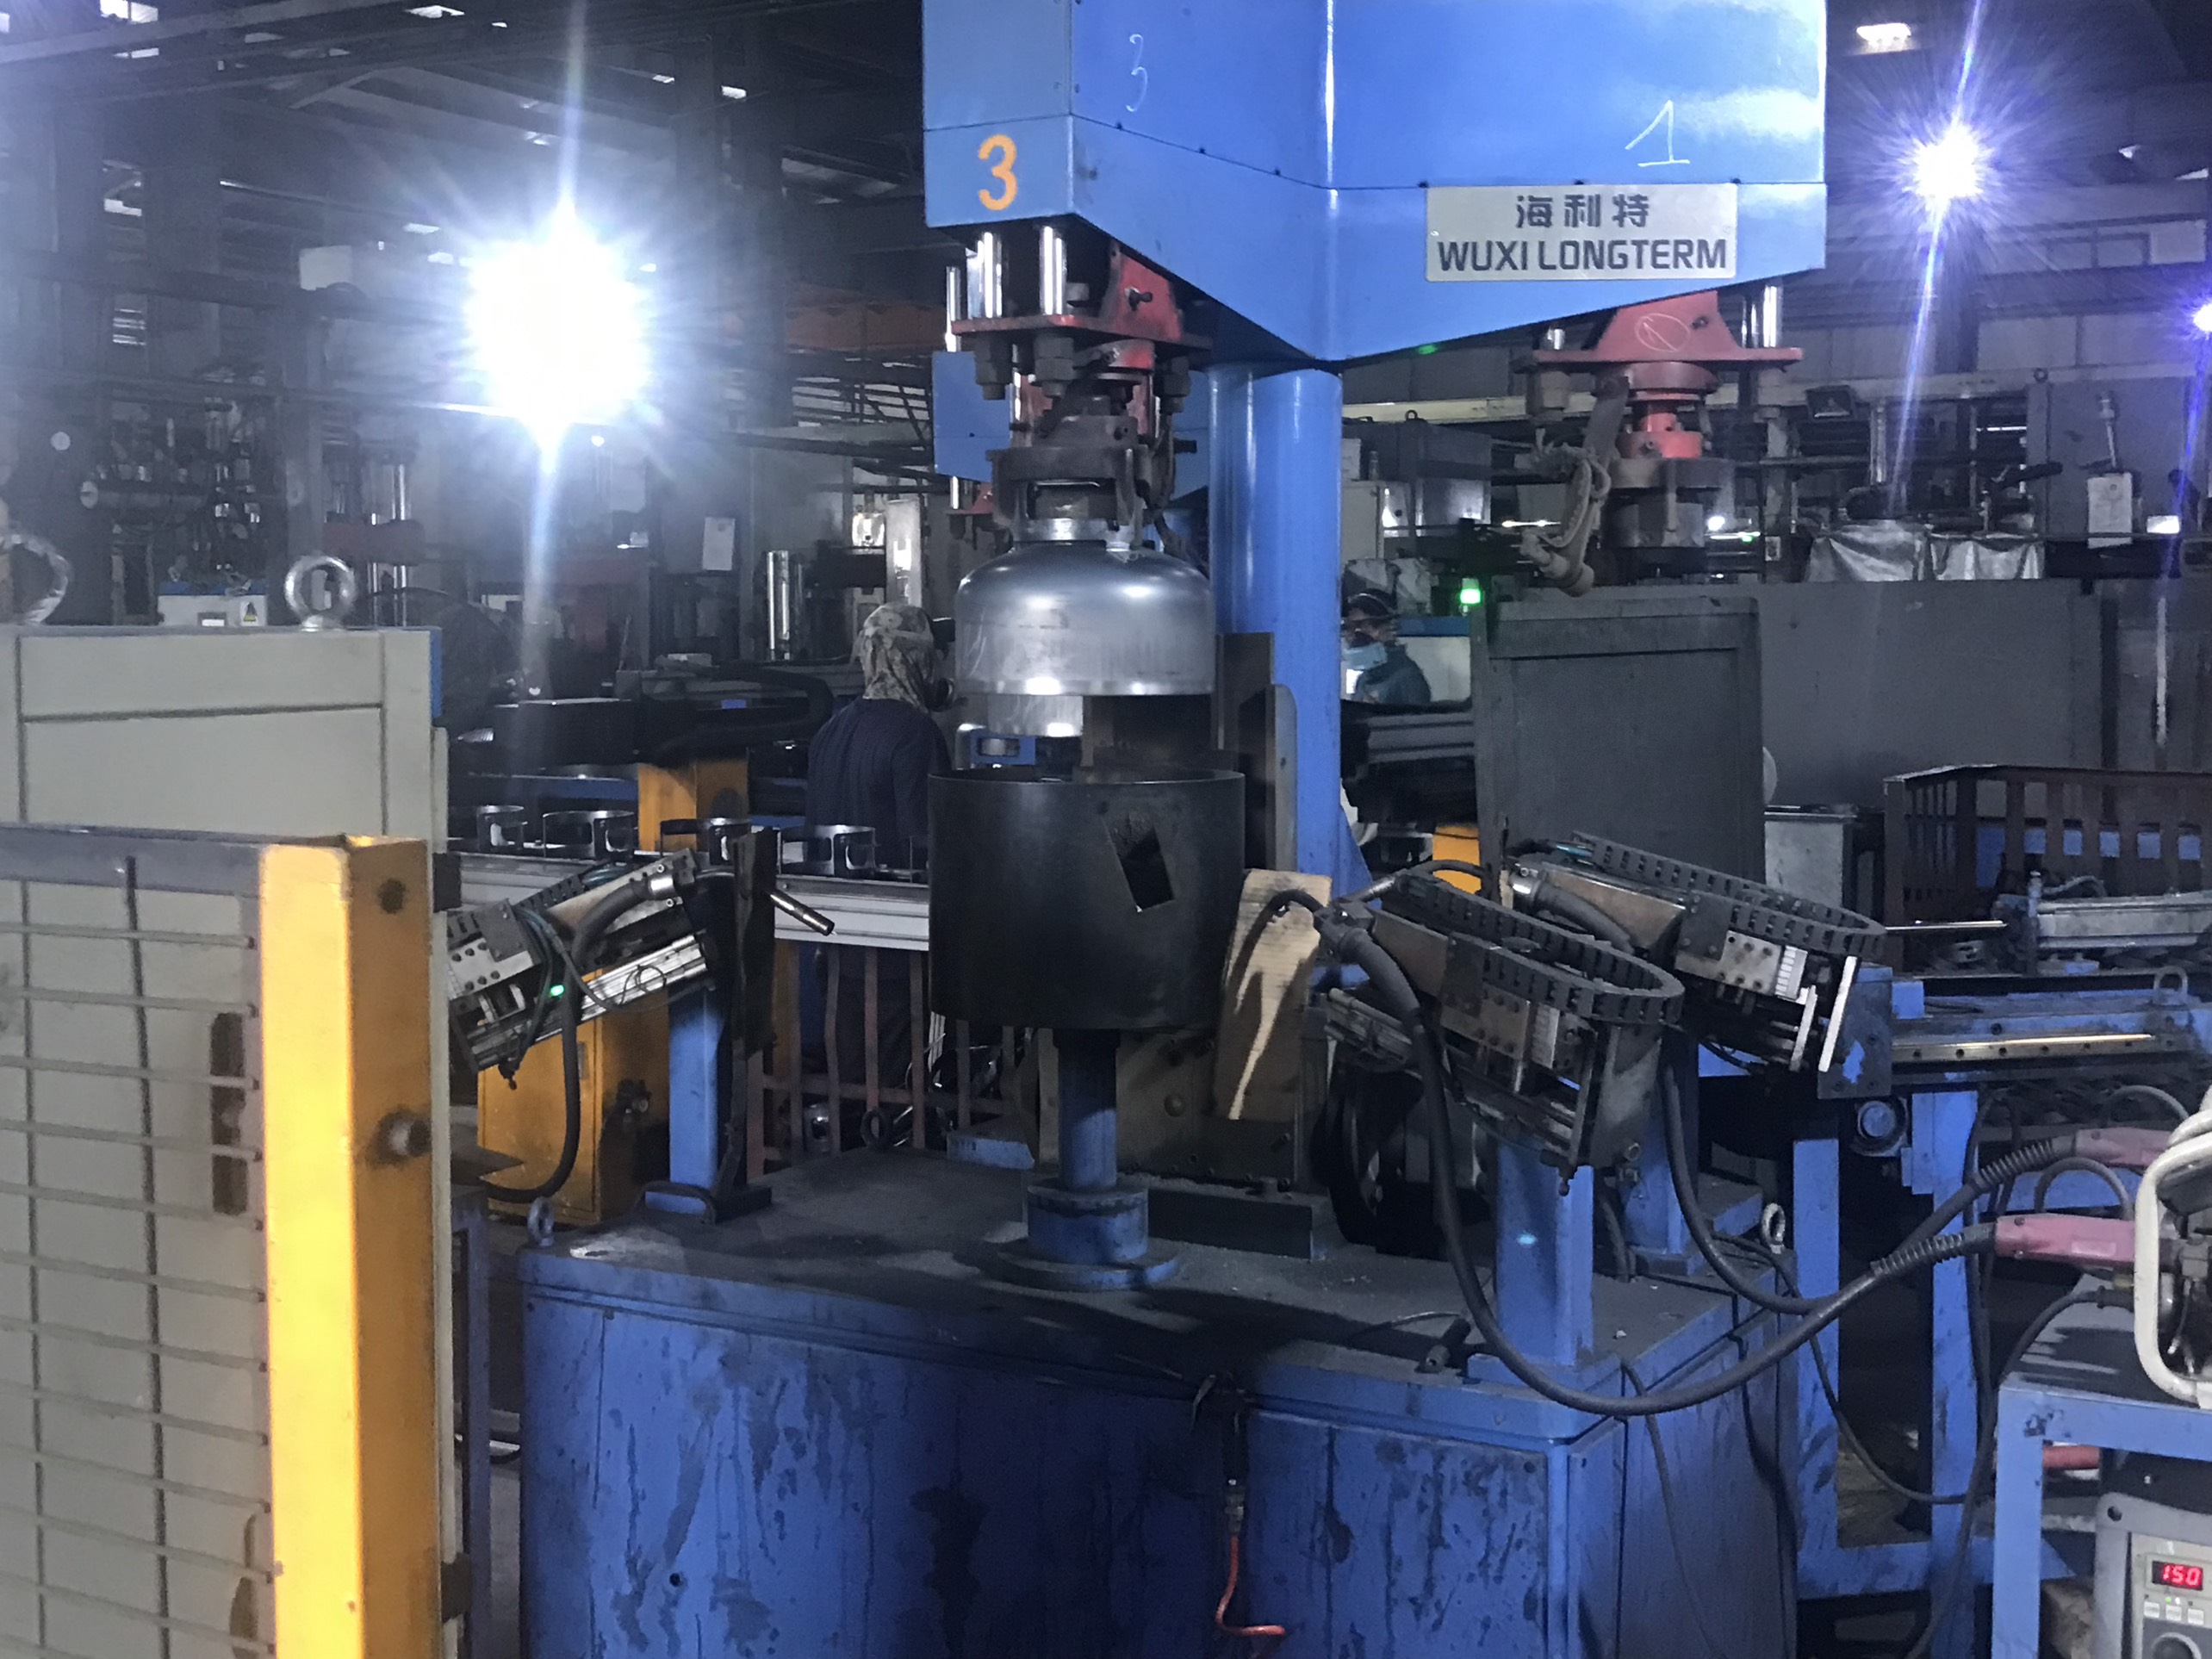
A few years ago, we audited a stamping supplier in Southeast Asia and found their Cpk reports looked perfect — too perfect. Every value was exactly 1.50. Every histogram was a textbook bell curve. When our team ran an independent dimensional inspection on retained samples, the real Cpk was 0.87. The data had been fabricated in Excel.
To verify supplier SPC data accuracy, cross-check reported values against independent sample measurements, audit the supplier's data collection method (manual vs. automated), request raw measurement files from CMM software, and conduct periodic on-site audits of their quality management system.
Red Flags in Supplier SPC Data
Before you even visit the factory, you can spot suspicious data from your desk. Here are warning signs:
- Every Cpk is identical. Real processes show variation between dimensions. If every CTQ returns the same Cpk, the data was likely fabricated or generated from a template.
- No outliers on control charts. Real production always has some noise. A perfectly clean X-bar chart 7 with no points near the control limits is unusual.
- Round numbers only. If every measurement ends in .00 or .05, someone is rounding — or inventing — data.
- No timestamp or machine ID. Legitimate SPC data includes when and where each measurement was taken. Missing metadata suggests manual entry without traceability.
The Verification Process
I recommend a three-layer approach:
Layer 1: Desk Review. Ask for the raw data file — not just a summary PDF. If the supplier uses CMM software like PC-DMIS or Zeiss Calypso, they should be able to export the native measurement file. Open it. Check that the number of data points matches the claimed sample size. Look for realistic variation.
Layer 2: Retain Samples. Require the supplier to ship a set of retained samples (typically 5–10 parts from the SPC run) with each shipment. Measure these yourself or through a third-party lab. Compare your results to the supplier's reported values. If the gap is larger than 10% of the tolerance, you have a data integrity problem.
Layer 3: On-Site Audit. During supplier audits — which our Vietnam and China teams conduct regularly — observe the SPC data collection process in real time. Is the operator actually measuring parts with calibrated instruments? Or are they filling in a spreadsheet after the fact? Watch for the moment data moves from the gauge to the record. That transition is where accuracy lives or dies.
Manual vs. Automated Data Collection
The method of data collection directly affects reliability. Automated systems — where a CMM or vision system feeds measurements directly into an SPC platform like Net-Inspect or DELMIAWorks — eliminate human error and transcription mistakes. Manual entry into Excel is still common among smaller suppliers, but it introduces risk.
| Data Collection Method | Accuracy | Traceability | Cost to Supplier | Buyer Confidence |
|---|---|---|---|---|
| Automated CMM to SPC software | High | Full (timestamped, machine-linked) | Higher initial investment | High |
| Semi-automated (CMM export to Excel) | Medium | Partial | Moderate | Medium |
| Fully manual (caliper to Excel) | Low | Weak | Low | Low — requires extra verification |
When sourcing stamping parts, I always ask the supplier to describe their data collection workflow. If they rely on manual Excel entry, I factor in additional in-process inspection and retained-sample verification. For high-volume or safety-critical parts, automated collection is non-negotiable.
Why is SPC data essential for my quality control process when importing from Asia?
The hardest lesson I've learned managing supply chains across Vietnam and China is this: distance amplifies quality risk. When your supplier is 10,000 miles away, you cannot walk the production floor every day. You need data — structured, real-time, trustworthy data — to act as your eyes on the process.
SPC data is essential when importing from Asia because it provides objective, real-time evidence of process stability, replaces subjective quality judgments with measurable metrics, enables early detection of process variation before defective parts ship, and creates accountability across time zones.
The Cost of Not Having SPC
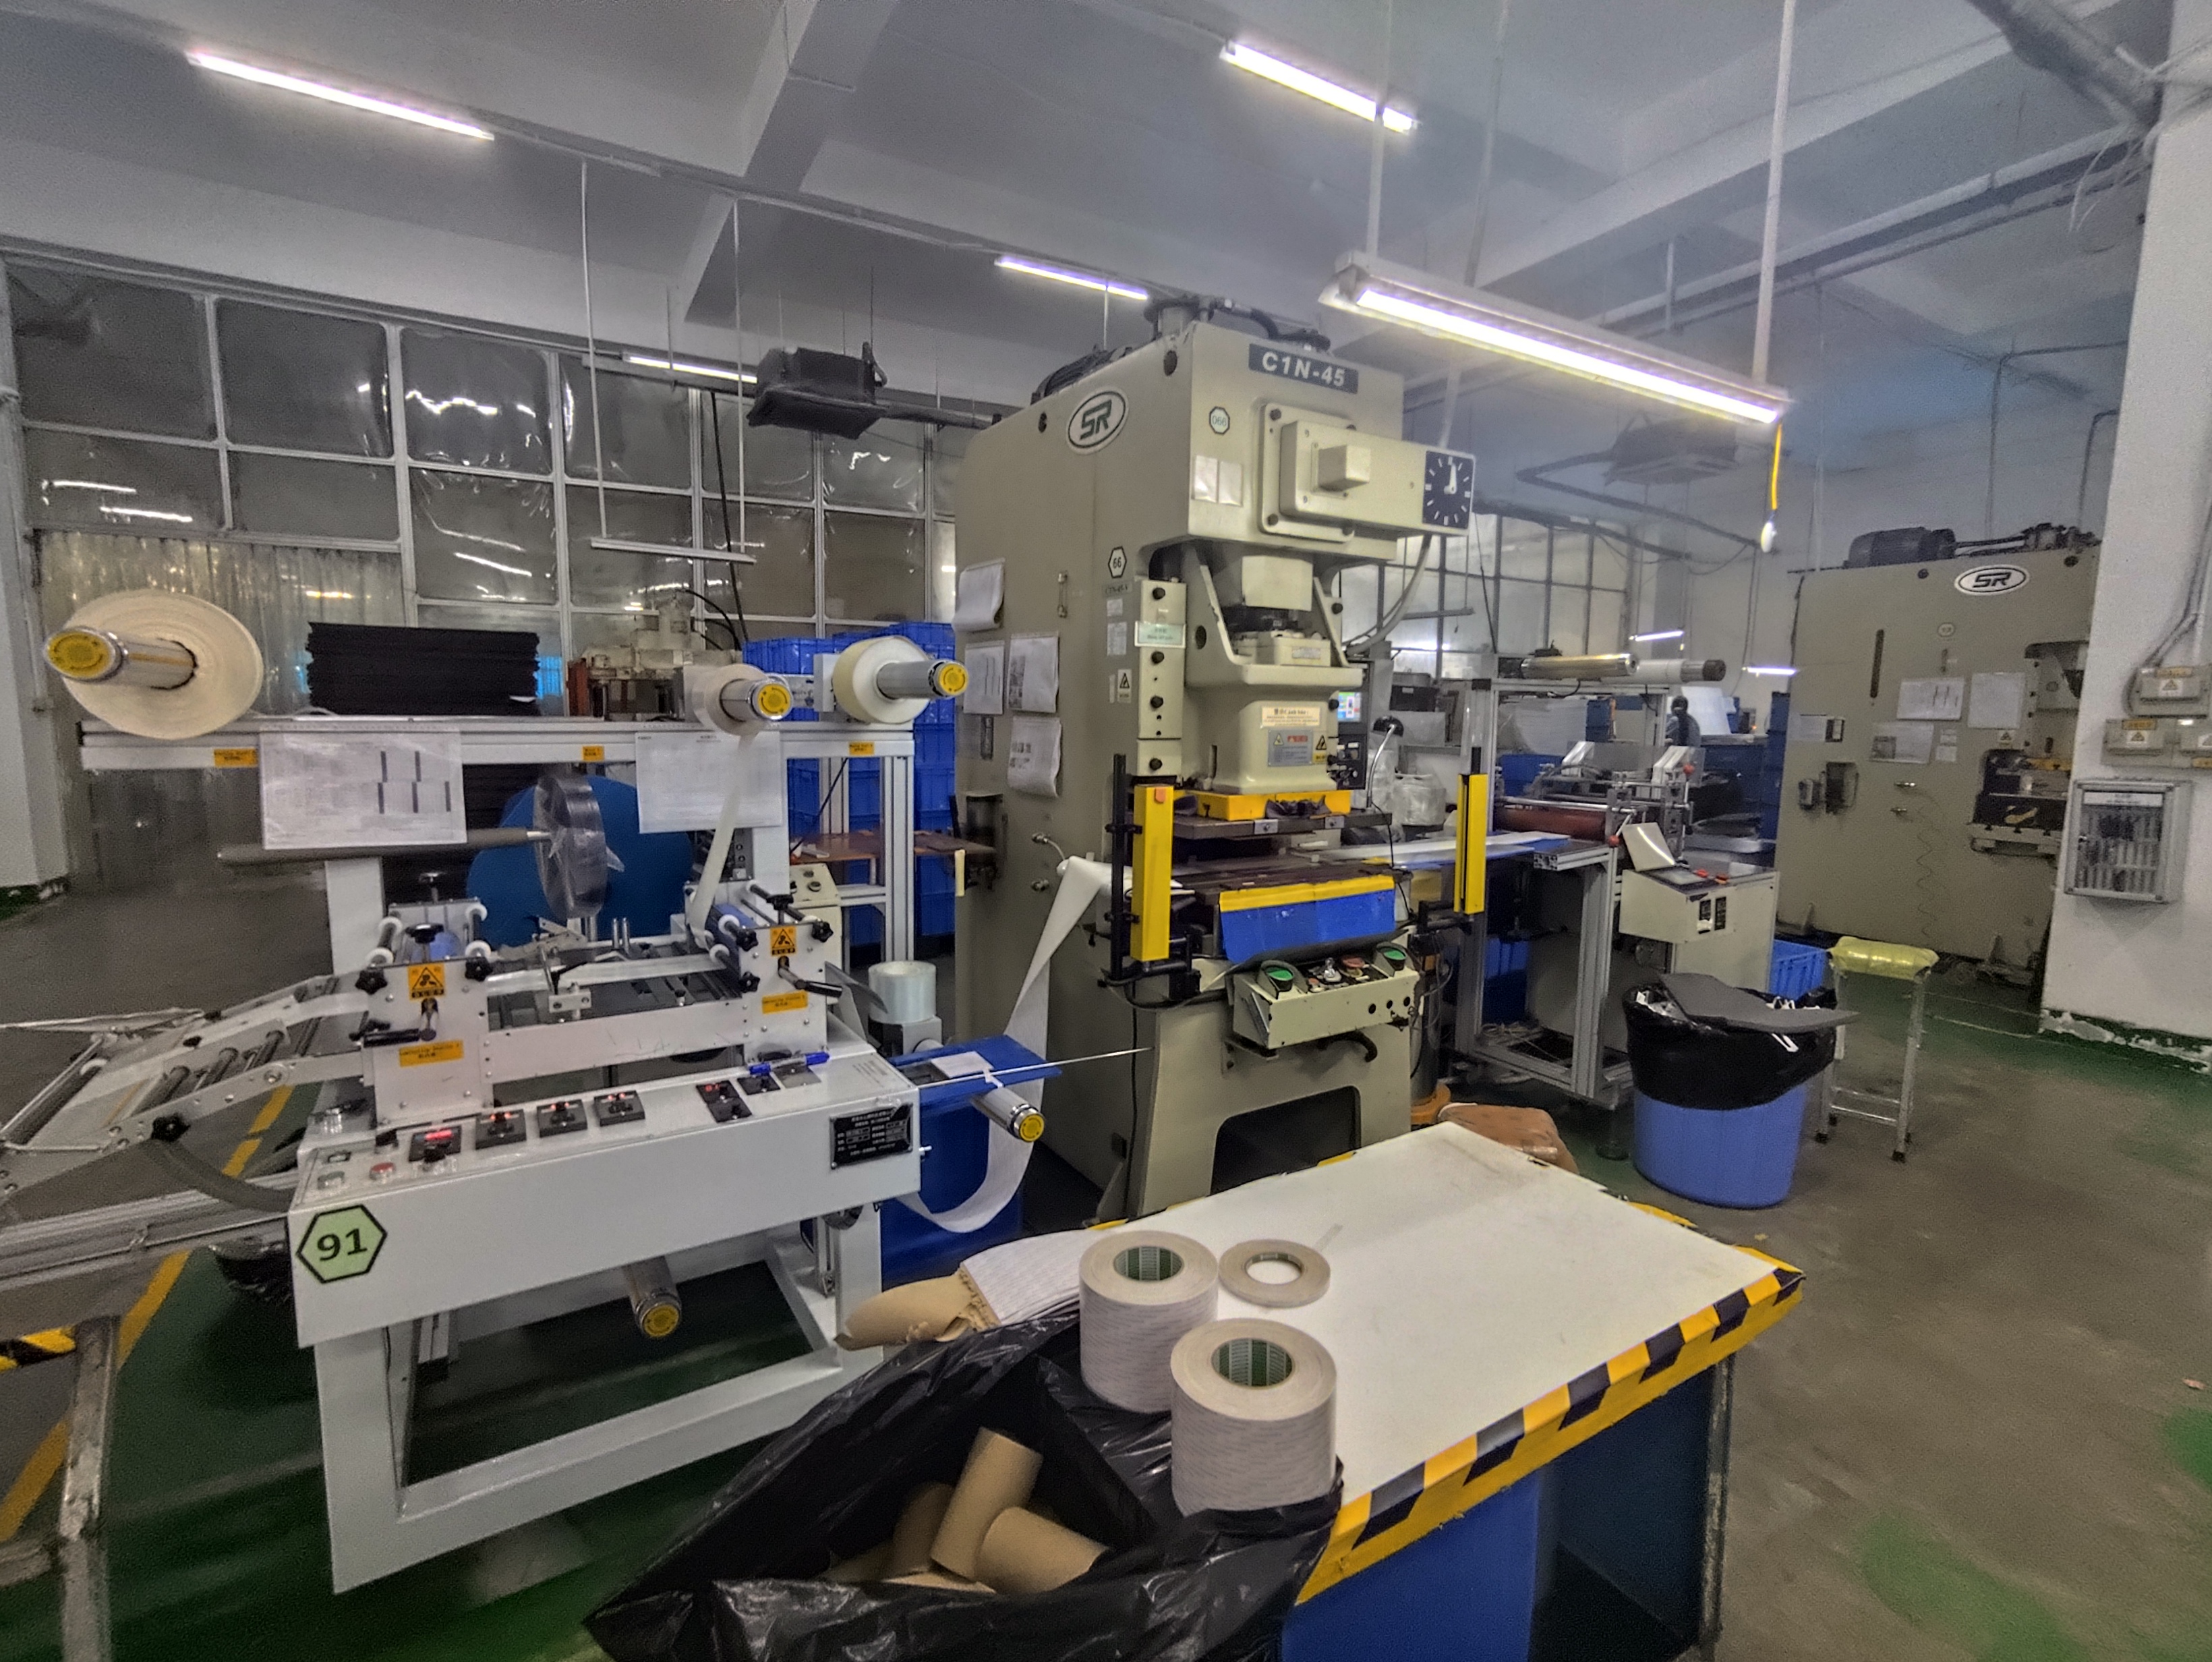
Without SPC, your quality control process is reactive. You find problems after parts arrive at your warehouse — or worse, after they reach your end customer. Rework, returns, air freight for replacement parts, and damaged relationships all follow. I have seen a single undetected die crack produce 3,000 warped brackets before anyone noticed. SPC monitoring of the press tonnage curve would have flagged the anomaly within the first 50 parts.
How SPC Enables Defect Prevention
SPC shifts your quality model from detection to defect prevention. Instead of inspecting finished parts and sorting good from bad, SPC monitors the process parameters 8 that produce the parts. If the tonnage drops by 5%, the control chart flags it. If the die temperature drifts upward, the trend chart shows it. You catch the cause before the effect.
This is especially critical for stamping. In a progressive die, a tiny change in strip feed, lubrication, or die alignment propagates through every station. By the time a finished part shows a crack or burr, the root cause may have started thousands of hits earlier. SPC — particularly predictive SPC using AI models that analyze tonnage curves and temperature data — can detect drift hours before a bad part reaches the conveyor.
The PPAP Connection
For buyers serving automotive or regulated industries, SPC data is not optional — it is a formal requirement of the Production Part Approval Process 9. The Ford PPAP Handbook, for example, requires stamping suppliers to perform SPC on 125 parts for Critical Characteristics, even when total batch sizes are below 1,000 parts. This is the benchmark we reference when structuring quality requirements for our clients' projects. PPAP without SPC is incomplete.
The Supplier Accountability Factor
SPC data creates a shared language between buyer and supplier. When you can point to a control chart and say, "Your process shifted at part number 4,200 — what happened?" — you move from vague complaints to precise, actionable conversations. This accelerates root cause analysis and corrective action. It also builds a quality history you can reference for future orders, customer specifications reviews, and supplier scorecards.
How do I use SPC data to ensure my supplier gets my stamping project right the first time?
Getting it right the first time is the single most important goal in any custom stamping project. Every rework cycle costs weeks. Every re-cut die costs thousands. Our team has managed enough PPAP submissions to know that "right first time" is not luck — it is a system. And SPC data is the backbone of that system.
Use SPC data to get your stamping project right the first time by defining CTQ characteristics before tooling, requiring SPC during trial runs, reviewing Cpk scores before approving mass production, mandating real-time monitoring during production, and making SPC a contractual obligation with clear thresholds.
Step-by-Step: The SPC Request Process
Here is the exact process I walk our clients through:
Step 1 — Define CTQ Characteristics. Review the engineering drawing. Identify every dimension, tolerance, and surface requirement that affects part function. Mark them with CC or SC designations. Share this marked-up drawing with the supplier before tooling begins.
Step 2 — Publish an SPC Roadmap. Create a document — or use a Quality Data Management platform — that lists each CTQ, the measurement method, the instrument to be used, the sample size, and the reporting frequency. This removes ambiguity. The supplier knows exactly what you expect.
Step 3 — Require SPC During Trial Runs. Do not wait until mass production. During the first trial (T1), require the supplier to run SPC on a minimum of 30 parts. For PPAP-level submissions, follow the Ford standard: 125 parts for Critical Characteristics. This trial data is your first real look at whether the die, press, and material can meet your customer specifications.
Step 4 — Review Cpk Before Approving Mass Production. If the trial Cpk is below 1.33 for any CTQ, do not approve mass production. Require the supplier to adjust the die, change the material lot, or modify the process — and re-run the trial. This is where "right first time" is won or lost.
Step 5 — Mandate Real-Time Monitoring. For production runs, require ongoing SPC at a defined frequency (e.g., 5 parts every 500 hits, or 6 groups of 5 parts pulled from different coil meters). This sampling strategy captures process variation across the full run, not just a single snapshot.
Step 6 — Make SPC a Contract Clause. Include SPC requirements in your purchase agreement. Specify the metrics (Cpk, Ppk), the thresholds (≥ 1.33), the format (digital, raw data), and the consequences for non-compliance (rejection, cost recovery). This is not optional.
Sampling Strategy for Small Batches
A common challenge in custom stamping: batch sizes are often below 1,000 parts. How do you run meaningful SPC on a small batch? The Ford PPAP standard says 125 parts. Some quality engineers argue 30 parts is sufficient for processes with low variation.
My recommendation: use a stratified sampling approach. Pull 6 groups of 5 parts from different points in the coil — beginning, middle, and end — and from different press cycles. This gives you 30 parts that represent the full range of material and process variation. If the project is PPAP-level, extend to 125 parts using the same stratified logic.
Common Stamping Defects SPC Catches
SPC is not abstract. It catches real, specific defects by monitoring the process parameters that cause them:
- Burrs — caused by die wear or excessive clearance. SPC on tonnage and edge measurements flags this early.
- Warping — caused by uneven stress release or die misalignment. Flatness measurements on control charts reveal the trend.
- Cracking — caused by material fatigue, wrong grain direction, or excessive bend radius. Tonnage spikes on run charts indicate cracking risk.
- Dimensional drift — caused by die wear over thousands of hits. X-bar charts show the slow shift before parts go out of tolerance.
- Surface scratches — caused by debris in the die or rough handling. While often tracked as attribute data, frequency charts catch increases.
- Springback variation — caused by material lot changes. Bend angle measurements in SPC reveal lot-to-lot inconsistency.
Predictive SPC and AI Integration
The cutting edge of SPC is predictive. Modern systems use AI models — including LSTM neural networks and autoencoders — trained on historian data (tonnage curves, die temperature, lubrication flow rates) to predict process drift hours before it results in a defect. While not every Asian supplier has adopted this technology yet, the trend is accelerating, especially in automotive stamping. When evaluating suppliers, ask whether they have any predictive monitoring capability. It is a strong indicator of a mature quality management system 10.
The Technology Stack
If you want to go deeper into the tools, here is what to look for:
| Category | Tools / Platforms | Notes |
|---|---|---|
| Handheld Metrology | Mitutoyo calipers, micrometers, height gauges | Standard for in-process inspection |
| CMM Software | PC-DMIS, Zeiss Calypso, Nikon CMM Manager | Automated dimensional inspection with exportable data |
| SPC Platforms | Net-Inspect, DELMIAWorks, SPC for Excel, Minitab | Real-time dashboards, automated control chart generation |
| Predictive AI | Custom LSTM models, Sight Machine, Tulip | Emerging — not yet standard but growing fast |
When our team manages a stamping project, we specify which of these tools the supplier must use — or at minimum, which data formats they must deliver. Standardized digital formats (CSV, XML) enable faster analysis and integration into our quality tracking systems.
Conclusion
SPC data is not a nice-to-have — it is your primary defense against quality failures when sourcing custom stamping parts from Asia. Define your CTQs, demand Cpk reports above 1.33, verify the data independently, and make SPC a binding contract clause. You should also establish effective incoming inspection standards as an additional layer of quality assurance, and consider how to verify IATF 16949 certification when evaluating potential suppliers for automotive-grade stamping projects.
Frequently Asked Questions
What specific SPC reports should I ask for when sourcing custom stamping parts?
When our engineering team reviews a new stamping project, the first document we draft is not the purchase order — it is the list of SPC deliverables the supplier must provide. Without this list, you are flying blind on metal stamping quality.
How can I verify that the SPC data provided by my supplier is actually accurate?
A few years ago, we audited a stamping supplier in Southeast Asia and found their Cpk reports looked perfect — too perfect. Every value was exactly 1.50. Every histogram was a textbook bell curve. When our team ran an independent dimensional inspection on retained samples, the real Cpk was 0.87. The data had been fabricated in Excel.
Why is SPC data essential for my quality control process when importing from Asia?
The hardest lesson I've learned managing supply chains across Vietnam and China is this: distance amplifies quality risk. When your supplier is 10,000 miles away, you cannot walk the production floor every day. You need data — structured, real-time, trustworthy data — to act as your eyes on the process.
Footnotes
1. Wikipedia provides an authoritative and concise explanation of Critical-to-Quality (CTQ) characteristics. ↩︎
2. Explains SPC as a data-driven methodology for monitoring, controlling, and improving manufacturing processes. ↩︎
3. ASTM explains Cpk and Ppk as measures of process capability and performance relative to specifications. ↩︎
4. ASQ defines quality control as part of quality management focused on fulfilling quality requirements. ↩︎
5. Defines IATF 16949 as an international standard for automotive quality management systems. ↩︎
6. iSixSigma.com offers a clear and detailed explanation of the difference between variable and attribute data. ↩︎
7. Explains X-bar charts for monitoring process mean and detecting shifts over time. ↩︎
8. Defines process parameters as measurable, controllable conditions that determine how a manufacturing process runs. ↩︎
9. AIAG defines PPAP as the industry standard for demonstrating a supplier’s manufacturing process capability. ↩︎
10. ISO defines a QMS as a collection of processes and procedures ensuring high-quality products and services. ↩︎