
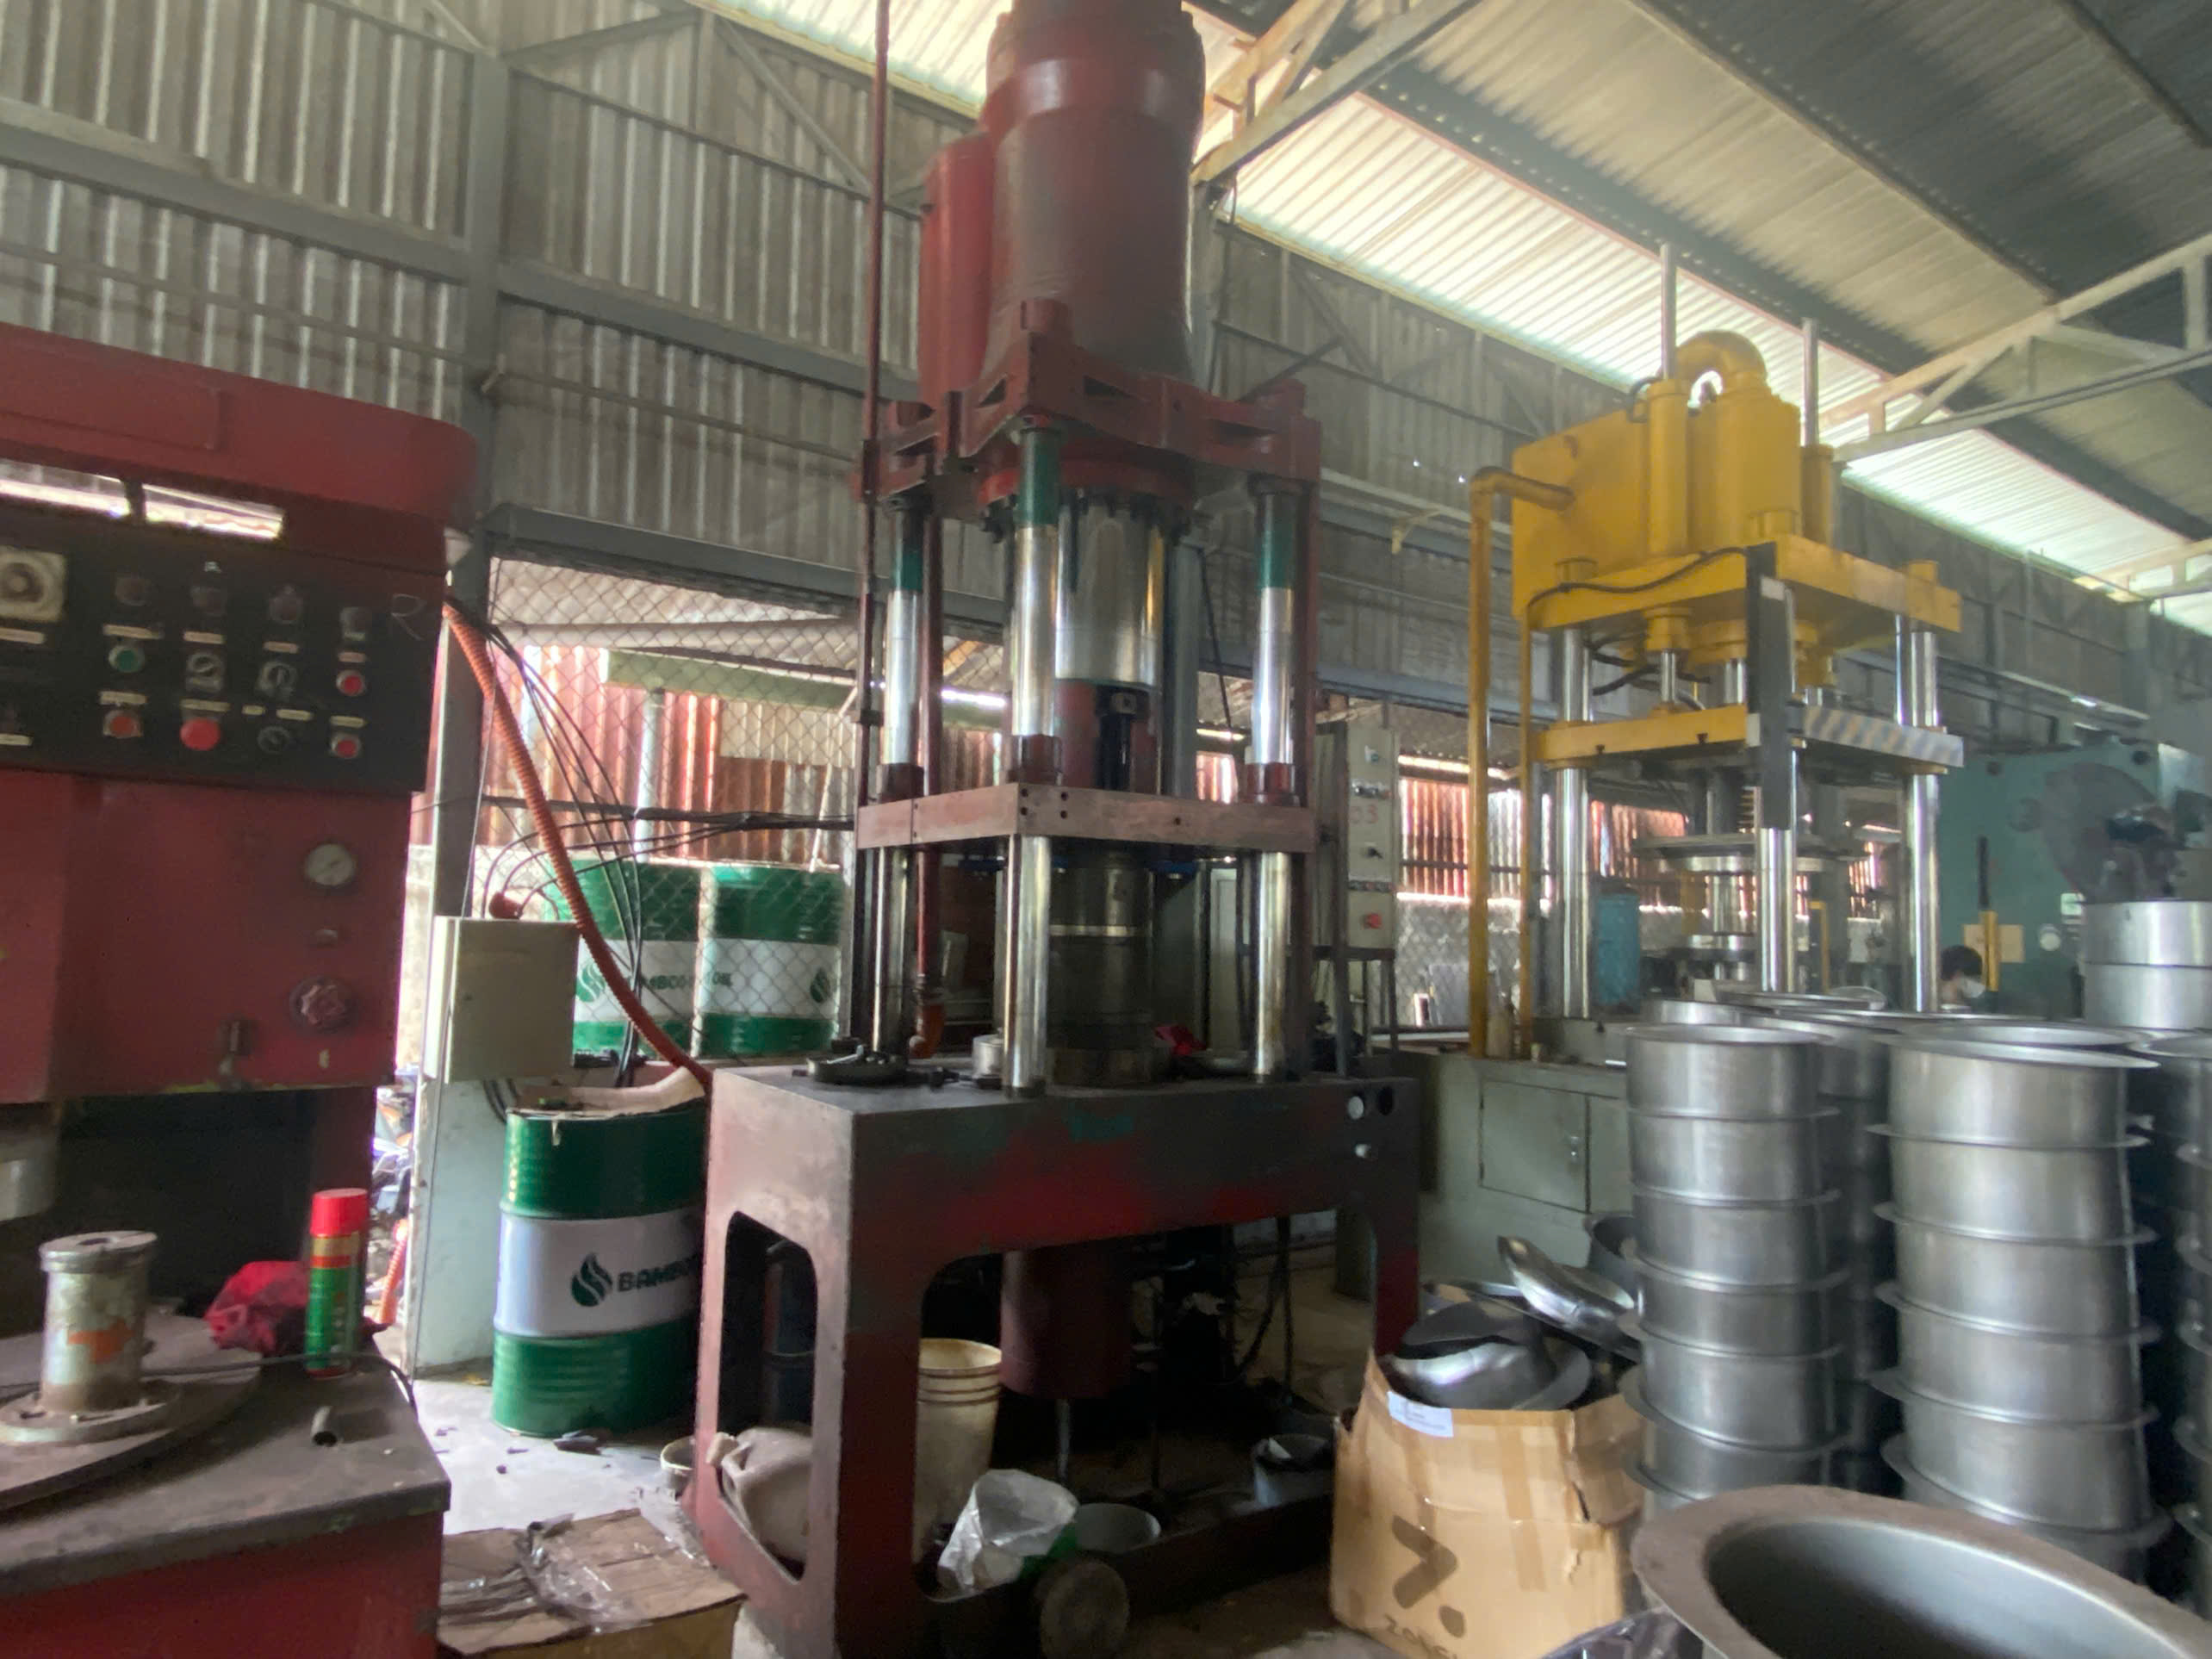
A supplier scorecard for stamping parts sourcing can save your supply chain — or, without one, a single missed defect can shut down an entire assembly line.
A supplier scorecard for stamping parts sourcing is a structured evaluation tool that uses weighted metrics — including PPM defect levels, on-time delivery rate, response discipline, and operational maturity — to objectively rank and develop stamping suppliers based on real performance data rather than gut feeling.
I have seen too many sourcing teams rely on spreadsheets full of price comparisons while ignoring the risks that actually cause production shutdowns. Tooling wear, repeat quality escapes, and premium freight charges are everyday realities in metal stamping. This guide walks you through building a scorecard that captures what truly matters. Let me show you how we approach it, step by step.
What Metrics Should I Include in My Stamping Supplier Scorecard?
When we onboarded a new bracket supplier in Vietnam last year, the first question from our U.S. client was not about price — it was about how we planned to measure that supplier's quality performance metrics over the first six months.
Your stamping supplier scorecard should include PPM defect levels, on-time delivery rate, lead time variance, corrective action report closure speed, documentation quality, engineering change responsiveness, and premium freight incidents — all tied to stamping-specific risks like tooling degradation and containment burden.

Generic scorecards built for commodity purchasing miss the mark for stamped metal parts 1. A bracket with a burr or a tolerance drift is not like a late shipment of office supplies. One bad batch of stamped mounting hardware can halt an assembly operation and trigger expensive containment actions downstream. That is why I recommend organizing your metrics under four lenses: Quality, Delivery, Response Discipline, and Operational Maturity.
The Four Lenses for Stamping Metrics
Here is how I break down each lens and the specific metrics within it:
| Lens | Metric | Why It Matters for Stamping |
|---|---|---|
| Quality | PPM (Parts Per Million defects) | The gold standard for measuring escape rate in high-volume stamped parts |
| Quality | Containment Burden | Tracks cost and effort to sort or rework defective parts before they reach end users |
| Quality | Deviation Frequency | Counts how often a supplier strays from approved drawings or processes |
| Delivery | On-Time Delivery (OTD) | Late stamped parts can idle an entire assembly line |
| Delivery | Premium Freight Incidents | Measures how often delays force expensive air shipments |
| Delivery | Lead Time Variance | Consistency matters more than speed; unstable lead times break production planning |
| Response Discipline | Corrective Action Follow-through | Speed and quality of closing out corrective action reports 2 |
| Response Discipline | Engineering Change Responsiveness | How fast a supplier adapts tooling and process when a design changes |
| Operational Maturity | PPAP Completion Quality | Evaluates Production Part Approval Process documentation thoroughness |
| Operational Maturity | Launch Behavior (NPI) | Performance during new part introduction; critical for custom parts |
| Operational Maturity | Documentation Quality (COC, Material Certs) | Accuracy and completeness of certificates and material traceability |
Leading vs. Lagging Indicators
Most teams only track lagging indicators — things like defect escapes that have already happened. I push our team to also watch leading indicators. For example, the speed at which a supplier closes corrective action reports tells you whether the next quality escape is likely. Tracking IATF 16949 3 compliance status and audit scores gives you an early warning system. Monitoring tooling life cycle management — stroke counts, tonnage signatures, and scheduled die maintenance — lets you predict quality drift before a bad batch ships.
Another metric I find undervalued is Design for Manufacturability 4 (DfM) contributions. When a stamping supplier proactively suggests reducing a secondary operation or changing a bend radius to cut material waste reduction 5, that tells you they understand the process deeply. We log these suggestions and factor them into the scorecard under Operational Maturity.
The key is to keep the list focused. Five to seven core metrics are enough for most programs. If you track too many, the scorecard becomes a data graveyard nobody reads. Start lean, then expand if needed.
How Do I Weight Quality, Delivery, and Communication in My Scoring System?
A lesson we learned the hard way: giving cost a 40% weight almost cost a client their largest end-customer contract. The "cheapest" supplier delivered late three times in a quarter and triggered premium freight charges that wiped out all savings.
For stamping parts, weight delivery performance at roughly 35–40%, quality at 25–30%, lead time consistency at 15–20%, and responsiveness at 10–15%. Cost should be a qualifier, not the dominant driver, because a single stamping defect or late shipment can cascade into assembly-line shutdowns and far exceed any unit-price savings.

Weighting is where most scorecards either shine or fall apart. The numbers you assign tell your suppliers what you truly value. If you weight cost at 40%, do not be surprised when suppliers cut corners on inspection to hit a lower price. For stamped metal parts — brackets, mounting bases, flanges — quality and delivery failures are catastrophic. A burr on a powder-coated L-bracket can halt a furniture assembly line. A late shipment of post base mounts can delay a construction project by weeks.
The Four-Layer Scoring Model
I recommend a structure that keeps every score traceable:
Category → Criterion → Evidence → Weighted Score
This means every number on the scorecard points back to a real data source. No opinions. No guesses.
| Layer | What It Captures | Example |
|---|---|---|
| Category | Broad performance area | Quality |
| Criterion | Specific measurable metric | PPM defect rate |
| Evidence | Data source or document | Incoming inspection reports, ERP goods-received records 6 |
| Weighted Score | Criterion score × category weight | 4 out of 5 × 0.30 = 1.20 |
Use a five-point scale. It is simple enough for cross-functional teams to calibrate and detailed enough to differentiate suppliers.
Strategic vs. Transactional Weighting
Not all stamping suppliers deserve the same scorecard weights. We segment suppliers into tiers:
| Supplier Tier | Quality Weight | Delivery Weight | Lead Time Weight | Responsiveness Weight |
|---|---|---|---|---|
| Strategic (complex, safety-critical parts) | 30% | 35% | 15% | 20% |
| Preferred (standard custom parts) | 25% | 40% | 20% | 15% |
| Transactional (simple bracketry, commodity) | 20% | 40% | 25% | 15% |
For strategic suppliers producing safety-critical stamped components, I increase the weight on quality and responsiveness. Why? Because tooling degradation on a complex die affects tolerances in ways that a simple flat bracket never will. And if the supplier cannot respond quickly to a corrective action, the risk compounds.
For transactional suppliers making simple flat brackets, delivery consistency and lead time predictability matter more because these parts feed high-volume assembly. You need them on time, every time.
The total cost of ownership 7 mindset is critical here. A supplier offering 5% lower unit cost but triggering two premium freight events per quarter is actually more expensive. Build that into your weighting logic. When we manage production capacity assessment for a client, we factor in surge capability and buffer stock discipline — both of which feed into the delivery score. Learn more about how to balance price, quality, and delivery time when evaluating stamping parts suppliers.
Setting Green / Yellow / Red Thresholds
Do not set arbitrary targets. Pull 12 months of purchase order data and let history define your bands:
- Green (Score 5): OTD ≥ 98%, PPM < 300
- Yellow (Score 3): OTD 90–97%, PPM 300–800
- Red (Score 1): OTD < 90%, PPM > 800
These thresholds should reflect your actual supply chain tolerance. If your end-customer has zero-tolerance for line stoppages, your green band for OTD may need to start at 99%.
What Data Sources Can I Use to Track My Suppliers' Performance Accurately?
One of the most common frustrations I hear from U.S. purchasing managers is this: "I know my supplier is underperforming, but I cannot prove it with data." That gap between intuition and evidence is exactly what a good data collection strategy solves.
Track stamping supplier performance using ERP goods-received records, incoming inspection reports, PPAP documentation, corrective action logs, freight invoices for premium shipping events, and structured stakeholder feedback from your engineering and quality teams — then reconcile all sources before scoring.
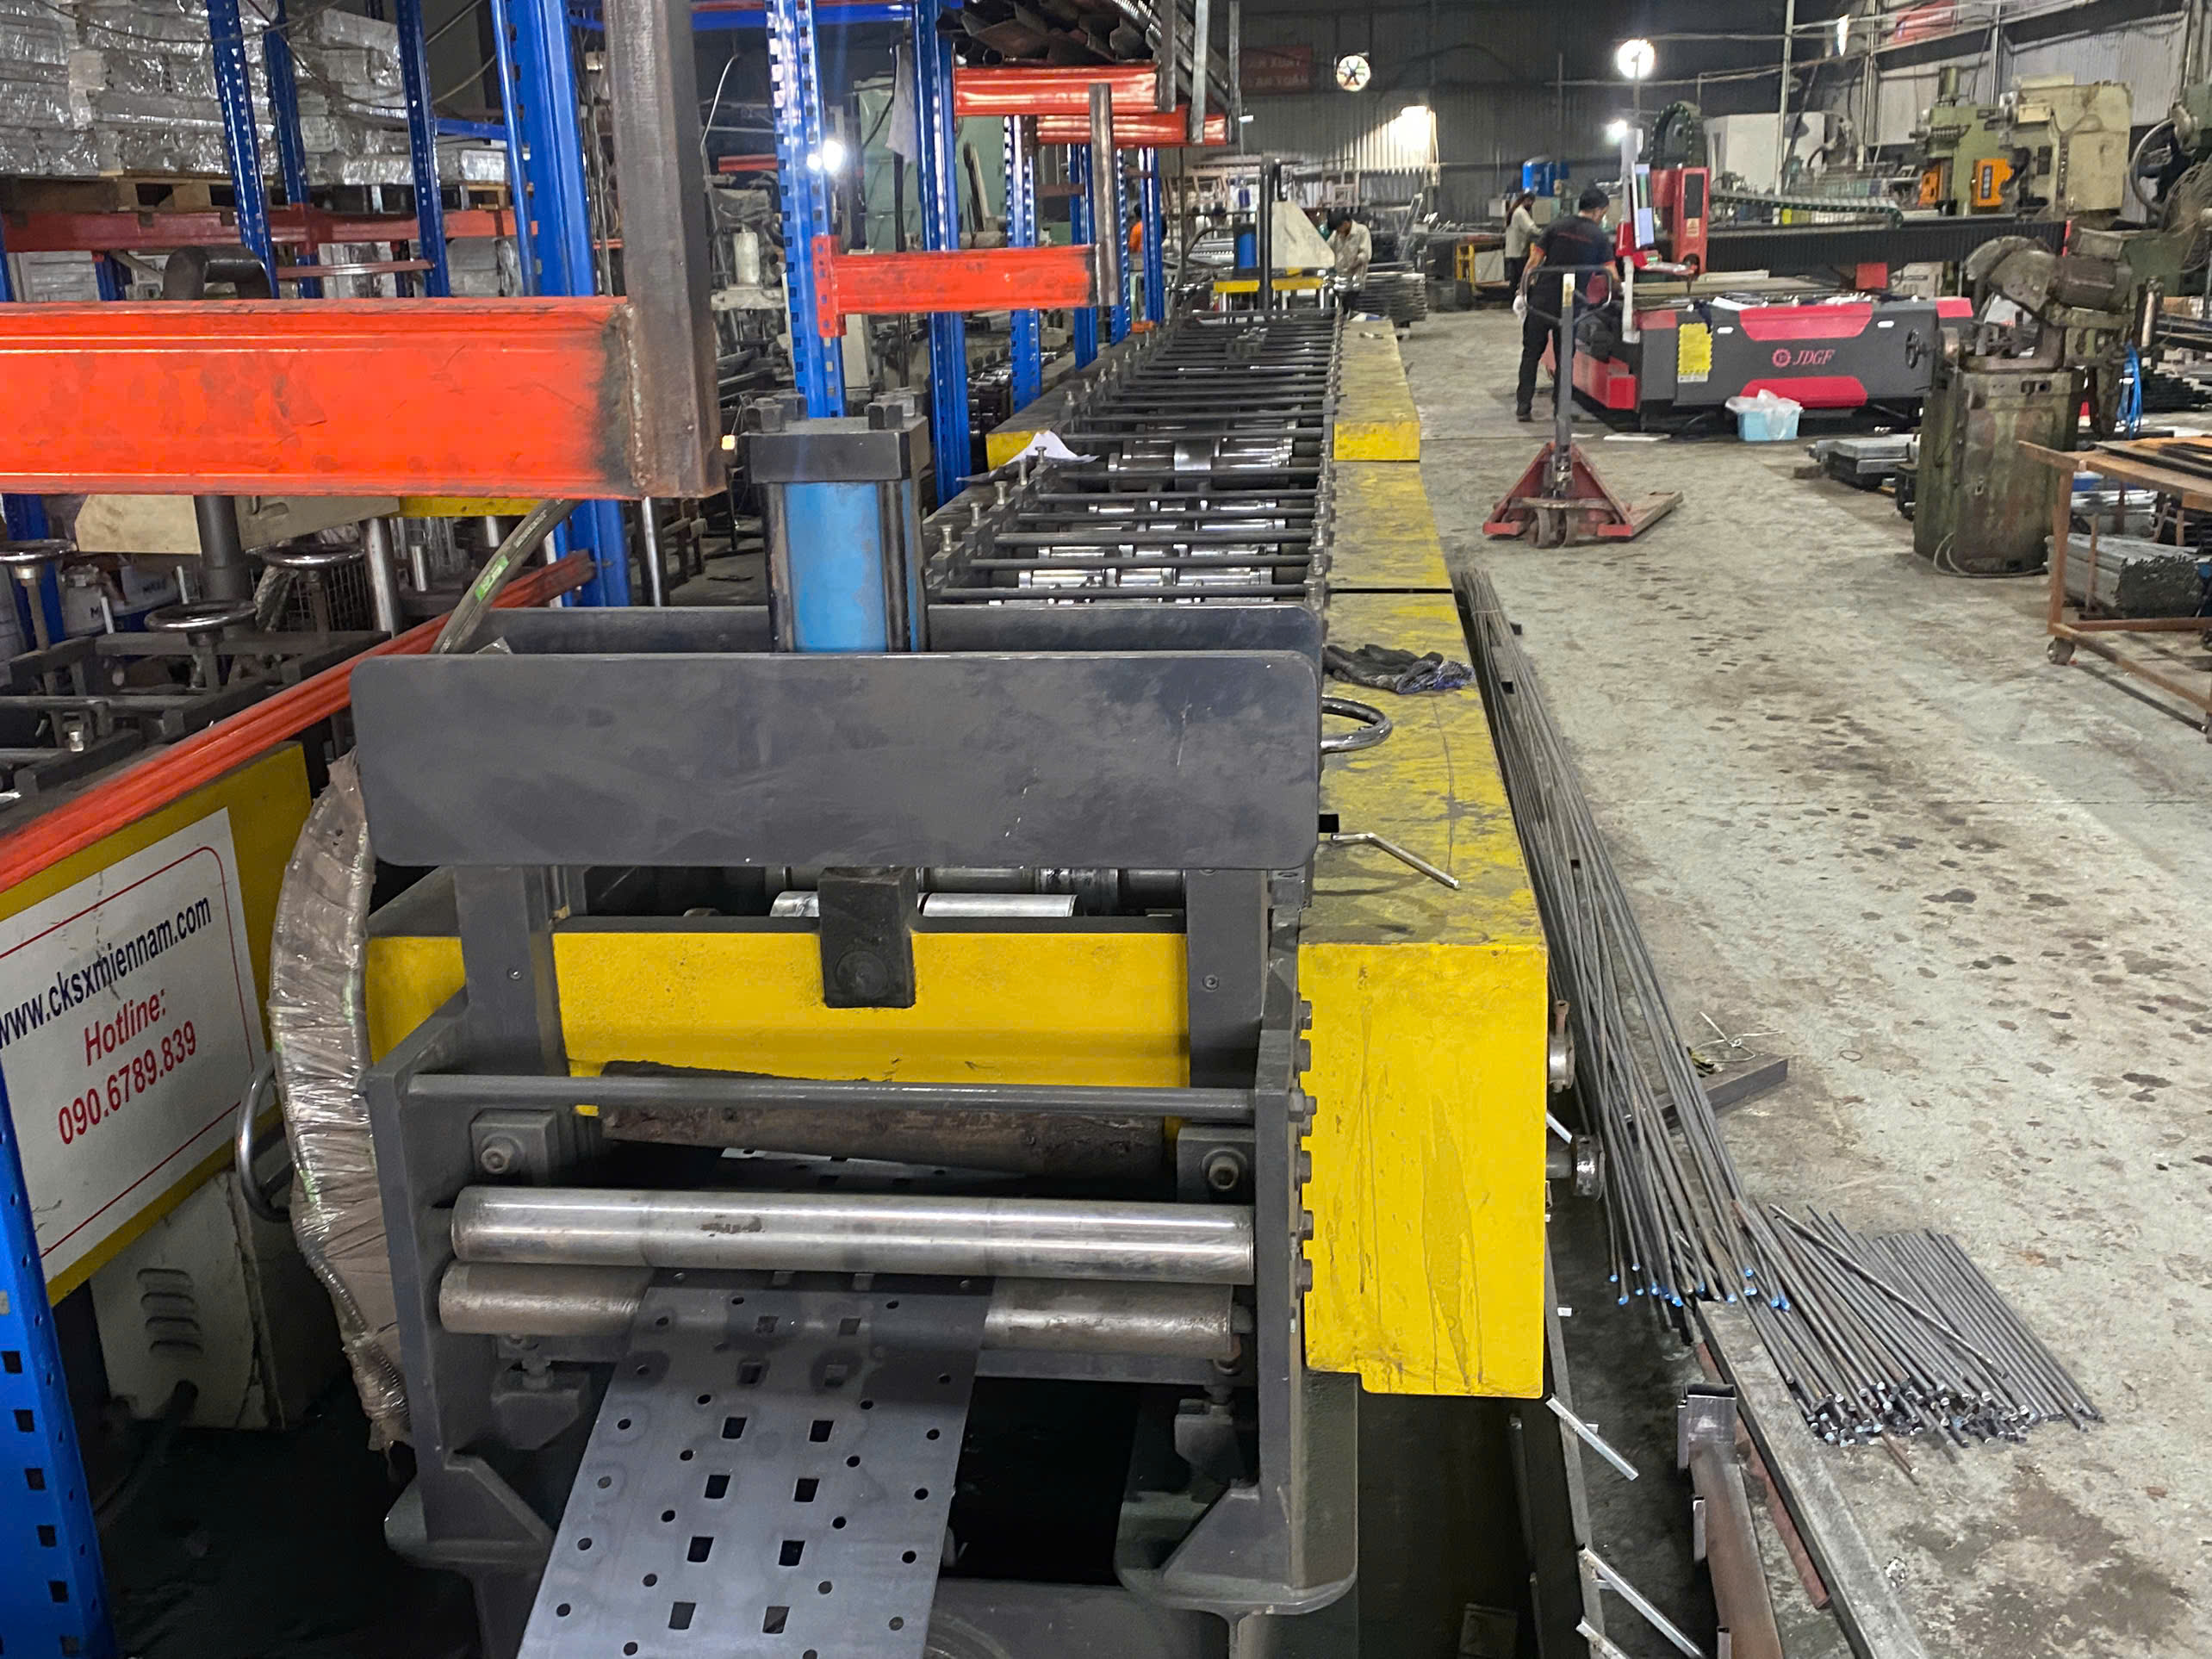
Data integrity is the foundation of any credible scorecard. If your data is messy, your scores are meaningless. I have seen scorecards that looked great on paper but fell apart during a supplier review because the OTD data counted partial shipments as "on time." That is not honest measurement.
Hard Data: Your ERP and Quality Systems
Your ERP system 8 is the backbone. Pull goods-received records to calculate on-time delivery rate. Cross-reference purchase order dates with actual receipt dates. Make sure you define "on time" clearly — does it mean the agreed ship date, the dock receipt date, or something else? Ambiguity here creates arguments.
For quality, pull incoming inspection data. If you use a dimensional inspection process 9 at goods receipt, those measurements feed directly into PPM calculations. Corrective action reports and their closure timelines give you response discipline scores. PPAP files — especially for new part introductions — tell you about operational maturity.
Freight invoices are an overlooked goldmine. When a supplier ships late and you pay for air freight, that invoice is hard evidence of delivery failure. Log every premium freight event and tie it to the supplier's scorecard.
Soft Data: Stakeholder Feedback
Numbers do not capture everything. Your engineers know which suppliers struggle with drawing interpretation. Your quality team knows which suppliers send clean Certificates of Conformance versus sloppy ones. This feedback matters — but it must be structured.
I recommend a simple quarterly survey with three to five questions, scored on the same five-point scale as the rest of the scorecard. Questions might include:
- How responsive is this supplier to engineering change requests?
- How accurate and complete are their shipping documents?
- How proactive is the supplier in flagging risks or suggesting improvements?
Combine hard ERP data with structured stakeholder input. This hybrid approach is the most reliable way I have found to build a scorecard that survives scrutiny during a quarterly business review.
Integrating Real-Time Production Data
For advanced programs, consider asking your stamping suppliers to share press monitoring data — tonnage signatures, stroke counts, and die maintenance logs. This gives you predictive insight into tooling life cycle management and part quality before batches even ship. Not every supplier will share this, but the best ones will, and it becomes a powerful differentiator in your supplier verification and sourcing strategy.
Reconcile all data sources before scoring. Clean out duplicate POs, correct mismatched part numbers, and flag anomalies. A scorecard built on dirty data does more harm than good.
How Often Should I Review and Update My Supplier Scorecards to Stay Effective?
During a recent project managing a stamped trailer-hitch mount program, we discovered that a quarterly-only review cycle nearly missed a progressive die wear issue. The supplier's PPM had been climbing for two months, but nobody noticed until the quarterly check. By then, three shipments of out-of-spec parts had already landed at the client's warehouse.
Review critical and high-risk stamping suppliers monthly, standard suppliers quarterly, and revisit the scorecard structure itself every six months to retire outdated metrics, adjust weights, and incorporate new risks like sustainability requirements or changes in production capacity assessment.
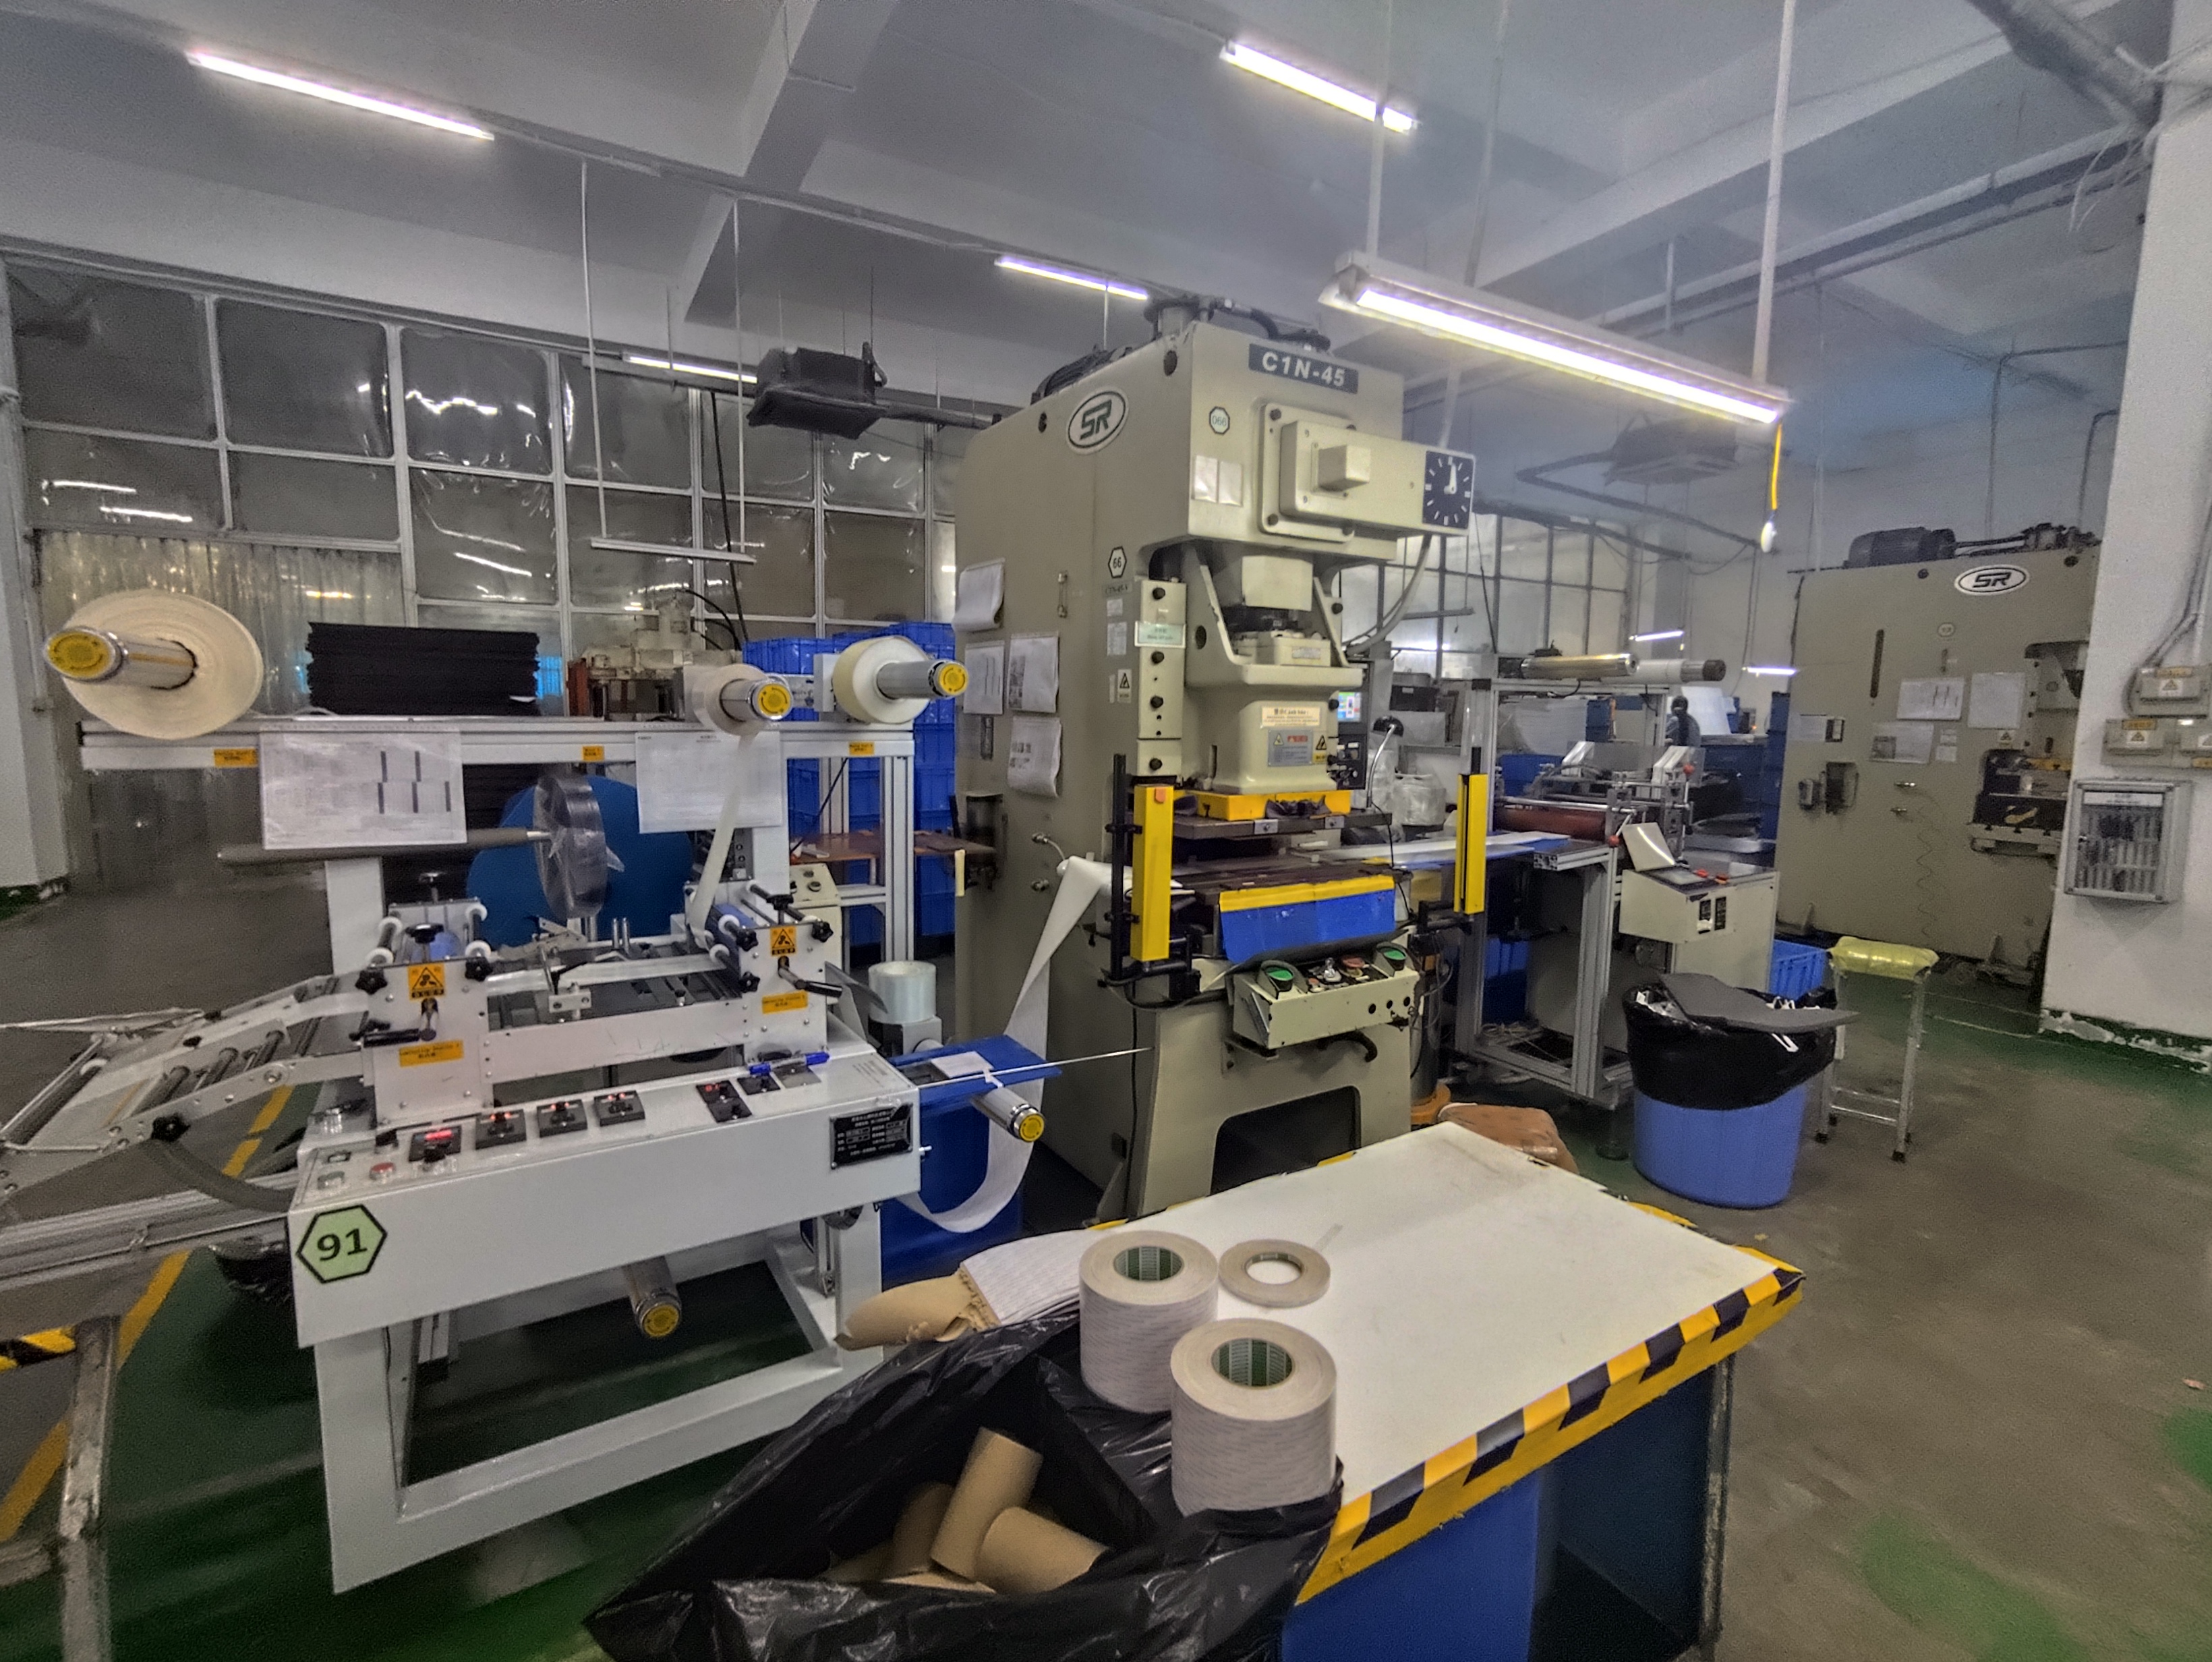
The review cadence you choose signals how seriously you take supplier performance. Too infrequent, and problems fester. Too frequent, and you drown in meetings that produce no action. Here is what works in practice.
Recommended Review Cadence
| Supplier Tier | Scorecard Review | Structure Review | Who Attends |
|---|---|---|---|
| Critical / High-Risk | Monthly | Every 6 months | Procurement, Quality, Engineering, Supplier |
| Preferred | Quarterly | Annually | Procurement, Quality, Supplier |
| Transactional | Quarterly or Semi-Annually | Annually | Procurement |
Monthly reviews for critical stamping suppliers do not need to be long meetings. A 30-minute call walking through the scorecard data is enough. The goal is to catch trends — rising PPM, slipping OTD, delayed corrective actions — before they become crises.
The 48-Hour Rule
Share the scorecard with the supplier at least 48 hours before the review meeting. This gives them time to prepare responses and gather their own data. Walking a supplier through a scorecard they have never seen before creates defensiveness, not collaboration. When both sides come prepared, the conversation shifts from blame to problem-solving.
Updating the Scorecard Structure
Metrics that mattered last year may not matter this year. If you have integrated a new material waste reduction initiative or your end-customer now requires ESG reporting, your scorecard needs to reflect that. I recommend a formal structure review every six months for critical suppliers and annually for others.
During these structure reviews, ask three questions:
- Are any current metrics no longer driving useful decisions?
- Are there new risks (tooling changes, capacity shifts, regulatory updates) that we are not tracking?
- Do the weights still reflect our sourcing priorities?
For example, if you have begun tracking recycled metal content or scrap recovery rates as part of a circularity initiative, those metrics deserve a place on the scorecard — even if at a low initial weight.
Co-Creating Improvement Plans
The scorecard is not a weapon. It is a development tool. After each review, identify one to two improvement actions with the supplier. Set clear owners and deadlines. Track those actions on the next scorecard review. This turns the scorecard into a living document that drives continuous improvement rather than a static report card.
When we work with suppliers across Vietnam and other Southeast Asian countries, this collaborative approach builds trust. Suppliers who see the scorecard as fair and transparent are far more willing to invest in process controls, PPAP discipline, and proactive communication. And that is exactly what our U.S. clients need — suppliers who surface risk early and deliver right the first time.
Conclusion
A well-built supplier scorecard for stamping parts sourcing replaces gut instinct with data, protects your production schedule, and turns supplier management into a competitive advantage. Start with the four lenses, weight what matters, and review consistently.
Frequently Asked Questions
What Metrics Should I Include in My Stamping Supplier Scorecard?
When we onboarded a new bracket supplier in Vietnam last year, the first question from our U.S. client was not about price — it was about how we planned to measure that supplier's quality performance metrics over the first six months.
How Do I Weight Quality, Delivery, and Communication in My Scoring System?
A lesson we learned the hard way: giving cost a 40% weight almost cost a client their largest end-customer contract. The "cheapest" supplier delivered late three times in a quarter and triggered premium freight charges that wiped out all savings.
What Data Sources Can I Use to Track My Suppliers' Performance Accurately?
One of the most common frustrations I hear from U.S. purchasing managers is this: "I know my supplier is underperforming, but I cannot prove it with data." That gap between intuition and evidence is exactly what a good data collection strategy solves.
Footnotes
1. Provides a comprehensive overview of the metalworking process described in the article. ↩︎
2. Defines the quality management process for identifying and eliminating causes of non-conformities. ↩︎
3. Stable, authoritative overview of the automotive quality standard, avoiding 403 errors on the primary domain. ↩︎
4. Reliable encyclopedic definition of DFM principles to replace the broken ASME resource. ↩︎
5. Official EPA hub for pollution prevention case studies, replacing the specific broken sub-page. ↩︎
6. Defines the business documentation used to track incoming shipments and delivery performance. ↩︎
7. ISO standard for life cycle costing, which defines the total cost of ownership framework. ↩︎
8. Explains the software systems used to manage core business processes and supplier data. ↩︎
9. Authoritative source on the science of measurement for physical dimensions in manufacturing. ↩︎