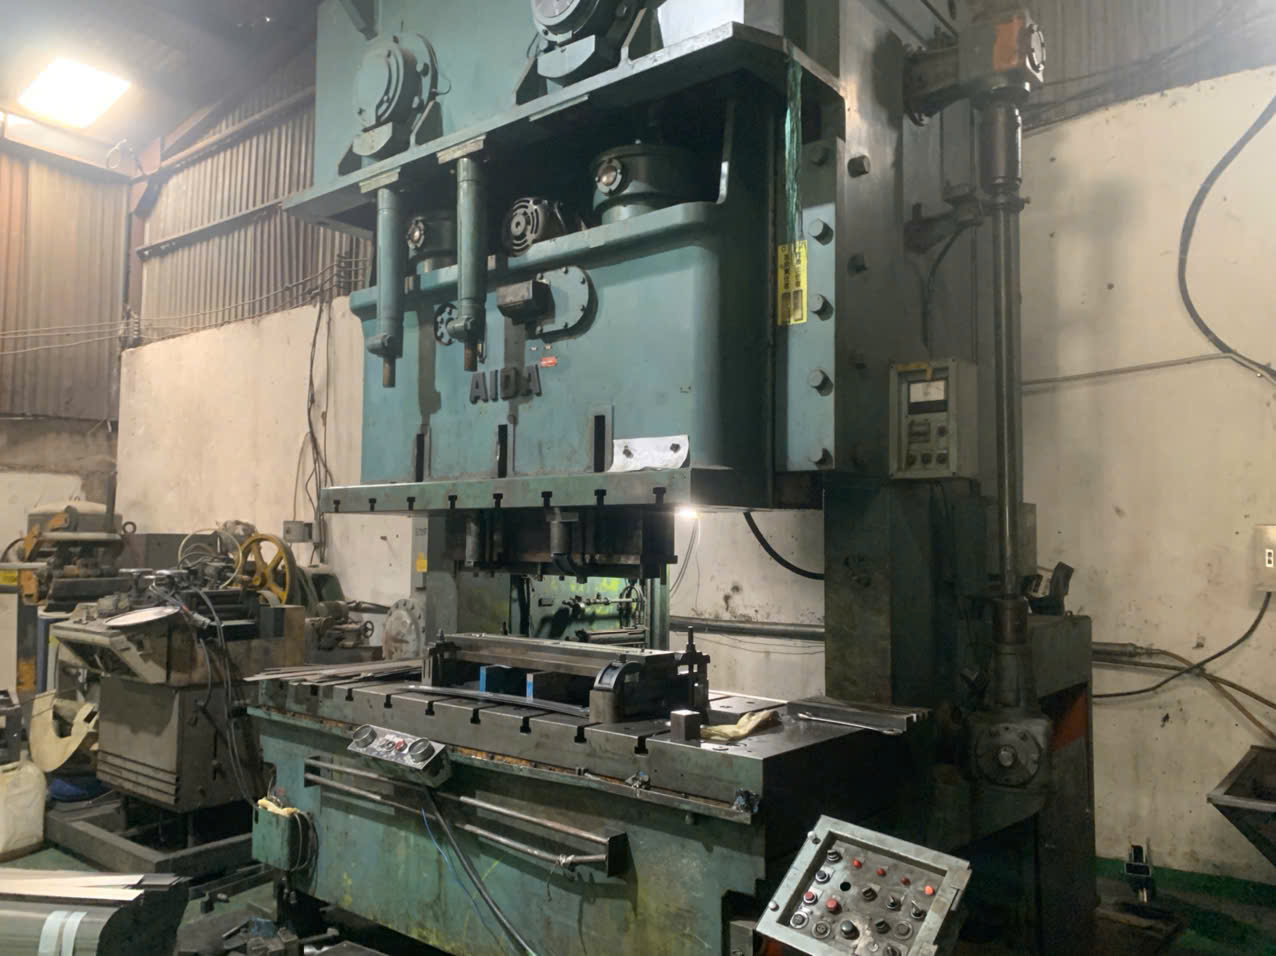
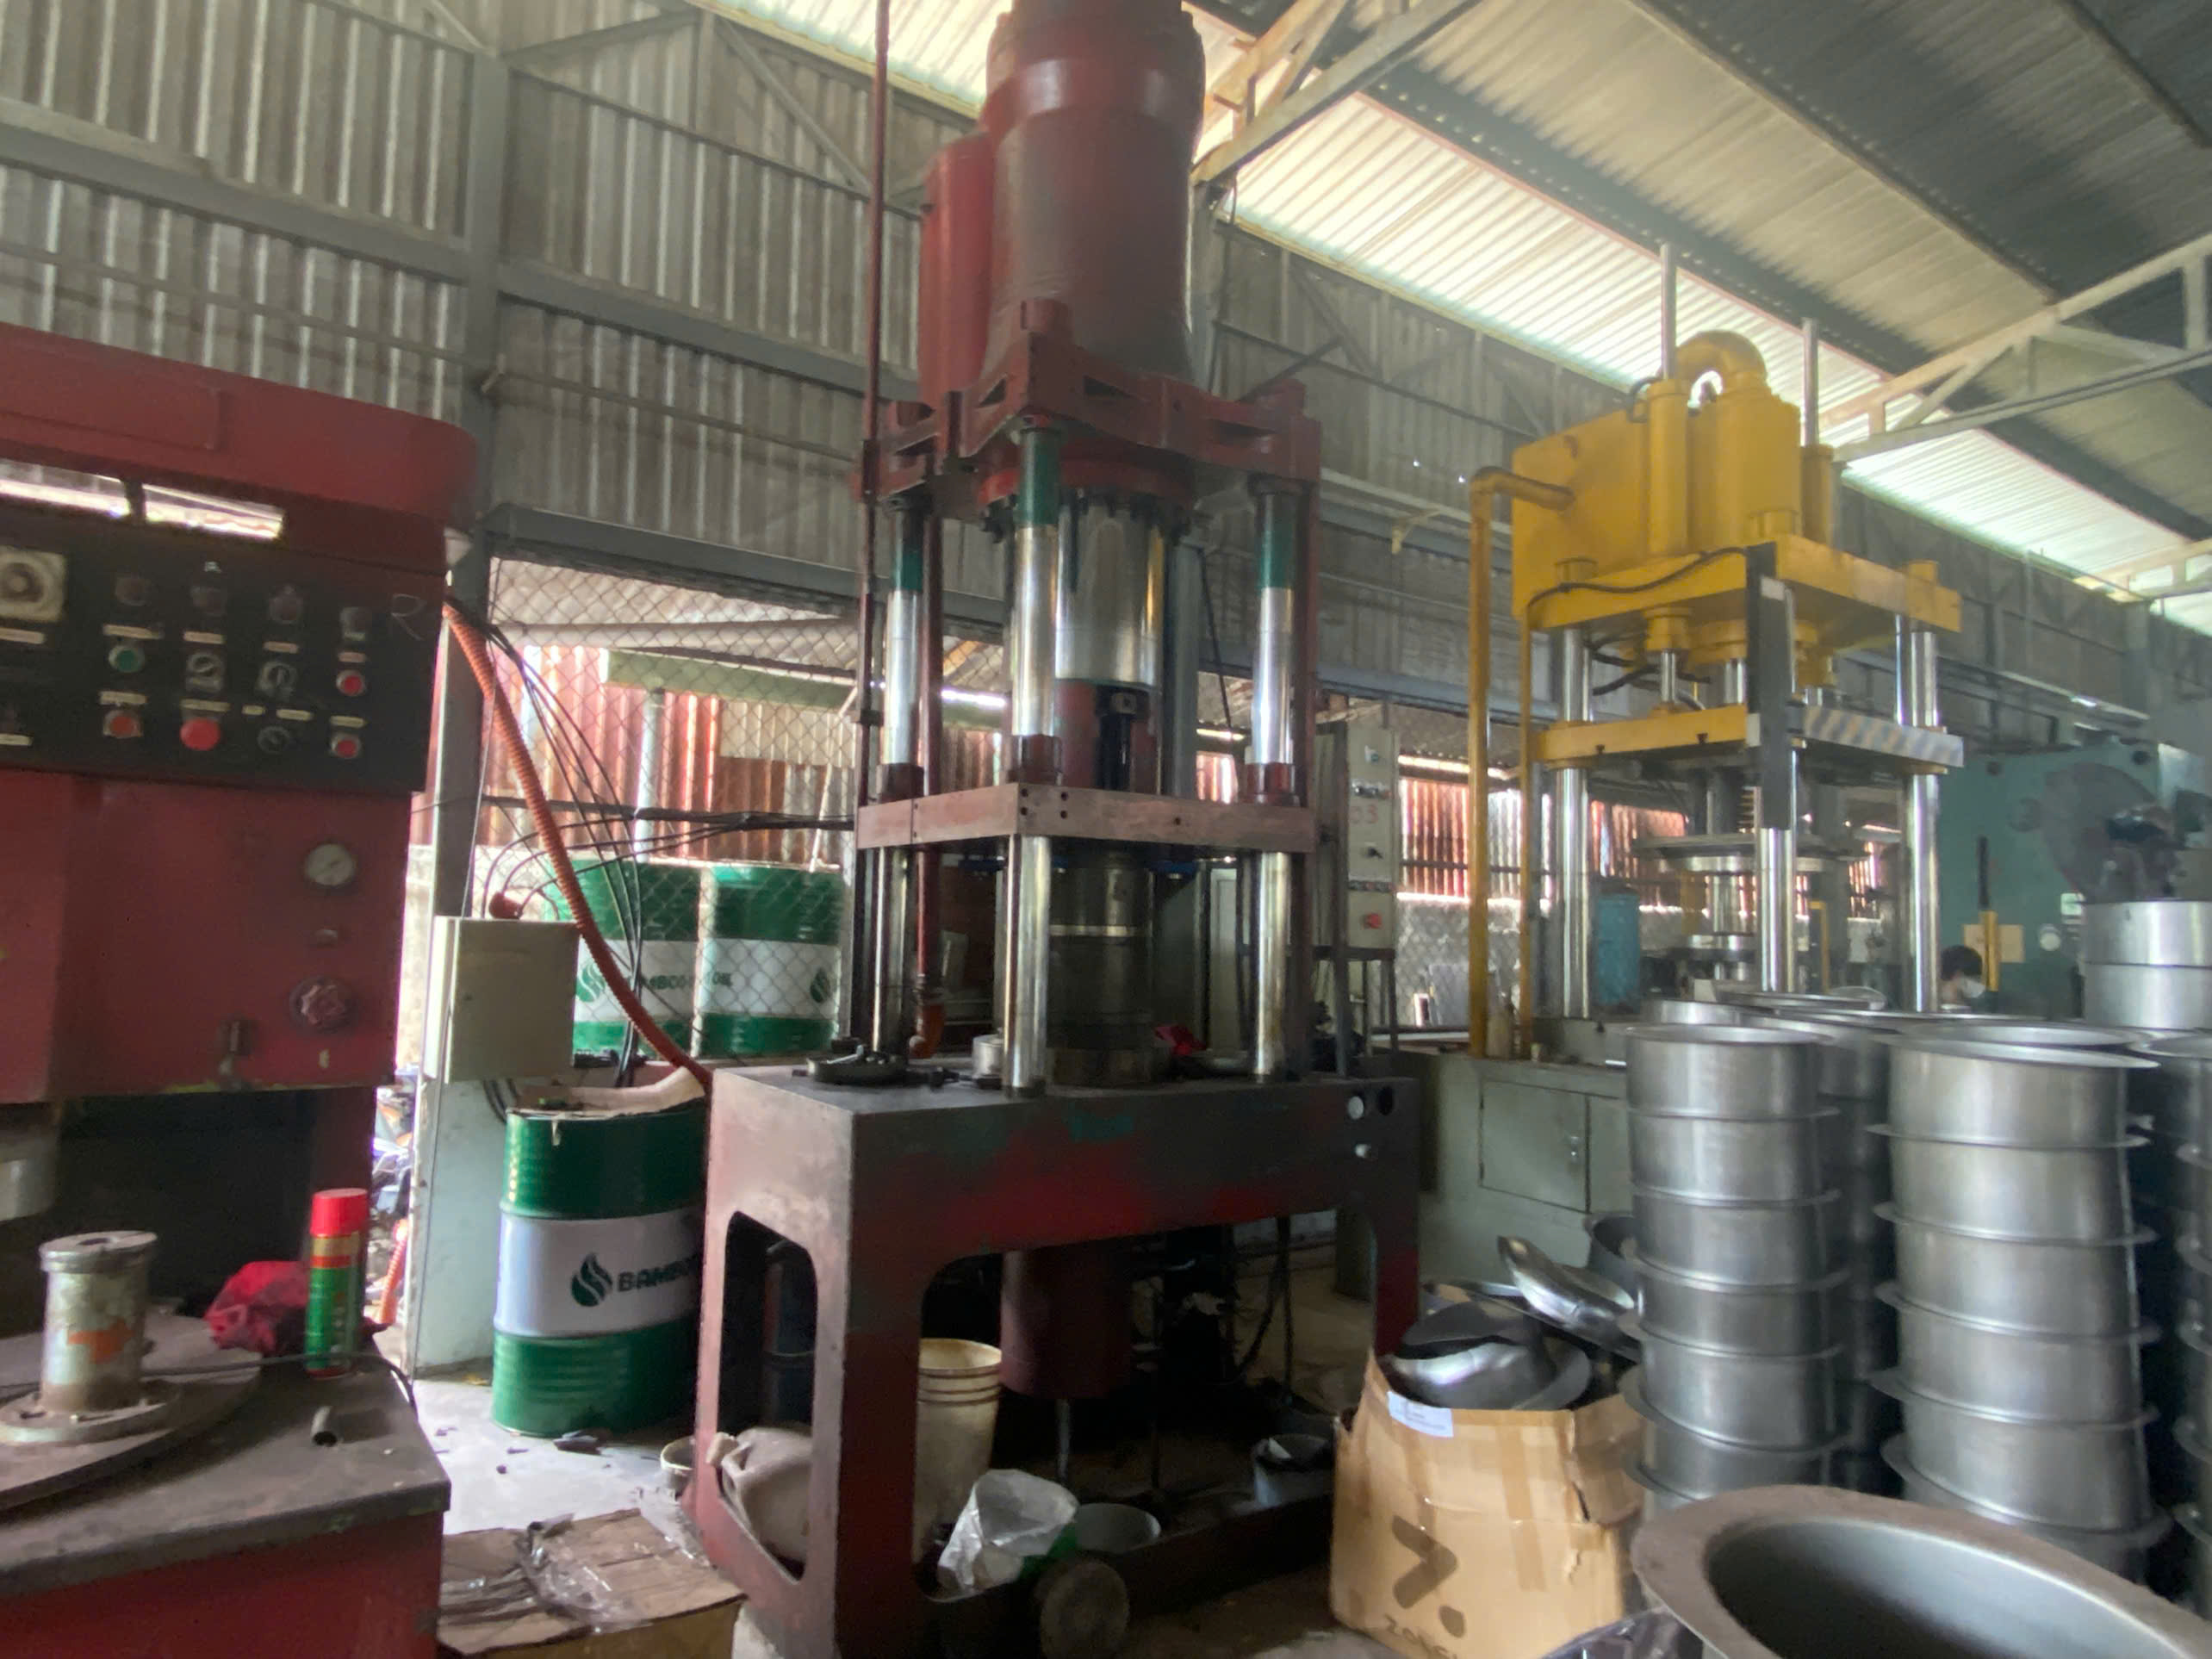
Statistical Process Control (SPC) for stamping parts saved one of our bracket projects from a costly recall. Without it, dimensional drift hides quietly until parts fail at your assembly line.
Statistical Process Control for stamping parts is implemented by identifying critical dimensions, measuring them at set intervals with calibrated gauges, plotting the data on control charts, calculating capability indices like Cpk, and triggering corrective actions whenever the process drifts outside statistical limits.
That is the short answer. But if you buy stamped brackets, clips, or mounting components from Asia, you need to know how this works in practice. Let me walk you through it step by step.
What Steps Should I Expect When My Supplier Sets Up SPC for Stamping Production?
A few years back, our team in Vietnam took over a stamped mounting clip project that had a 12% rework rate. The fix was not new tooling. It was disciplined SPC setup.
A proper SPC setup follows five steps: define Critical-to-Quality dimensions from your drawing, run a short-term capability study, establish control limits from baseline data, install measurement points at key stamping stations, and train operators on chart reading and reaction plans.
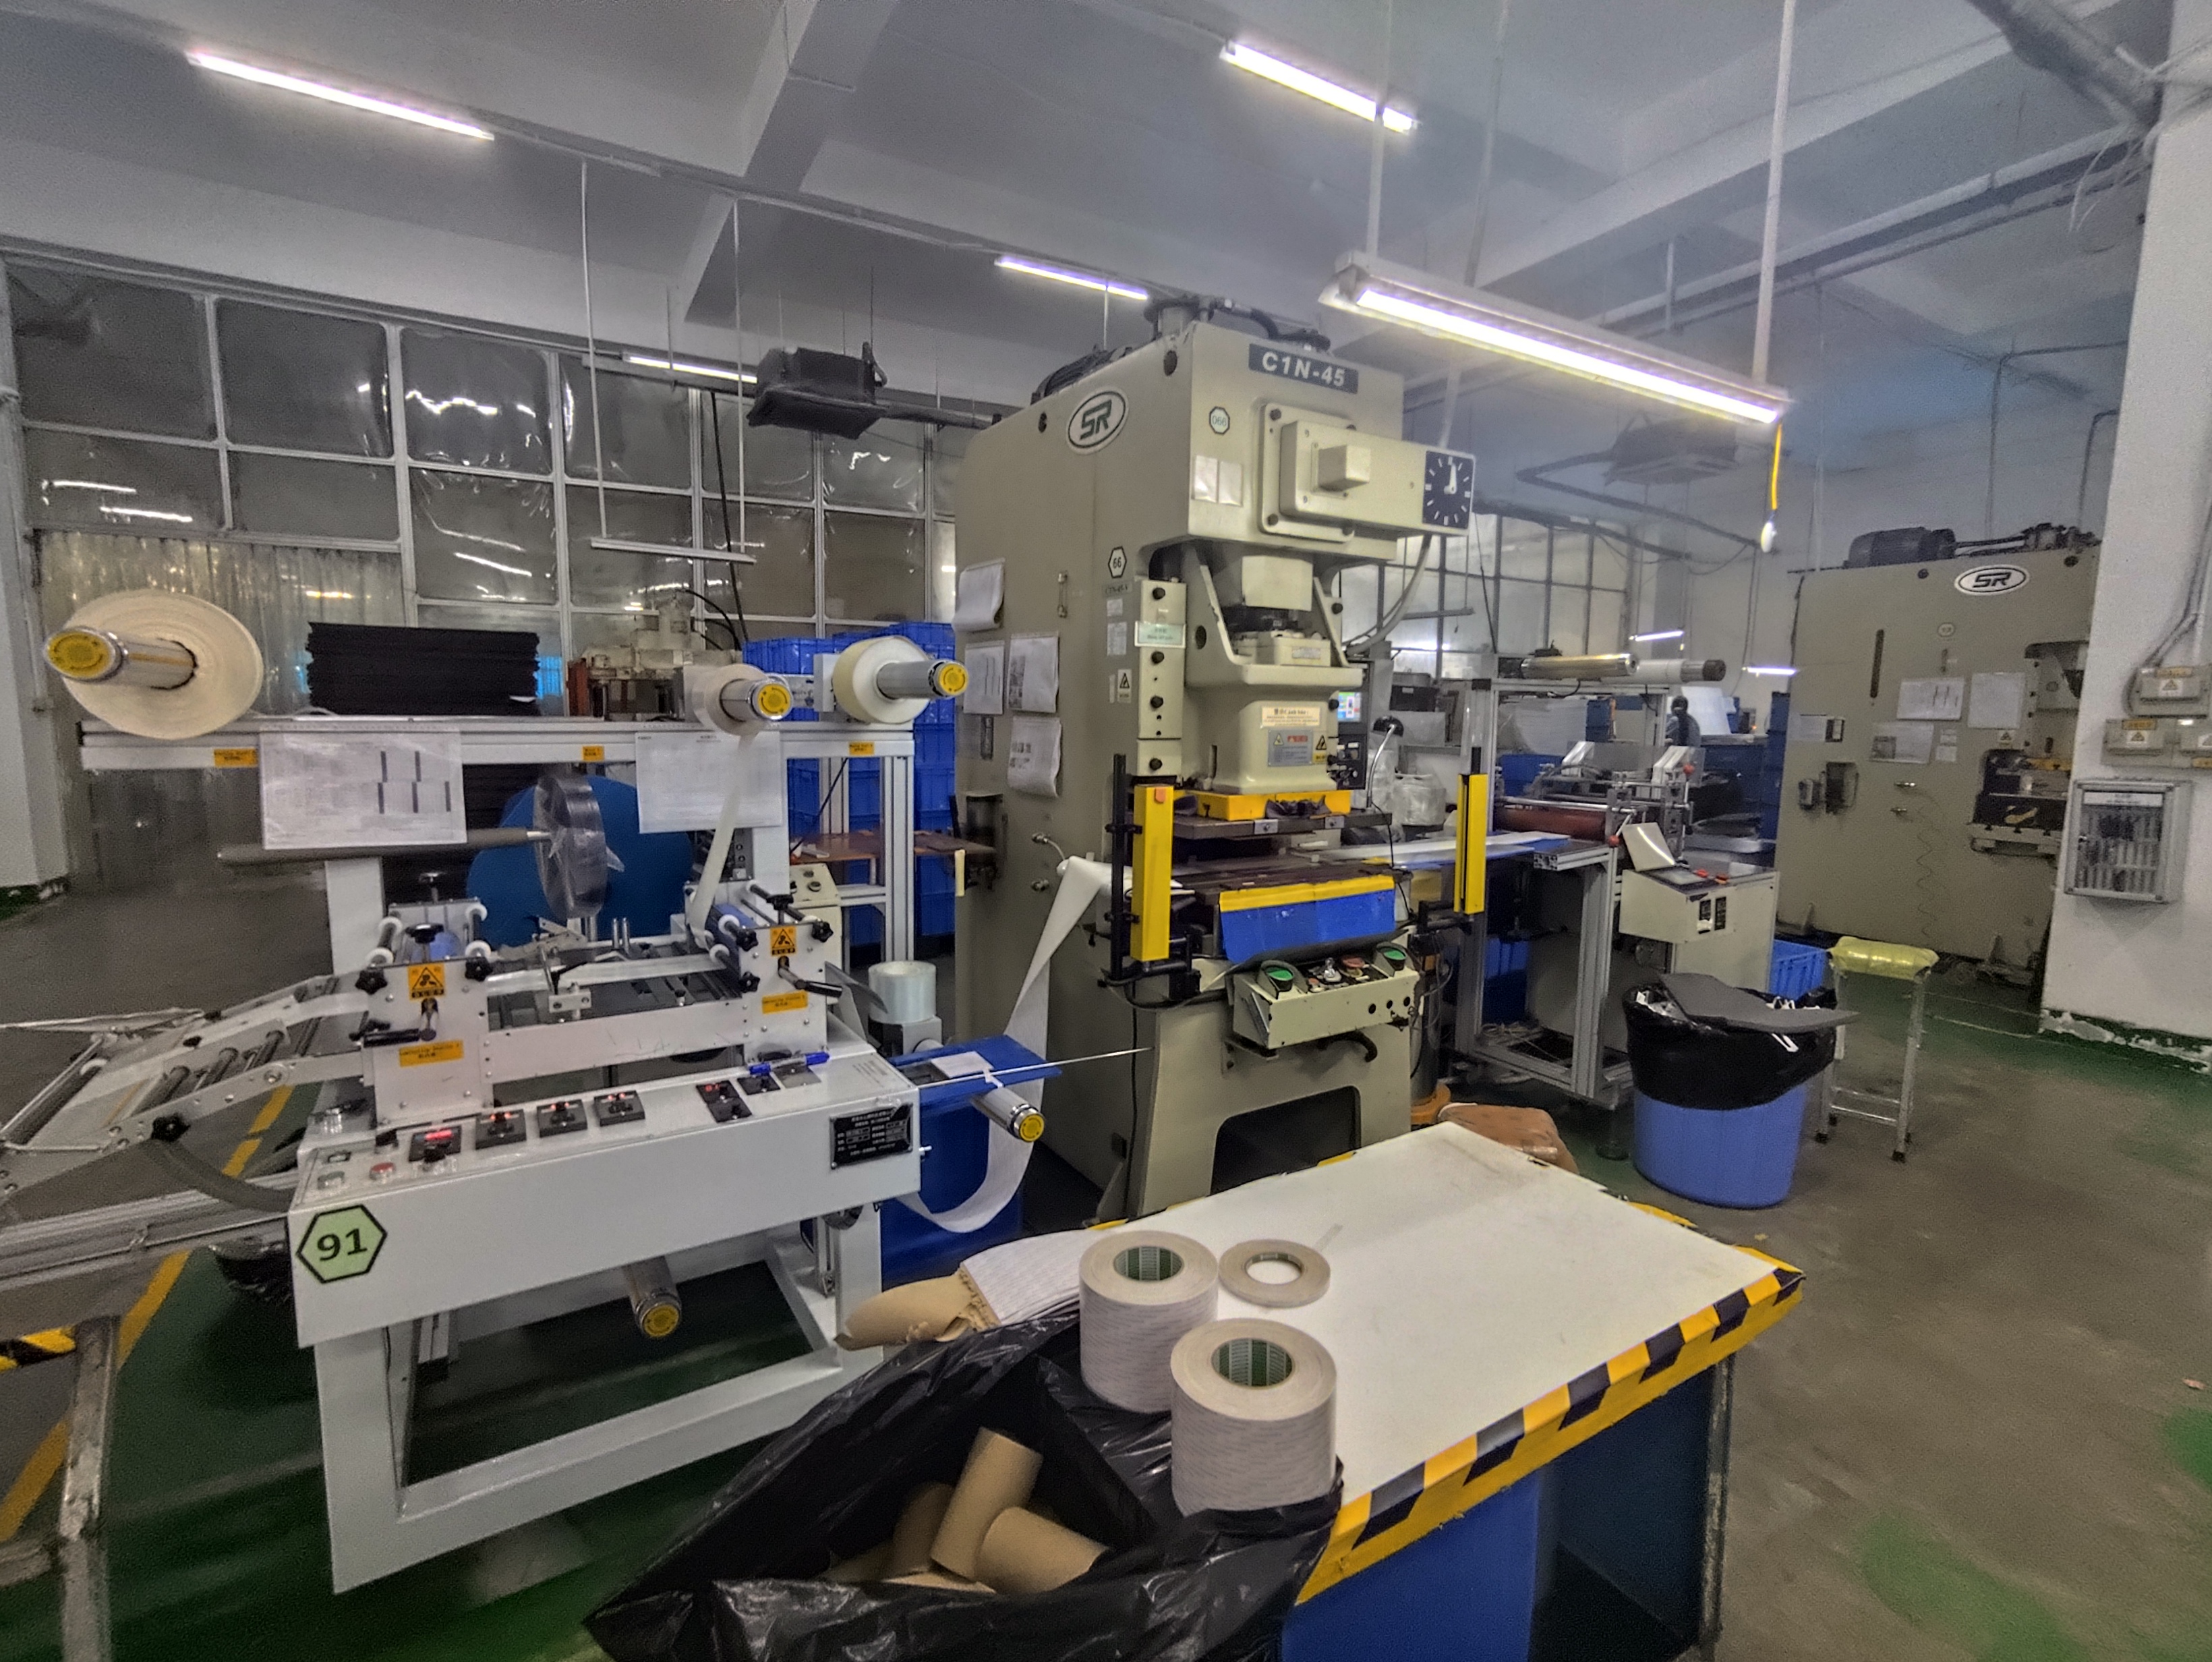
When we audit stamping suppliers for our U.S. clients, we check each of these steps in order. Skipping any one of them makes the whole system unreliable. Here is what each stage should look like.
Step 1: Define What Matters
The supplier should start with your drawing, not their opinion. Critical-to-Quality (CTQ) features come from the print, PPAP requirements 1, and your assembly needs. For a zigzag-profile bracket with punched oval holes, that usually means hole position, bend angle, and flange flatness. We always ask clients to confirm the CTQ list before the first production run. This avoids the classic problem where a supplier monitors easy dimensions and ignores hard ones.
Step 2: Run a Capability Study
Before mass production, the supplier should run a short capability study 2. This typically means 25 subgroups of 3 to 5 parts each, produced under normal conditions. From this data, they calculate Cp and Cpk 3. If Cpk is below 1.33, the process is not ready. Full stop.
Step 3 to 5: Limits, Gauges, and Training
| Step | What Happens | What You Should See as Evidence |
|---|---|---|
| Set control limits | Limits calculated at ±3 sigma from baseline data | A documented control plan with limit values |
| Install measurement points | Gauges, CMM, or vision systems placed at key stations | A measurement system layout or inspection flow chart |
| Train operators | Staff learn run rules and reaction plans | Training records and a posted reaction plan at the press |
One more thing. Control limits are not permanent. They must be recalculated whenever tooling, material lots, or press setups change. In our experience, suppliers who skip this recalculation produce the most surprise defects.
Which Critical Dimensions Should I Require My Supplier to Monitor with SPC?
Here is a trade-off we weigh on every custom parts project: monitoring everything is expensive, but monitoring too little is dangerous. The answer lies in picking dimensions that predict failure.
For stamped parts, require SPC monitoring on material thickness, hole diameter and position, bend angle, flatness, and any feature critical to assembly fit. Prioritize dimensions with tight tolerances, high springback sensitivity, or a history of nonconformance in similar parts.

Not all dimensions deserve equal attention. Our engineers rank features by risk before writing the control plan. Below is the logic we apply to typical stamped brackets and clips, like the ones we source for cabinetry and machinery clients.
High-Priority Dimensions for Stamped Parts
| Dimension | Why It Matters | Typical Monitoring Method |
|---|---|---|
| Bend angle | Springback causes drift as dies wear | Angle gauge or vision system, X-bar R chart |
| Hole diameter | Punch wear enlarges or distorts holes | Pin gauge or CMM, X-bar R chart |
| Hole position | Affects assembly fit directly | CMM or optical measurement |
| Flatness | Warping causes mounting failures | Surface plate with feeler gauge or laser scan |
| Material thickness | Incoming lot variation shifts everything | Micrometer at material receiving |
Watch for Correlated Features
Some dimensions move together. Springback on a bend often shifts a hole position at the same time. A univariate chart on each feature can look fine while the combination is failing. For parts with multiple correlated critical dimensions, ask whether your supplier uses multivariate SPC methods such as Hotelling T² charts 4. Most stamping shops do not, and that is acceptable for simple parts. But for complex multi-bend brackets, correlated monitoring catches problems that single charts miss.
Match the Chart to the Feature
X-bar R charts 5 work well for subgroups of 3 to 5 parts. X-bar S charts suit larger subgroups. For go/no-go checks like burr presence, attribute charts such as p-charts apply. We specify the chart type in the control plan so there is no ambiguity later.
How Can I Verify My Supplier's SPC Data Is Accurate and Reliable?
A purchasing manager from Texas once told me his previous supplier sent flawless control charts for six months, then shipped a container of out-of-spec clips. The charts were real. The gauges were not calibrated. We rebuilt his verification process from scratch.
Verify SPC data by requesting Gage R&R studies, checking gauge calibration records, comparing supplier measurements against independent third-party inspection, reviewing raw data files instead of summary charts, and auditing whether data collection timestamps match actual production schedules.
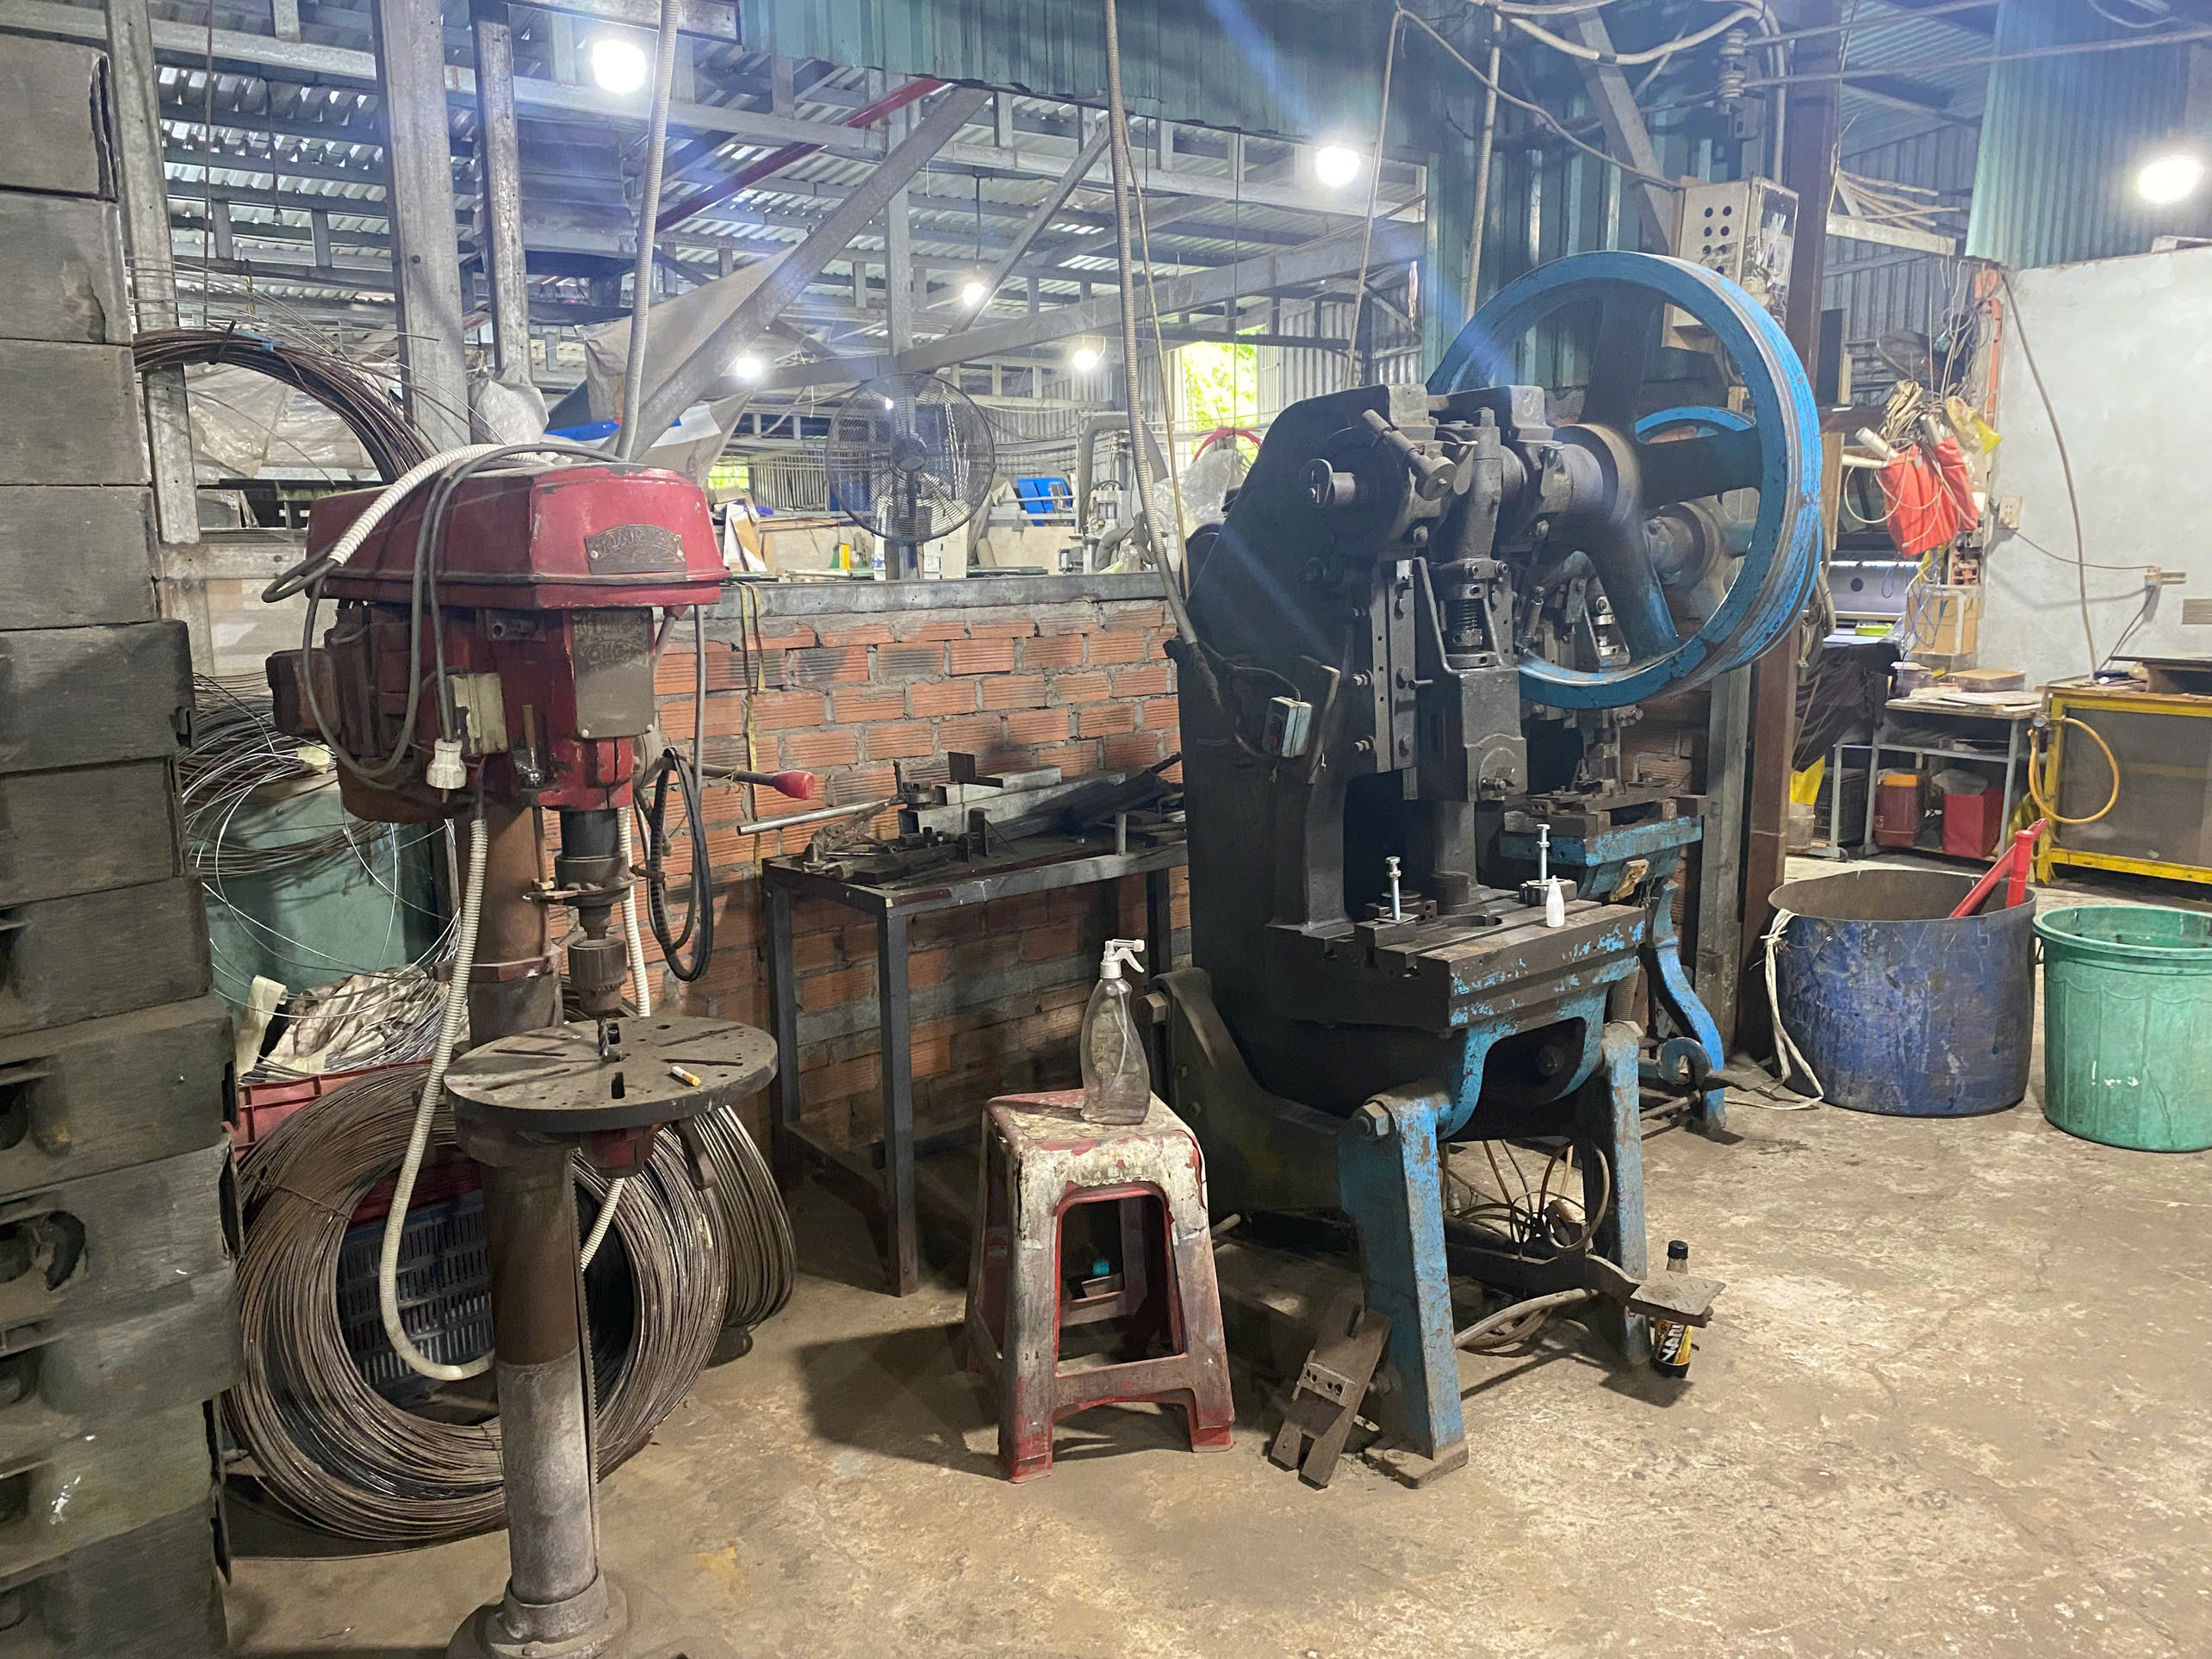
Beautiful charts prove nothing on their own. The data behind them must be trustworthy. Here is the verification approach we use during supplier audits across Vietnam, Taiwan, and other Asian sourcing regions.
Start with the Measurement System
Ask for a Gage R&R (Repeatability and Reproducibility) study. Gage R&R study 6 This proves the measurement system itself is capable. If gauge variation eats more than 10% of the tolerance, the SPC data is questionable regardless of how it looks. Between 10% and 30% may be acceptable depending on the feature. Above 30% means the gauge cannot do the job.
Then check calibration. Every gauge, micrometer, and CMM should have a current calibration sticker 7 traceable to a national standard. During our on-site audits, we physically check stickers against the calibration log. Mismatches happen more often than you would expect.
Cross-Check the Data Itself
We use several practical tests:
- Request raw measurement files, not just summary charts. Fabricated data often shows unnatural patterns, like values that never repeat or digits that cluster suspiciously.
- Compare timestamps to production records. Data logged at midnight when no shift was running is a red flag.
- Send sample parts to an independent lab. If third-party CMM results disagree with supplier charts, dig deeper.
- Watch a live measurement during an audit. Operators who fumble with the gauge probably do not measure daily.
Automated Collection Reduces Risk
In-die sensors, inline vision systems, and automated gauges log data directly to software. This removes manual transcription, which is where most errors and most fabrication occur. When we help U.S. clients select stamping suppliers, automated data collection is a strong plus in our scoring. It does not guarantee honesty, but it makes dishonesty much harder.
What SPC Reports Should I Request to Ensure Consistent Quality Across Production Runs?
The lesson that shaped our reporting standard came from a repeat order gone wrong. The first run was perfect. The second run, made four months later, used a new die insert and drifted badly. Nobody compared the runs. Now we always do.
Request four core SPC reports: control charts for each CTQ dimension per run, a Cpk capability summary per lot, an out-of-control action log with corrective actions, and a long-term trend report comparing capability across runs to reveal die wear and process drift.
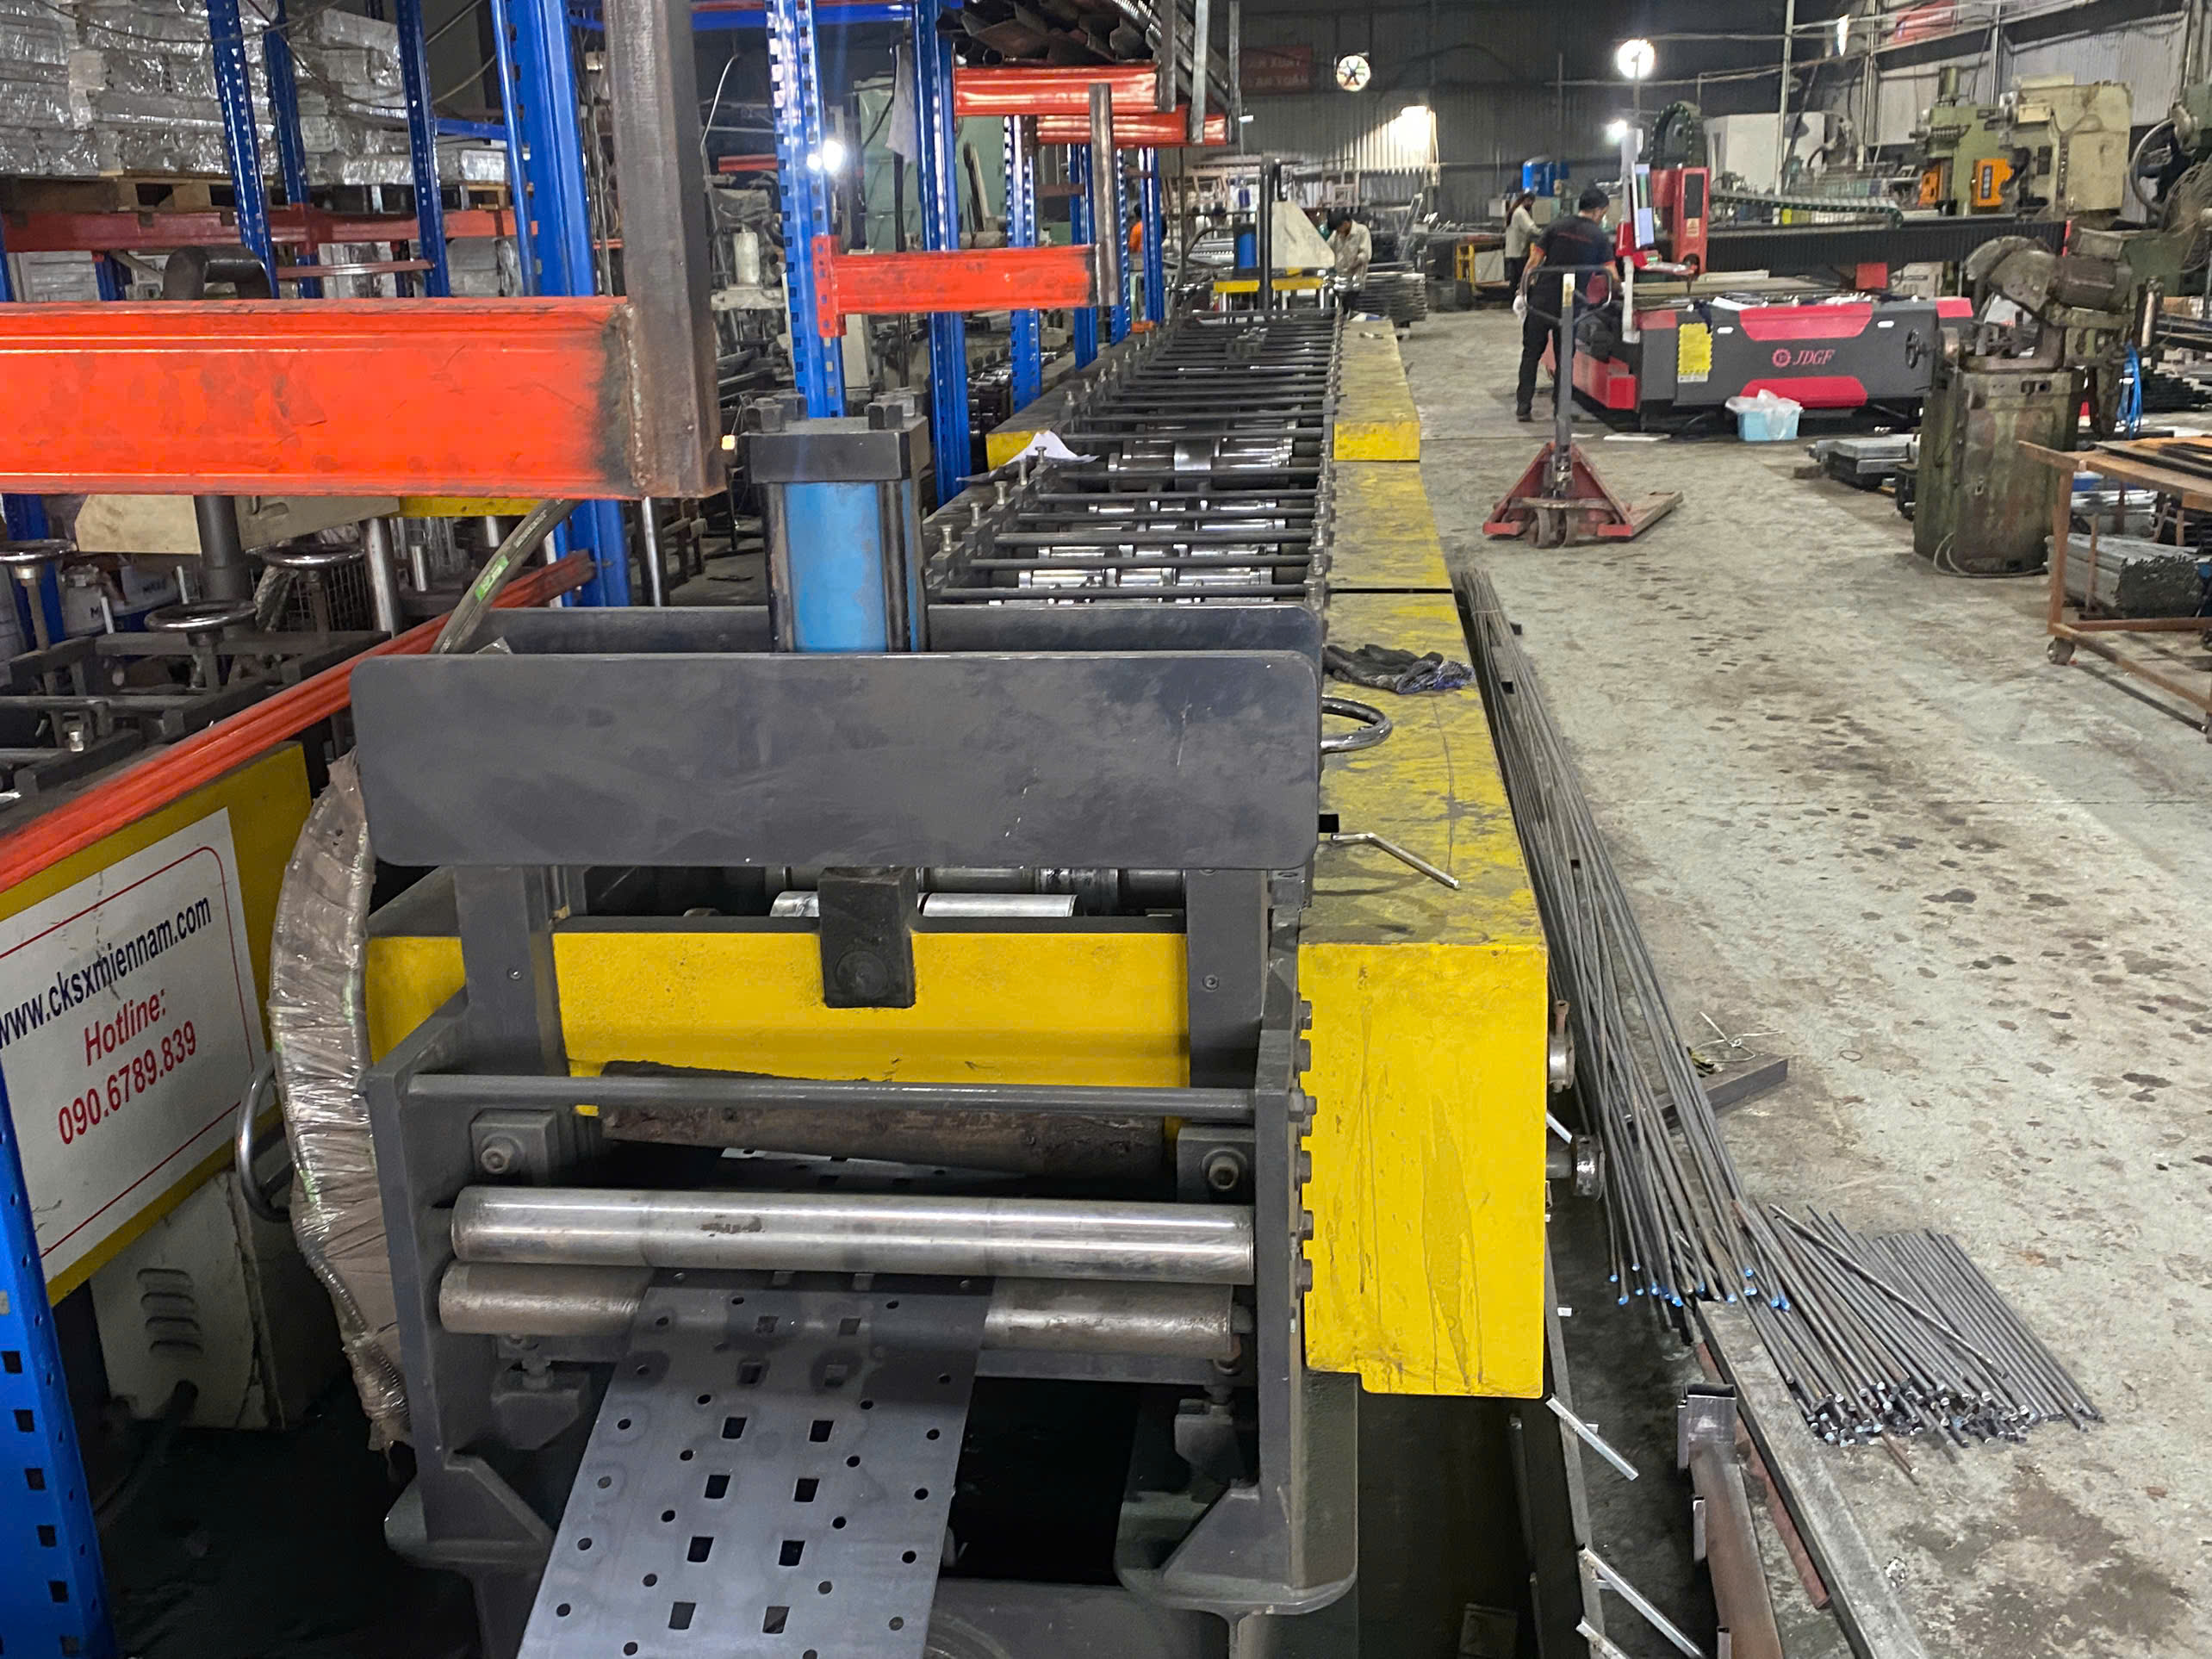
Reports are your window into a factory thousands of miles away. But you must ask for the right ones, at the right frequency, in a format your team can actually read. Here is the reporting package we set up for our export clients.
The Core Reporting Package
| Report | Frequency | What It Tells You |
|---|---|---|
| Control charts (X-bar R) | Every production run | Whether the process stayed stable during your order |
| Cpk capability summary | Every lot shipped | Whether the process can reliably meet your tolerances |
| Out-of-control action log | Every run, even if empty | How the supplier reacted when signals appeared |
| Long-term trend report | Quarterly or per repeat order | Die wear, tool degradation, and slow drift across runs |
| First article and last article comparison | Every run | Whether the process shifted during the run itself |
Read the Trend, Not Just the Snapshot
A single run with Cpk of 1.45 looks fine. But if the previous three runs were 1.80, 1.65, and 1.55, the trend is telling you something. That downward slope usually means die wear. Smart suppliers correlate this trend data with tooling maintenance and replace punches or inserts before Cpk crosses the failure line. This shifts maintenance from calendar-based guessing to condition-based prediction. We ask our stamping partners to flag any CTQ dimension whose Cpk drops across two consecutive runs, even if both runs still pass.
Set the Format Upfront
Agree on report format before the first order. We standardize on digital files with raw data attached, so our clients' quality engineers can re-run the statistics themselves. A PDF chart with no underlying data is a summary, not evidence. Also define the escalation rule in writing: what Cpk value triggers a hold, who gets notified, and within how many hours. When these rules exist before problems occur, nobody argues during a crisis.
Conclusion
Poor stamping quality rarely announces itself. It drifts in slowly, run by run, until parts fail at your line. That silent drift is the real cost of weak process control.
Statistical Process Control for stamping parts closes that gap. Define CTQ dimensions first. Demand capability studies before production. Verify the gauges behind the charts. Then read trends across runs, not just single snapshots.
Our team applies this exact discipline when managing stamping projects for U.S. and European clients across Vietnam and the wider Asian supply base. If you want SPC done right the first time, insist on these standards from day one, or work with a partner who already enforces them for you.
Frequently Asked Questions
What Steps Should I Expect When My Supplier Sets Up SPC for Stamping Production?
A few years back, our team in Vietnam took over a stamped mounting clip project that had a 12% rework rate. The fix was not new tooling. It was disciplined SPC setup.
Which Critical Dimensions Should I Require My Supplier to Monitor with SPC?
Here is a trade-off we weigh on every custom parts project : monitoring everything is expensive, but monitoring too little is dangerous. The answer lies in picking dimensions that predict failure.
How Can I Verify My Supplier's SPC Data Is Accurate and Reliable?
A purchasing manager from Texas once told me his previous supplier sent flawless control charts for six months, then shipped a container of out-of-spec clips. The charts were real. The gauges were not calibrated. We rebuilt his verification process from scratch.
Footnotes
1. AIAG’s official PPAP resource explains the production part approval process referenced for CTQ definition. ↩︎