

Statistical Process Control (SPC) 1 for stamping parts saved one of our bracket programs from a costly recall. Die wear drifts silently, scrap piles up, and customers reject shipments—unless SPC catches the shift first.
Statistical Process Control for stamping parts is implemented by identifying critical dimensions, validating the measurement system, sampling parts at defined intervals, plotting results on control charts with data-driven limits, and triggering predefined reaction plans when signals reveal die wear, press drift, or material variation.
That is the short version. Below, I will walk through the tools, the control limits 2, the defects SPC prevents, and how to audit a supplier’s SPC system before you place an order.
What Statistical Tools Do I Need to Monitor Stamping Process Stability?
A quality engineer on our Vietnam team once showed me two identical-looking charts from the same press. One was stable. The other was drifting toward scrap. The tools made the difference visible.
Monitoring stamping process stability requires X-bar/R or I-MR control charts for dimensions, p-charts or c-charts for defect counts, a measurement system analysis (Gage R&R) to validate gages, and capability indices like Cp and Cpk to confirm the process can hold tolerance.
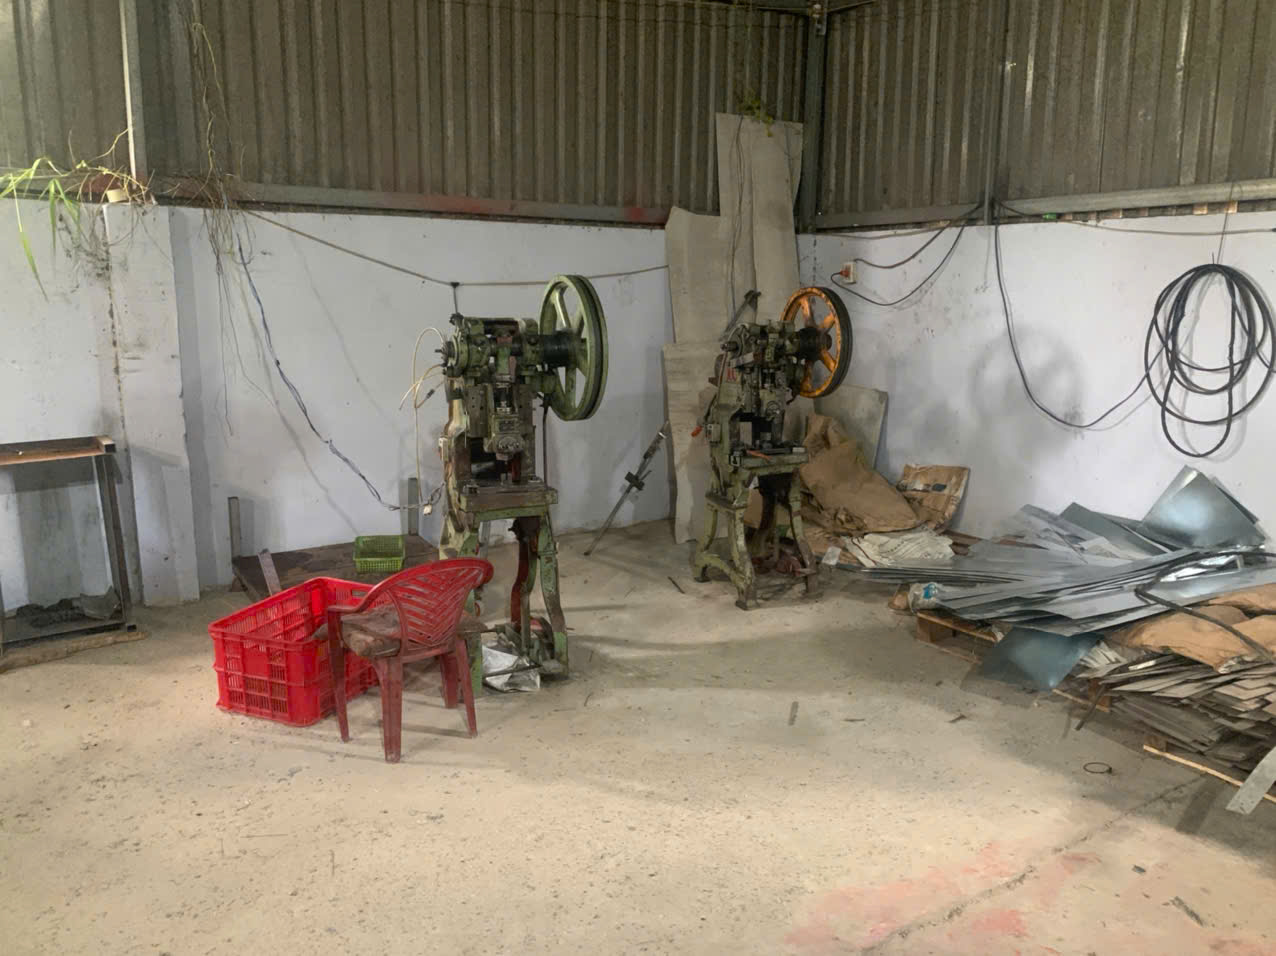
Let me break these tools down, because choosing the wrong chart is one of the most common mistakes I see when we audit stamping suppliers across Vietnam, Taiwan, and India.
Match the Chart to the Data Type
Stamping data comes in two forms. Variable data is measured, like a hole diameter or flange height. Attribute data is counted, like the number of burred parts in a lot. Each needs a different chart.
| Data Type | Example on a Stamped Bracket | Recommended Chart |
|---|---|---|
| Variable, subgrouped (4–5 parts) | Hole diameter, bend angle, flange height | X-bar/R chart 3 |
| Variable, individual readings | Coating thickness, coil hardness | I-MR chart |
| Attribute, defective units | Parts rejected per lot | p-chart |
| Attribute, defect counts | Burrs or scratches per part | c-chart |
| Multiple correlated dimensions | Progressive die stations | Hotelling T² chart |
For most stamping programs, the X-bar/R chart is the workhorse. Operators pull a small subgroup, usually 4 or 5 parts, measure the critical dimension, and plot the average and range. The average chart shows drift. The range chart shows inconsistency.
Validate the Measurement System First
A chart is only as good as the gage behind it. Before we launch SPC on any custom part, we run a Gage R&R study 4. It checks whether the gage, the fixture, and the operators produce repeatable readings. If measurement noise is large, the chart reflects the gage, not the press. That leads to false alarms and wasted investigation time. In our experience, a poor fixture design causes more SPC failures than a poor press.
Capability Indices Close the Loop
Cp compares tolerance width to process spread: (USL − LSL) ÷ 6σ. Cpk adds centering, taking the worse side of the distribution. Together, they tell you whether stability also means conformance. Stability without capability still produces bad parts.
How Do I Set Control Limits for Critical Stamping Dimensions?
One trade-off we weigh on every new stamping project is speed versus statistical validity. Buyers want charts running on day one. Valid control limits need real baseline data first.
Control limits for stamping dimensions are calculated from actual process data—typically 20–25 subgroups collected under stable production conditions—using the process mean plus and minus three standard deviations. They are never copied from drawing tolerances, which are engineering limits, not statistical ones.
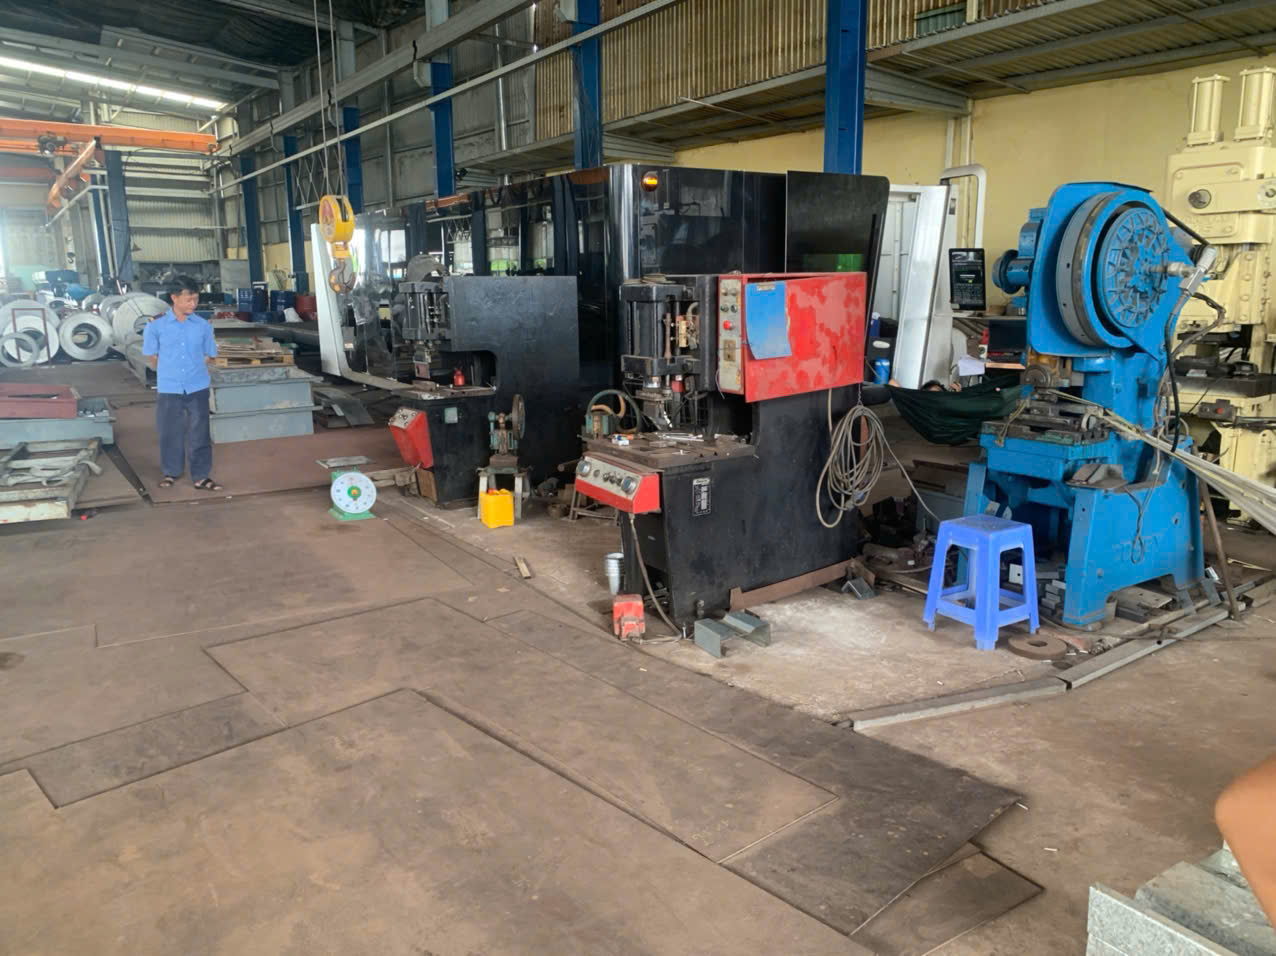
This distinction trips up many suppliers. Specification limits come from the designer. Control limits come from the process. Confusing the two is the fastest way to build an SPC system that looks disciplined but detects nothing.
The Baseline Study Process
Here is the sequence we require before serial production on critical stamped parts:
- Confirm the critical dimensions from the drawing, DFMEA, and control plan. Not every dimension needs SPC—only the high-risk ones.
- Complete the Gage R&R so the data is trustworthy.
- Run the press under normal conditions. No hand-picked parts, no post-rework samples.
- Collect 20–25 subgroups of 4–5 parts each, roughly 100 measurements.
- Calculate the grand average and average range, then derive the upper and lower control limits.
- Remove any subgroups with known special causes, document why, and recalculate.
- Lock the limits and train operators on the reaction rules.
Why Data Conditions Matter
Baseline data must represent the real process. If a supplier collects it only during a careful startup run, the limits will be too tight. Every normal shift-change or coil-change will then trigger false alarms, and operators will learn to ignore the chart. We have rejected baseline studies for exactly this reason during supplier audits.
Reaction Rules Turn Limits into Action
Limits are useless without rules. The standard out-of-control signals include: any point beyond the control limits, two of three consecutive points beyond two sigma, eight consecutive points on one side of the centerline, and six points trending steadily up or down. Each signal should map to a written response: stop, contain, investigate, correct. On our programs, we also require limits to be reviewed after any die refurbishment, because a rebuilt die is effectively a new process.
For high-mix, low-volume stamping—common in our custom-parts business—traditional charts cannot accumulate enough subgroups per part number. In those cases, short-run techniques like nominal charts or Z-charts let one chart track deviation-from-nominal across similar parts running on the same press.
Which Stamping Defects Can I Prevent by Using SPC Data?
A U.S. purchasing manager once asked me why his previous supplier's brackets passed final inspection for months, then suddenly failed in batches. The answer was gradual die wear that nobody was trending. SPC exists precisely for that failure mode.
SPC data prevents defects caused by gradual, detectable drift: oversized holes from punch wear, burr height growth from clearance drift, dimensional shift from die wear, springback variation from coil-to-coil material changes, and thickness or flatness issues from press setup inconsistency.
The key word is drift. SPC does not stop a catastrophic die crash. It catches the slow-moving problems that ruin whole shipments if nobody notices until final inspection.
Mapping Signals to Root Causes
A chart tells you something changed. It does not tell you what. So we maintain a cause-and-effect matrix for our stamping programs that links each signal pattern to its likely process variable. This turns a vague alarm into a fast, targeted investigation.
| SPC Signal Pattern | Likely Stamping Cause | Preventive Action |
|---|---|---|
| Slow upward trend in hole diameter | Punch wear | Schedule punch replacement before tolerance is breached |
| Rising burr height trend | Punch-die clearance drift | Regrind die, restore clearance |
| Sudden mean shift after coil change | Material lot variation (thickness, hardness) | Tighten incoming coil checks, adjust setup |
| Step change after setup | Setup inconsistency, wrong shut height | Standardize setup sheets, verify first articles |
| Increased range, stable mean | Lubrication variation or loose tooling | Check lube system and die fasteners |
| Springback shift in bend angles | Coil hardness or grain direction change | Verify material certs, adjust bend allowance |
From Reactive Inspection to Predictive Maintenance
The most valuable outcome is predictive die maintenance 5. When you trend burr height or hole size over die hits, you can see the wear curve forming. Instead of waiting for a reject, the toolroom pulls the die at a planned interval. On the stamped mounting clips we manage out of Vietnam, this approach converts unplanned press downtime into scheduled maintenance windows. It also protects delivery dates, which matters enormously to buyers who have been burned by suppliers scrapping a full run the week before shipment.
One honest caution: SPC cannot fix a bad process. If the die design or press condition is inherently unstable, the chart will simply document chaos. Process design comes first. SPC then keeps a good process good.
How Do I Choose a Stamping Supplier That Runs SPC Correctly?
Auditing a supplier's press room teaches you things a quotation never will. Our audit team has walked into stamping plants with beautiful framed Cpk certificates and charts that had not been updated in weeks.
Choose a stamping supplier by verifying live control charts at the press, documented Gage R&R results, control limits derived from process data, written reaction plans operators can explain, Cpk ≥ 1.33 on critical dimensions, and SPC records that trace back through PPAP submissions.
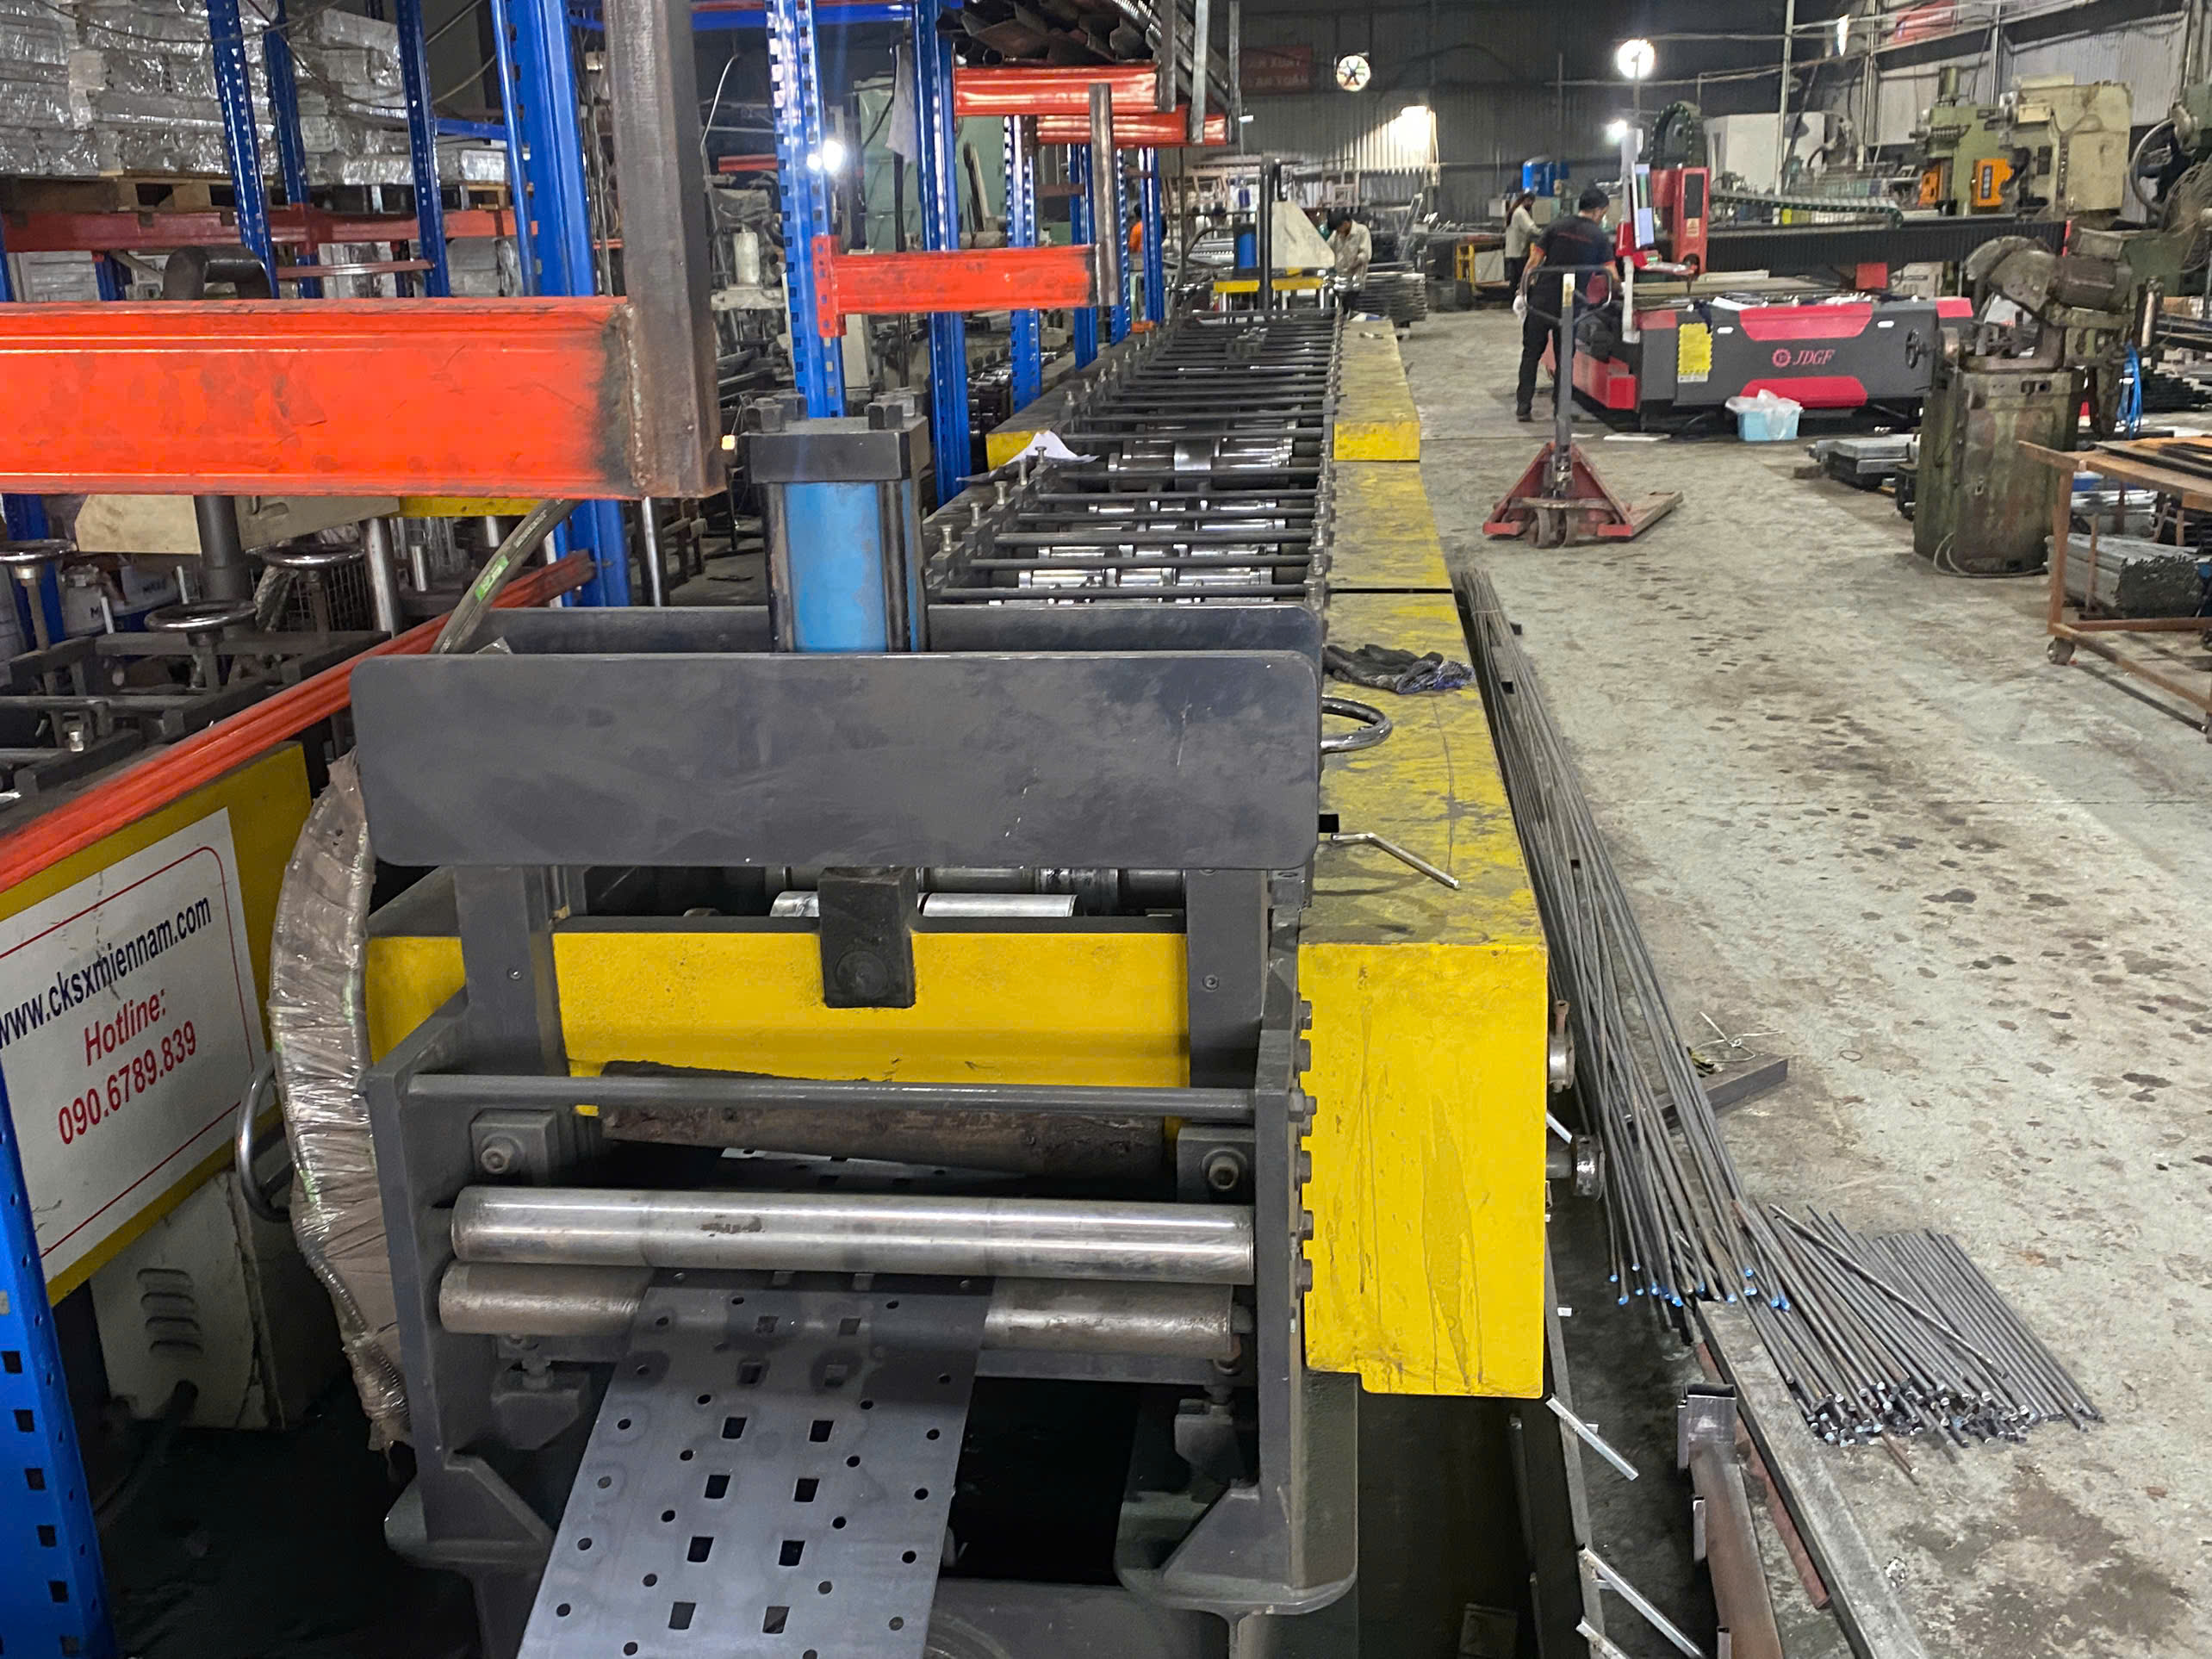
Paper compliance is easy to fake. Real SPC discipline is not. Here is the checklist we use when qualifying stamping suppliers for our U.S. and European clients.
The Audit Checklist That Separates Real SPC from Theater
| Audit Question | What a Good Answer Looks Like | Red Flag |
|---|---|---|
| Are charts updated in real time at the press? | Current-shift data visible, digital or paper | Charts filled in retroactively at day's end |
| Can the operator explain reaction rules? | Names specific signals and the response steps | "I call the supervisor" with no defined trigger |
| Is there Gage R&R evidence for each critical gage? | Recent studies with acceptable results | Calibration stickers only, no R&R study |
| How were control limits set? | From 20–25 baseline subgroups of real production | Limits equal to drawing tolerances |
| Is capability reported only when stable? | Stability confirmed before Cpk is quoted | Cpk quoted from a single golden run |
| Do signals link to corrective actions? | Traceable records from alarm to root cause | Alarms acknowledged with no follow-up |
Look for System Integration, Not Isolated Charts
Good suppliers tie SPC into the whole quality system 6. The control plan defines what is charted and how often. The DFMEA justifies why those dimensions are critical. PPAP capability studies 7 establish the baseline before serial production. When we manage contract manufacturing for clients, we require this chain of documents to connect. A chart floating alone, disconnected from the control plan, usually means SPC was installed for an audit, not for control.
Ask About Ownership and Escalation
Finally, ask who reacts to a signal at 2 a.m. on the night shift. If only the quality department owns the charts, response will be slow. In strong plants, production operators own the first response and quality verifies. That shared ownership, more than any software, is what makes SPC work when nobody is watching.
Conclusion
Unstable stamping quietly destroys margins through scrap, rework, and missed shipments. SPC—critical dimensions, valid gages, data-driven limits, and disciplined reactions—catches drift early and keeps stamped parts right the first time.
Frequently Asked Questions
What Statistical Tools Do I Need to Monitor Stamping Process Stability?
A quality engineer on our Vietnam team once showed me two identical-looking charts from the same press. One was stable. The other was drifting toward scrap. The tools made the difference visible.
How Do I Set Control Limits for Critical Stamping Dimensions?
One trade-off we weigh on every new stamping project is speed versus statistical validity. Buyers want charts running on day one. Valid control limits need real baseline data first.
Which Stamping Defects Can I Prevent by Using SPC Data?
A U.S. purchasing manager once asked me why his previous supplier's brackets passed final inspection for months, then suddenly failed in batches. The answer was gradual die wear that nobody was trending. SPC exists precisely for that failure mode.
Footnotes
1. Authoritative NIST reference explaining SPC methodology and control chart theory. ↩︎
2. NIST’s statistical handbook explains control limit calculation, supporting the article’s methodology guidance. ↩︎
3. Wikipedia’s control chart article explains the X-bar/R methodology referenced as the standard tool. ↩︎
4. NIST handbook section on measurement systems analysis supports the Gage R&R explanation. ↩︎
5. Background on predictive maintenance supports the article’s shift from reactive inspection to scheduled die service. ↩︎
6. ISO 9001 defines the quality management system framework SPC should integrate into. ↩︎
7. Wikipedia explains PPAP, the automotive quality process the article ties to baseline capability data. ↩︎