Testing the fatigue life of stamping parts became urgent for us after a batch of mounting brackets cracked in the field DIN 50100 1. The parts passed static checks. They still failed under vibration. That gap between “passes inspection” and “survives service” is exactly what fatigue testing closes—and our team now builds it into every custom stamping project we manage.
To test the fatigue life of stamping parts, apply controlled cyclic loading to production-representative specimens or full parts on a servo-hydraulic or resonance machine, run multiple stress levels to failure, build an S-N curve, and predict service life using standards like ASTM E466 or ISO 1099.
That is the short answer. The full picture involves choosing the right test method, using the right equipment, reading the data correctly, and avoiding a few costly mistakes. Let me walk you through each step.
How can I determine which fatigue testing method fits my stamping parts best?
A purchasing manager once asked me why we quoted three different fatigue tests for one simple Z-clip. The answer: each test answers a different question, and picking the wrong one wastes money.
Match the test to the decision you need to make: use coupon-level stress-life (S-N) testing for material screening, subcomponent testing for design iteration on features like bends and holes, and full-part cyclic testing for final validation of critical stamped geometries.
The starting point is always the service load case. Ask what the part actually experiences in use. Is it repeated tension, bending, vibration, or a mix? A panel clip under vibration needs a different test than a chassis bracket under repeated bending. Once you know the load case, you can pick the test level.
The three test levels
| Test Level | What It Tests | Cost | Best For |
|---|---|---|---|
| Coupon (specimen) | Base or as-formed material behavior | Low | Material screening, S-N curve generation |
| Subcomponent | Local features: bends, holes, trimmed edges | Medium | Design iteration, notch effects |
| Full part | Complete geometry with real boundary conditions | High | Final validation of critical parts |
Coupon tests are cheap and repeatable. But they miss the story of the stamped part. Stamping introduces work hardening 2, thinning, residual stress, and edge damage. A machined coupon of virgin sheet does not carry that history. In our sourcing projects across Vietnam and the wider region, we have seen "as stamped" fatigue behavior differ noticeably from base-metal datasheet values. Prestrain from forming can raise or lower fatigue strength depending on severity.
So here is my practical rule. Start with coupon tests cut from actual stamped material, in the correct rolling orientation. Then test subcomponents that include the real failure-critical features—punched holes, tight bend radii, embossed sections. Reserve full-part testing for parts where failure carries real warranty or safety risk. For most bracket and clip programs we manage, a coupon-plus-subcomponent approach covers the decision well.
Also decide between constant-amplitude and variable-amplitude loading. Constant amplitude is the standard route to an S-N curve. Block-program or variable-amplitude tests better simulate real service spectra, but they cost more and take longer.
What equipment and standards do I need to accurately test fatigue life?
When we audit stamping suppliers for our U.S. clients, the fatigue lab is one of the first stops. The machines tell you a lot. So do the calibration records.
You need a servo-hydraulic or resonance fatigue machine with force and strain sensing, fixtures matched to your load mode, and adherence to recognized standards—ASTM E466 for constant-amplitude axial tests, ISO 1099, or DIN 50100—plus controlled frequency, temperature, and documented failure criteria.
The machine is only half the setup. The test conditions decide whether your data means anything. Here are the variables I insist on controlling in every fatigue test plan we review.
Key setup variables
| Variable | Why It Matters | Typical Practice for Stamped Sheet |
|---|---|---|
| Load mode | Must match service: tension, bending, vibration | Tension-tension or plane bending for thin sheet |
| Stress ratio (R) | Mean stress shifts fatigue life | R = 0.1 often used to avoid buckling thin specimens |
| Frequency | Too fast causes self-heating | Keep within limits per material and standard |
| Temperature/environment | Heat and corrosion alter results | Monitor and record throughout |
| Surface and edge condition | Burrs and roughness cut life sharply | Must match production condition |
| Orientation | Rolling vs. transverse direction differs | Cut specimens in the service-relevant direction |
Note the stress ratio point. Fully reversed loading (R = -1) is classic textbook territory. But thin stamped sheet buckles under compression. That is why many thin-sheet fatigue programs run tension-tension at R = 0.1 instead. It keeps the specimen stable and the data clean.
Instrumentation and failure criteria
Define failure before you start. Common criteria include a crack reaching a set length, stiffness dropping past a threshold, or complete fracture. Use force and strain sensing throughout, and inspect for crack initiation 4 at notches, bend radii, and trimmed edges—that is where stamped parts almost always fail first.
One more tool worth mentioning: X-ray diffraction. It measures residual stress before cycling begins. On projects with tight bend radii, we have used residual stress mapping to identify high-risk zones and place strain gauges exactly where cracks are likely to start. It turns a blind test into a targeted one.
Standards keep everything comparable. ASTM E466 5 governs constant-amplitude axial fatigue for metals. ISO 1099 6 and DIN 50100 cover similar ground. You do not need to memorize every clause. You do need your lab to follow one consistently and document it.
How do I interpret fatigue test results to predict real-world part performance?
The hardest conversation in any test program is explaining scatter. Two identical stamped clips, same steel, same press, same load—one fails at 300,000 cycles, the other at 900,000. Both results are valid. That is fatigue.
Plot stress amplitude against cycles to failure to build an S-N curve, fit it statistically with multiple repeats per load level, apply mean-stress corrections for your service stress ratio, then read off the predicted life or fatigue strength at your target stress range with a defined confidence level.
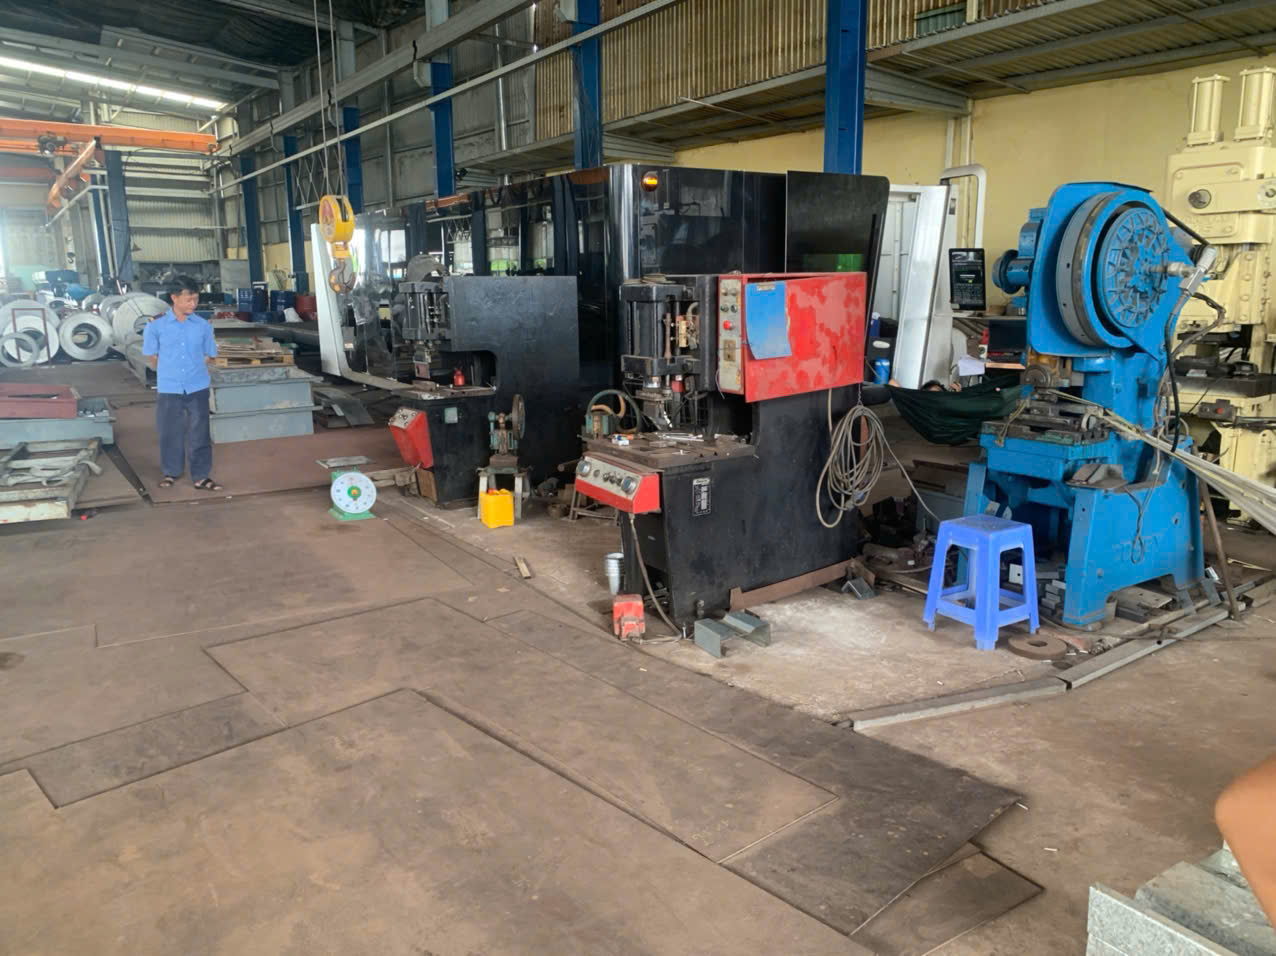
The S-N curve, also called the Wöhler curve, is the backbone of interpretation. Each test point is one specimen cycled at constant amplitude until failure. Plot enough points across several stress levels, and a trend emerges: higher stress, shorter life. High-cycle fatigue is generally discussed above 10,000 cycles, and design targets often sit at one million cycles or more.
From raw data to a prediction
- Run multiple repeats at each stress level to capture natural variance.
- Fit the S-N curve using a statistical model; Weibull fitting is common because it yields confidence intervals, not just a mean line.
- Correct for mean stress. Lab data at R = 0.1 does not directly apply to a service condition with a different mean stress. Gerber-type or similar corrections bridge that gap.
- Apply damage accumulation methods if the real load spectrum is variable rather than constant.
- Compare predicted life against the required service life with a safety margin.
Closing the loop with simulation and field data
Lab data alone is not the finish line. The most credible workflow we run for clients is hybrid. FEA identifies high-stress zones in the stamped geometry and extends the S-N data to areas that are hard to test directly. Physical tests then validate the simulation. Neither replaces the other.
Field data closes the final gap. On high-volume programs, strain gauges or IoT sensors 7 on production parts collect real service loads. That data recalibrates lab-derived predictions over time. In one of our long-running bracket programs, early field strain data revealed a vibration mode the original load assumptions missed—catching it early saved a redesign after launch.
The practical takeaway: never quote a single number for fatigue life. Quote a life at a confidence level, tied to a defined load case. That is what a serious engineering customer expects to see.
What common mistakes should I avoid when testing stamping parts for fatigue life?
Years of supplier audits and PPAP reviews have taught our team a hard lesson: most fatigue test failures are not machine problems. They are planning problems, made before the first cycle runs.
Avoid testing polished coupons instead of production-condition parts, over-accelerating tests until the failure mechanism changes, ignoring edge quality and burr height, skipping repeats needed for statistics, and treating FEA predictions as a substitute for physical validation.
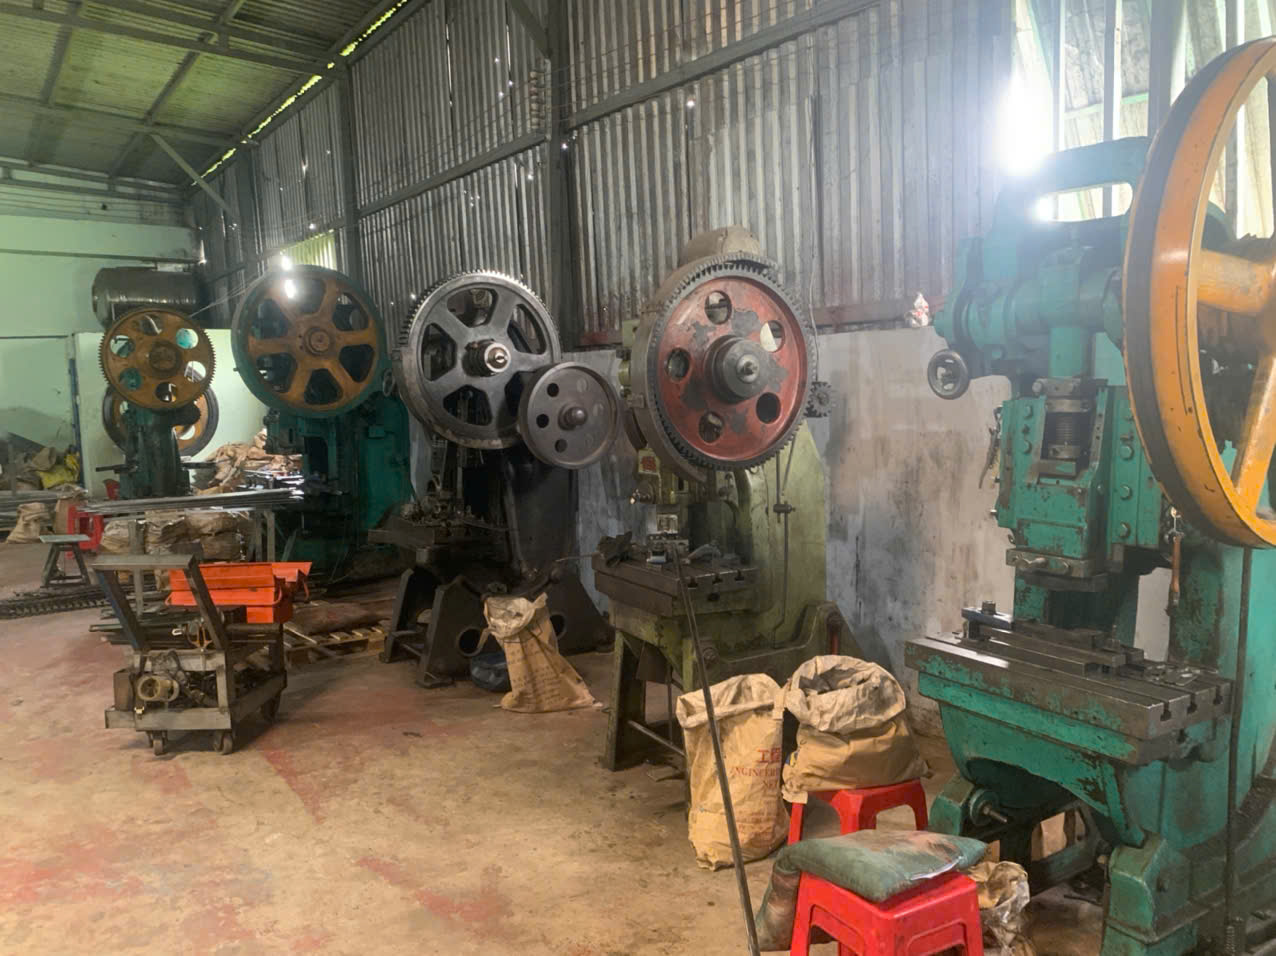
Let me break down the mistakes we see most often, and what to do instead.
The five costly mistakes
| Mistake | Why It Hurts | Better Practice |
|---|---|---|
| Testing polished specimens | Removes the burrs and roughness that drive real failures | Test with production surface and edge condition |
| Over-accelerating the test | High stress can change the failure mechanism entirely | Accelerate moderately; verify the failure mode matches field failures |
| Ignoring blanking quality | Burrs and rollover act as stress risers | Control die clearance; inspect edges before testing |
| Too few repeats | Scatter makes single points meaningless | Multiple specimens per stress level, minimum |
| FEA without validation | Simulation errors compound silently | Always anchor FEA to physical test data |
The edge-quality point deserves emphasis. Punched holes, sharp corners, and trimmed edges are the most common fatigue crack initiation sites in stamped parts. Controlling die clearance during blanking to minimize burr height often does more for long-term fatigue durability than surface treatments applied afterward. When we run process control on stamping projects, burr height is a monitored characteristic, not an afterthought—because a part that measures in tolerance can still carry an edge that halves its fatigue life.
Acceleration is the other trap. Raising stress levels shortens test time, which every schedule-pressed program wants. But push too far and cracks initiate differently than they would in service. For coated press-hardened steels, for example, microcrack depth in the coating can be critical to fatigue life—a mechanism a heavily accelerated test may not reproduce. Faster is not always representative.
Finally, do not let one clean test result end the conversation. Fatigue is statistical by nature. A disciplined program—production-representative specimens, controlled conditions, adequate repeats, and validated simulation—is what turns test data into a reliable service-life prediction.
Conclusion
Stamped parts crack in service when fatigue is ignored. Test production-representative specimens, follow standards, build S-N curves, validate with FEA and field data—and cracks stop surprising you.
Frequently Asked Questions
How can I determine which fatigue testing method fits my stamping parts best?
A purchasing manager once asked me why we quoted three different fatigue tests for one simple Z-clip. The answer: each test answers a different question, and picking the wrong one wastes money.
What equipment and standards do I need to accurately test fatigue life?
When we audit stamping suppliers for our U.S. clients, the fatigue lab is one of the first stops. The machines tell you a lot. So do the calibration records.
How do I interpret fatigue test results to predict real-world part performance?
The hardest conversation in any test program is explaining scatter. Two identical stamped clips, same steel, same press, same load—one fails at 300,000 cycles, the other at 900,000. Both results are valid. That is fatigue.
Footnotes
1. German standards institute that issues the DIN 50100 fatigue testing standard. ↩︎
2. Background concept explaining how stamping changes material fatigue behavior. ↩︎
3. Explains the internal stress phenomenon measured before fatigue cycling. ↩︎
4. Background on fatigue crack initiation, the core mechanism discussed throughout. ↩︎
5. Official standards body publishing ASTM E466 for constant-amplitude axial fatigue testing. ↩︎
6. International Organization for Standardization publishes ISO 1099 fatigue testing standard. ↩︎
7. NIST resource explaining IoT sensor technology used for field data collection. ↩︎