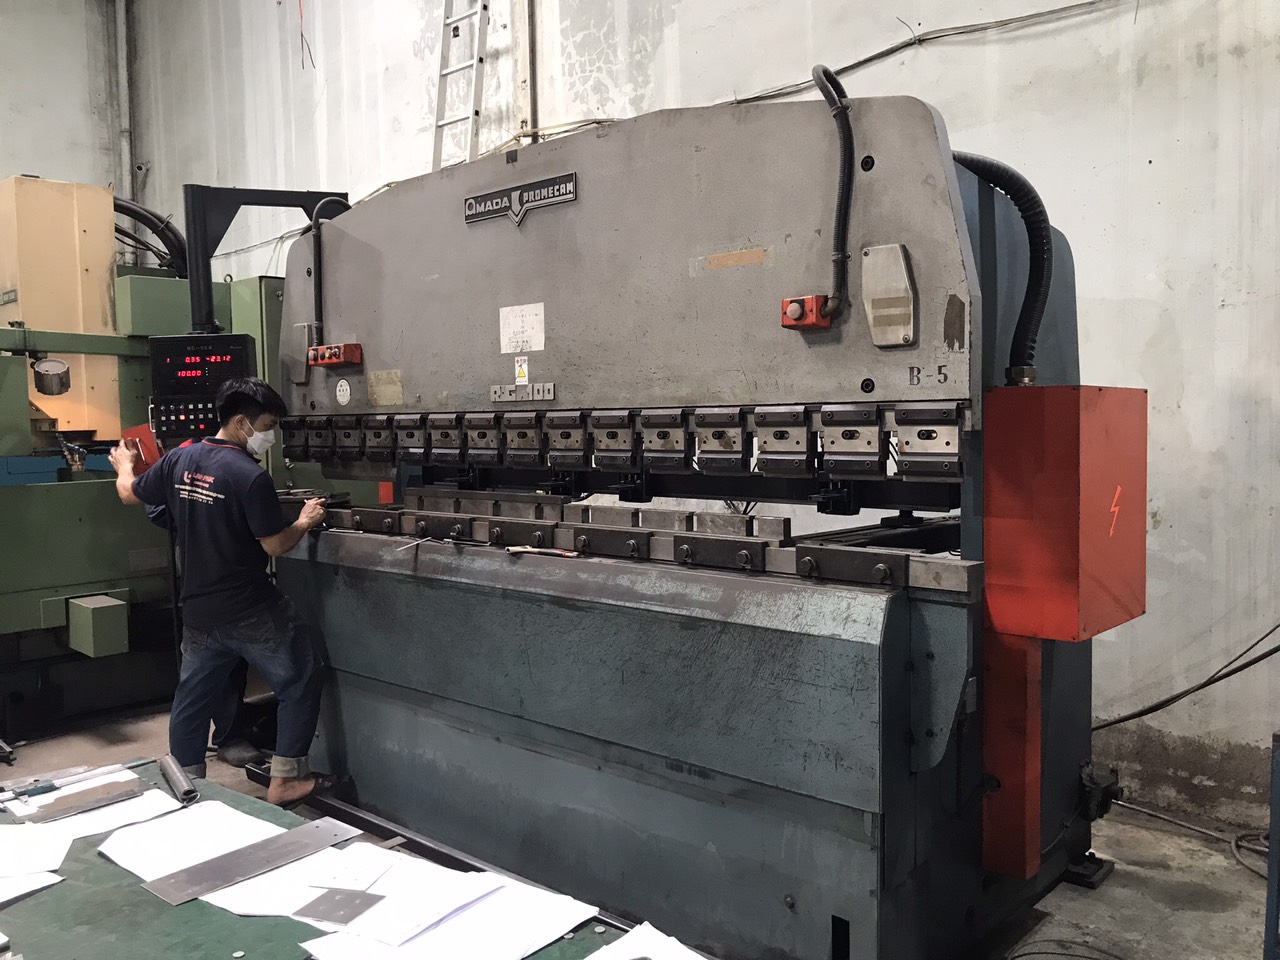
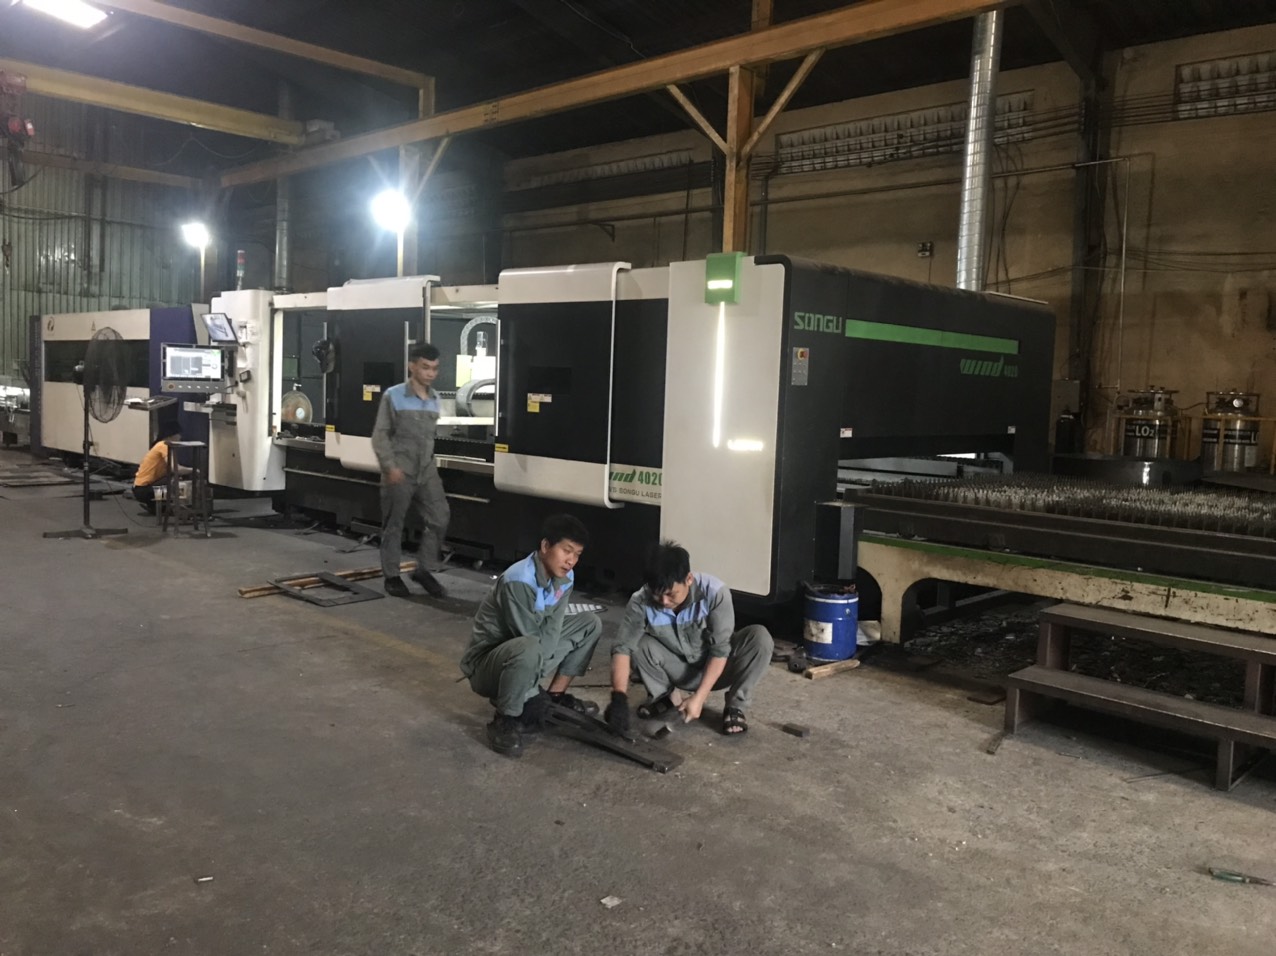
Every week, our team in Vietnam fields calls from U.S. buyers stunned by how much scrap inflates their sheet metal project costs — yet they rarely question the processing side of the equation.
The material to processing cost ratio in sheet metal fabrication typically falls between 6:1 and 10:1, meaning raw material accounts for roughly 85–86% of total cost while processing — including labor costs, machine time, and tooling costs — represents only 14–15%. This ratio shifts dramatically with part complexity, production volume, and material selection.
Understanding where your money actually goes is the first step toward cutting it. Below, I break down how to benchmark your ratio, what design features spike processing costs, how to balance material choice with fabrication complexity, and why sourcing from Southeast Asia changes the math entirely.
How do I determine if my material to processing cost ratio is within the industry standard?
A purchasing manager we work with in Ohio once told me he had no idea whether his 78% material share was good or terrible — he just knew his total cost felt too high.
To determine if your ratio is within industry standard, compare your material share against the 85–86% benchmark for standard sheet metal parts. If your material share drops below 70% or exceeds 90%, investigate scrap rate, production volume, and part complexity as the likely causes of deviation.
Start With the Basic Formula
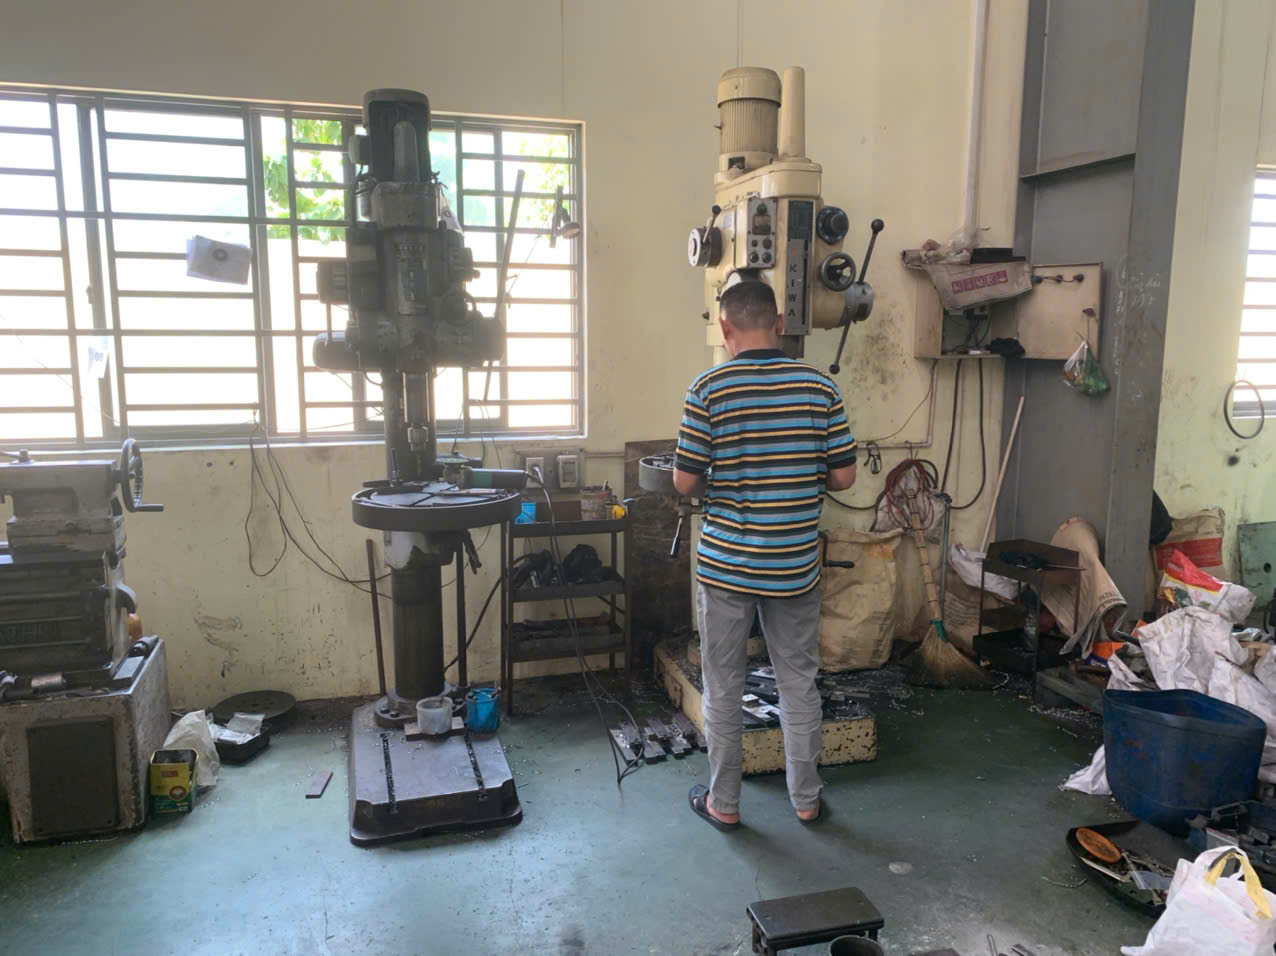
The ratio itself is simple. Divide your total raw material cost by your total processing cost. Material cost includes the flat pattern area multiplied by thickness, density, and unit weight cost, plus the cost of scrap. Processing cost includes the machine hourly rate multiplied by cycle time per piece, divided by efficiency, plus tooling costs.
Here is a quick reference for where most standard projects land:
| Cost Component | Typical Share | Range for Standard Parts |
|---|---|---|
| Raw material (including scrap) | 85–86% | 70–92% |
| Processing (labor, machine, tooling) | 14–15% | 8–30% |
| Total | 100% | 100% |
What Shifts the Benchmark
The 85/15 split is a useful starting point, but it only holds for mid-volume, moderately complex parts. When we quote projects for our U.S. clients, we always break down the cost per unit so the buyer can see exactly where the money goes.
High-volume, simple parts with efficient nesting can push the material share down to 70–75%. That happens because tooling investment gets amortized across thousands of pieces, and the processing cost per unit drops by more than 50%. On the other hand, low-volume, complex parts with high scrap rates can push material share above 90%.
A Per-Unit Breakdown Is More Useful
I recommend going beyond the ratio and looking at per-unit cost. Here is the framework we use internally:
| Per-Unit Cost Element | Formula |
|---|---|
| Material cost per piece | (Flat pattern area + scrap allowance) × thickness × density × unit cost per kg |
| Processing cost per piece | (Cycle time × machine hourly rate ÷ efficiency) + (tooling cost ÷ total order quantity) |
| Overhead per piece | Facility, energy, QC, and logistics costs ÷ total order quantity |
When a buyer sends us a drawing, we calculate both numbers and present them side by side. If the material share is above 90%, we flag scrap rate and material utilization as the first places to look. If the processing share is unusually high, we look at part complexity and surface finish requirements.
The ratio is a diagnostic tool. It tells you where to dig. But it is not a magic number. Context matters more than the ratio itself.
What specific design features will drive up my processing costs relative to the material value?
During a recent co-development project, our engineering team in China spent two full days redesigning a bracket just to eliminate three unnecessary internal cutouts — and the client's processing cost dropped by nearly a quarter.
Design features that drive up processing costs include tight tolerances, excessive bend counts, internal cutouts requiring secondary operations, custom fastener hardware, complex weld joints, and demanding surface finish requirements. These features increase machine time, labor costs, and tooling costs while adding minimal material value.
The 95% Rule: Design Decisions Control Cost
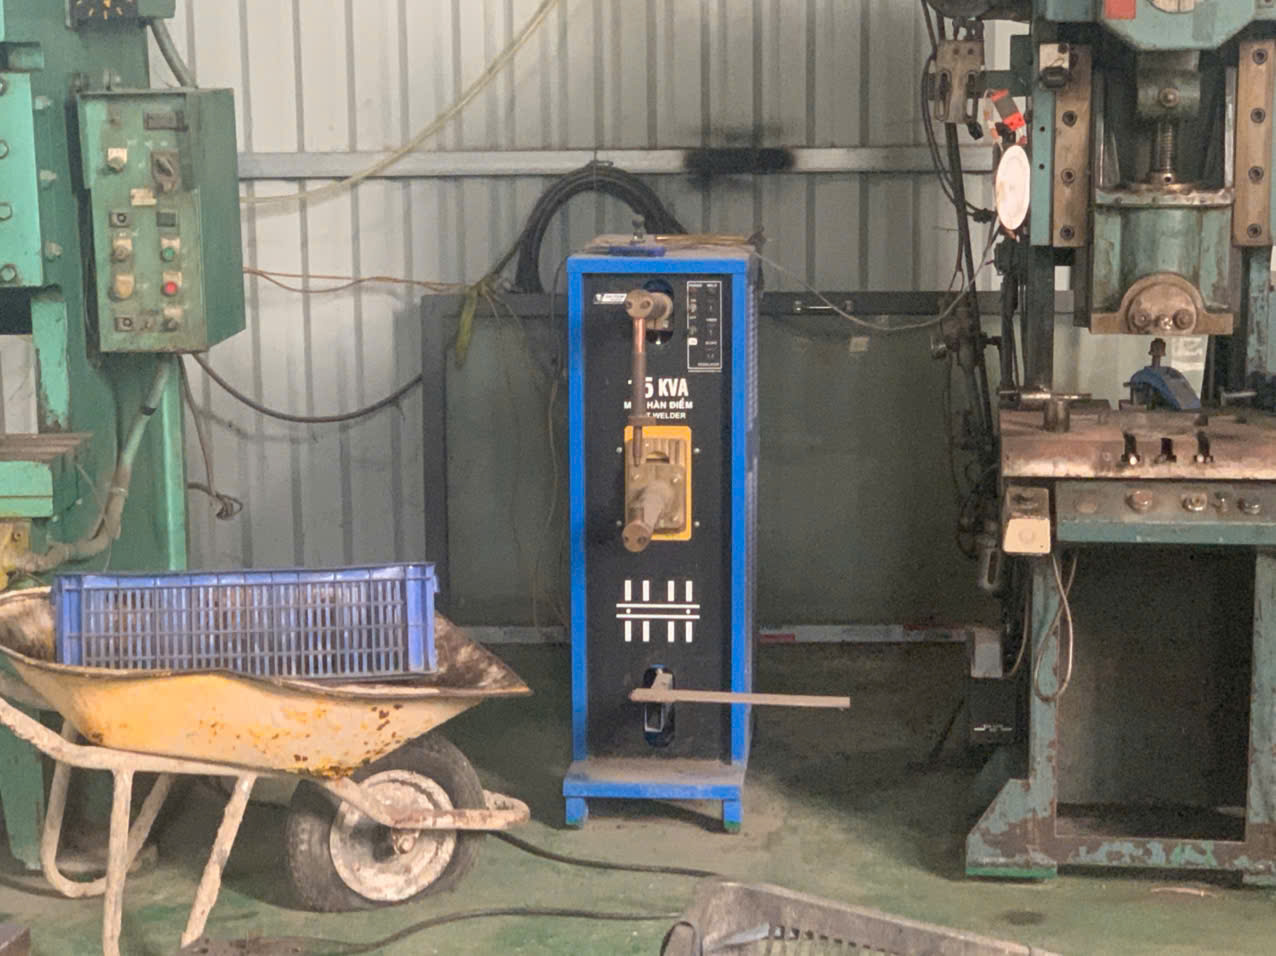
Up to 95% of production costs are locked in during the design phase. Once a drawing is finalized, the fabricator has very little room to optimize. That is why design for manufacturability 1 matters so much. Every extra bend, hole, or weld joint adds cycle time and often requires additional setups.
Here is a breakdown of common design features and their impact on processing cost:
| Design Feature | Impact on Processing Cost | Why It Matters |
|---|---|---|
| Number of bends (>4) | High | Each bend requires a CNC bending 2 setup; complex sequences increase cycle time |
| Tight tolerances 3 (±0.1 mm or less) | High | Requires slower laser cutting speeds, additional QC steps, and precision tooling |
| Internal cutouts / slots | Medium–High | Increases laser cutting costs and may generate more scrap |
| Custom fastener insertion | Medium–High | Requires specialized tooling; standard PEM hardware is far cheaper |
| Welding joints (>2 per part) | High | Manual or robotic welding adds significant labor costs and inspection time |
| Surface finish (powder coating 4, anodizing) | Medium | Adds a secondary operation with its own setup, material, and curing time |
| Non-standard material thickness | Medium | May require special sourcing and machine calibration |
Bends and Tolerances: The Silent Cost Multipliers
CNC bending is one of the most common processing steps in sheet metal fabrication 5. Each bend requires a tool change or repositioning. When a part has six or seven bends, the cycle time per piece can double compared to a two-bend part. I have seen projects where reducing the bend count from five to three cut the processing cost by 30%.
Tight tolerances are another trap. When a drawing calls for ±0.05 mm on a laser-cut feature, the machine must slow down, and the operator must inspect more frequently. Unless the application truly demands it, relaxing tolerances to ±0.2 mm can save real money without affecting function.
Custom Hardware vs. Off-the-Shelf
One lesson we learned early in our Vietnam operation is that custom fastener hardware is a budget killer. Every non-standard insert requires custom tooling, which adds setup time and cost. Standard PEM catalog fasteners are readily available, well-documented, and much cheaper to install. We always recommend reviewing the hardware spec before finalizing a design.
Secondary Operations Add Up Fast
Surface finish requirements like powder coating or anodizing are not just cosmetic. They add an entire processing step with its own overhead expenses, rejection criteria, and lead time. If the part lives inside an enclosure and never sees the end user, a standard mill finish may be sufficient.
The takeaway is simple: every feature on your drawing has a cost. The fewer operations needed, the lower the processing share. Design simplification is the single most powerful cost lever available.
How can I lower my total project cost by balancing material selection with fabrication complexity?
Last quarter, a client asked us to quote a stainless steel enclosure panel. When we ran the numbers, switching to a thinner aluminum alloy with reinforcing ribs saved 22% on material cost and barely changed the processing time.
You can lower total project cost by selecting materials that match your functional requirements — not exceed them — and by simplifying part geometry to reduce fabrication steps. Using thinner sheets with geometric stiffening, choosing standard alloys, optimizing nesting for material utilization, and investing in tooling at higher volumes all shift the cost ratio in your favor.
Material Selection: Cost vs. Performance
Not all materials cost the same to buy or to process. The table below shows a rough comparison for common sheet metal materials:
| Material | Relative Material Cost (per kg) | Relative Ease of Fabrication | Best Use Case |
|---|---|---|---|
| Mild steel (CR/HR) | Low | Easy | Structural brackets, enclosures |
| Aluminum 5052 / 6061 | Medium | Easy–Moderate | Lightweight panels, heat sinks |
| Stainless steel 304 | High | Moderate–Difficult | Corrosion-resistant parts, food/medical |
| Stainless steel 316 | Very High | Difficult | Marine, chemical environments |
| Galvanized steel | Low–Medium | Easy | Outdoor housings, HVAC |
Choosing stainless steel when galvanized steel would meet the spec inflates both material and processing costs. Stainless is harder to cut, wears tooling faster, and costs significantly more per kilogram. We always ask our clients: what environment will this part live in, and what loads will it carry? The answer often opens the door to a cheaper material.
Geometric Stiffening Instead of Thicker Sheets
A common mistake is specifying a thicker sheet to get more rigidity. But adding a simple bend, rib, or emboss can achieve the same structural strength with a thinner — and cheaper — sheet. This reduces both the raw material weight and the material cost, while the added processing step (one extra bend or press) costs far less than the material savings.
Nesting and Scrap Optimization
Scrap is the hidden cost driver. Standard scrap estimates assume about 20% above the flat pattern area, but poorly nested parts can waste 30–40% of the sheet. Modern digital nesting software 6 can reduce waste by 10–20%, and that savings goes straight to the bottom line.
When we plan a production run, we always run the nesting simulation first. If the flat pattern is an awkward shape, we discuss with the client whether small design tweaks — rounding a corner, shifting a hole — could allow better nesting. These changes are often cosmetic and cost nothing in function, but they can save hundreds of dollars on a batch of several hundred parts.
Volume and Tooling: The Break-Even Decision
For production volume above several thousand pieces, investing in dedicated tooling (progressive dies 7, custom fixtures) can reduce processing cost per unit by 50% or more. Below that threshold, CNC bending and laser cutting on a job-shop basis are more economical. The decision hinges on the total order quantity and the expected reorder frequency. Understanding how unit prices vary for low vs. high volumes is essential to making this call correctly.
Our team helps clients model this break-even point before committing. If a project is expected to run 500 pieces per year for three years, it may justify tooling even though the first order is small.
Why does my supplier's location in Southeast Asia change the way I view my processing cost breakdown?
One of the first things I noticed after we opened our Vietnam office was how dramatically the labor cost component shifted compared to quotes from U.S. domestic fabricators — and how that changed where the real cost leverage sits.
When your supplier is in Southeast Asia, labor costs and overhead expenses are significantly lower than in the U.S. or Europe, which compresses the processing cost share and makes material cost an even larger percentage of total cost. This means material selection, scrap rate, and material utilization become the dominant levers for cost reduction, while processing savings come from regional wage advantages rather than design changes alone.
The Processing Cost Compression Effect
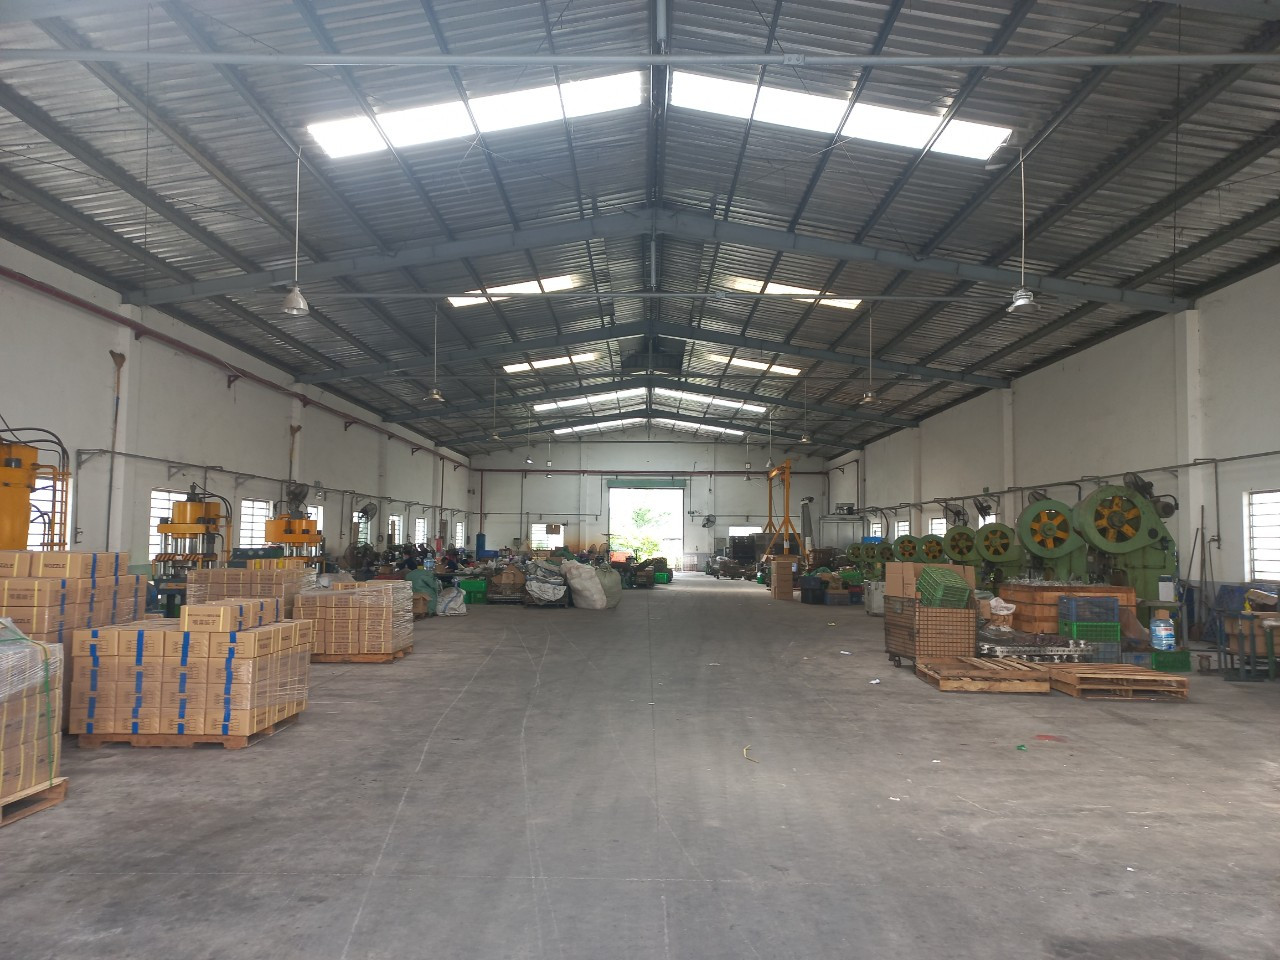
In the U.S., a skilled CNC bending operator may cost $25–$40 per hour fully loaded. In Vietnam, the fully loaded cost for a comparable operator is a fraction of that. Machine hourly rates are also lower because facility overhead expenses — rent, energy, insurance — are cheaper. The result is that processing cost as a share of total cost shrinks. Material cost, which is set by global commodity markets, stays roughly the same regardless of where the fabrication happens.
This means that for a U.S. buyer sourcing from Southeast Asia, the material to processing cost ratio may look more like 90/10 or even 92/8 rather than the 85/15 domestic baseline. The implication is critical: if you are trying to cut costs on a Southeast Asian quote, focusing on processing efficiency yields diminishing returns. The bigger wins come from material optimization — choosing the right alloy, reducing scrap, and improving nesting.
What Changes and What Stays the Same
| Cost Factor | U.S. Domestic Fabrication | Southeast Asia Fabrication |
|---|---|---|
| Raw material cost per kg | Market price + domestic markup | Market price + import/logistics markup |
| Labor cost per hour (fully loaded) | $25–$40+ | $3–$8 |
| Machine hourly rate | $60–$120 | $15–$40 |
| Tooling cost | High (domestic toolmakers) | Low–Medium (local toolmakers) |
| Overhead (facility, energy) | High | Low–Medium |
| Logistics & lead time | Short (domestic) | Longer (ocean freight, customs) |
| Quality risk | Lower (established processes) | Variable (requires strong QC oversight) |
The Quality Control Trade-Off
Lower processing costs in Southeast Asia do not come free. The risk of non-conforming parts increases if the supplier lacks robust quality control 8. That is exactly why we maintain a 7-person team in Vietnam and a 21-person team in China — to run PPAP, in-process inspections, and final inspections on every order. Without that layer, the cost savings from lower labor costs can evaporate in rework, returns, and missed delivery dates.
Our U.S. clients tell us their biggest pain point with Asian suppliers is not price — it is getting it right the first time. Drawing requirements get overlooked. Communication gaps lead to wrong material grades or missing features. These quality failures add hidden costs that never show up in the processing cost line item but destroy the total project budget. This is one reason supplier quotes vary so much — the level of QC investment differs dramatically between vendors.
Logistics and Energy Costs Matter More Now
Geopolitical events and supply chain volatility 9 have made ocean freight and energy costs less predictable. Energy intensity varies by process — laser cutting consumes more power than CNC bending — and in regions where energy prices fluctuate, this can shift the processing cost share quarter to quarter. We monitor these trends for our clients and flag when a shift in sourcing location or process selection could save money.
When Southeast Asia Sourcing Makes the Most Sense
The cost advantage is greatest for mid-to-high-volume projects with moderate complexity. For very simple, high-volume parts, the material cost dominance means the savings on processing are relatively small in absolute terms. For very complex, low-volume prototypes, the communication and quality overhead can offset the labor savings.
The sweet spot for our clients is typically custom parts in the range of 500 to 50,000 pieces per year, with mid-to-high quality requirements and a stable design. At that volume, the combination of low processing costs, competitive tooling costs, and strong QC oversight delivers the best total cost of ownership 10.
Conclusion
The material to processing cost ratio is a diagnostic tool, not a universal rule. Use it to identify where your money goes, then act on the biggest lever — whether that is scrap reduction, design simplification, or smarter sourcing from Southeast Asia with proper QC oversight.
Frequently Asked Questions
How do I determine if my material to processing cost ratio is within the industry standard?
A purchasing manager we work with in Ohio once told me he had no idea whether his 78% material share was good or terrible — he just knew his total cost felt too high.
What specific design features will drive up my processing costs relative to the material value?
During a recent co-development project, our engineering team in China spent two full days redesigning a bracket just to eliminate three unnecessary internal cutouts — and the client's processing cost dropped by nearly a quarter.
How can I lower my total project cost by balancing material selection with fabrication complexity?
Last quarter, a client asked us to quote a stainless steel enclosure panel. When we ran the numbers, switching to a thinner aluminum alloy with reinforcing ribs saved 22% on material cost and barely changed the processing time.
Footnotes
1. Found a complete guide on Design for Manufacturability (DFM). ↩︎
2. Details the automated process of bending sheet metal using computer numerical control. ↩︎
3. Found a precision manufacturing guide on tight tolerances. ↩︎
4. Provides a comprehensive guide to the powder coating process, advantages, and uses. ↩︎
5. Provides a comprehensive overview of the sheet metal fabrication process. ↩︎
6. Explains how nesting software optimizes material utilization and reduces waste in manufacturing. ↩︎
7. Explains the process, components, and benefits of progressive die stamping for high-volume production. ↩︎
8. Found an article on the importance of quality control in manufacturing from the same domain. ↩︎
9. Found an article on supply chain volatility from the same domain. ↩︎
10. Found an article on total cost of ownership from the same domain with definition and formula. ↩︎