Supplier capacity metrics for sheet metal fabrication 1 kept coming up in every delayed-shipment post-mortem our team ran last year — and the root causes were always preventable.
The supplier capacity metrics that ensure on-time delivery when sourcing sheet metal fabrication include On-Time Delivery rate (targeting 95–99%), average lead time by project type, schedule stability, rework and overtime rates, and OTIF (On-Time In Full) tracking — all evaluated against production utilization, machinery automation levels, and workforce skill depth.
Each of these metrics tells a different part of the story. average lead time 2 Some are lagging indicators that confirm past performance. Others are leading indicators that predict future failures before they hit your production line. Let me walk you through the ones that matter most and how to use them when evaluating a new sheet metal fabrication partner.
How can I evaluate a supplier's current production utilization to ensure my sheet metal order isn't sidelined?
A lesson we learned early in our Vietnam office: a supplier quoting a short lead time while running at 95% utilization is handing you a promise they cannot keep.
Evaluate a supplier's production utilization by requesting their current capacity load percentage, backlog-to-capacity ratio, and overtime trends. A healthy sheet metal shop operates at 70–85% utilization; anything above 90% signals that your order risks being queued, delayed, or rushed with quality trade-offs.
Why Utilization Rate Is a Capacity Metric, Not Just an Efficiency Metric
Many buyers confuse high utilization with high efficiency. They are not the same thing. A factory running at 98% utilization has almost zero buffer. One urgent order, one machine breakdown, one quality hold — and your job slides backward in the queue.
When our team audits sheet metal suppliers across Vietnam and other Asian markets, we look at utilization as a risk indicator. A shop at 75% utilization has room to absorb unexpected demand. A shop at 92% does not. It is that simple.
The Backlog-to-Capacity Ratio
This metric divides the total committed work hours by the available production hours over a defined period. It tells you how many weeks of work are already promised before your order even enters the system.
| Utilization Level | Backlog-to-Capacity Ratio 3 | Risk to Your Order | Recommended Action |
|---|---|---|---|
| Below 60% | Less than 0.6 | Low delay risk, but question why utilization is low | Verify quality and demand history |
| 60–75% | 0.6–0.75 | Healthy buffer zone | Proceed with standard lead time |
| 75–85% | 0.75–0.85 | Moderate risk; monitor closely | Request weekly production updates |
| 85–95% | 0.85–0.95 | High risk of delays or quality shortcuts | Negotiate priority scheduling or split orders |
| Above 95% | Greater than 0.95 | Critical overload | Avoid or plan significant lead time buffer |
Overtime as an Early Warning Signal
I always ask suppliers for their overtime hours as a percentage of total labor hours. This number is a leading indicator. If a factory is running 20–30% overtime consistently, they are already past sustainable capacity. The workers are fatigued. Mistakes increase. Rework climbs. And rework eats into the time allocated for your order.
Resource utilization data, when combined with overtime trends, gives you a clear picture. A supplier who shows you both numbers is transparent. A supplier who refuses to share them is hiding something.
Demand Forecasting Visibility
Ask whether the supplier does any form of demand forecasting 4 or capacity planning beyond the current month. Shops that plan 8–12 weeks ahead can absorb your order more reliably than shops that operate week to week. This is especially important for custom sheet metal parts with complex geometries — like the multi-bend mounting brackets with precise hole patterns that we frequently source for U.S. clients. These parts require dedicated setup time on press brakes and CNC punches, and that setup time must be planned in advance.
What specific machinery and automation metrics should I look for to guarantee my project meets its lead time?
During a recent supplier audit in Vietnam, we found a shop quoting 10-day lead times on laser-cut parts — but their only laser was a 15-year-old CO2 unit with no automated sheet loading.
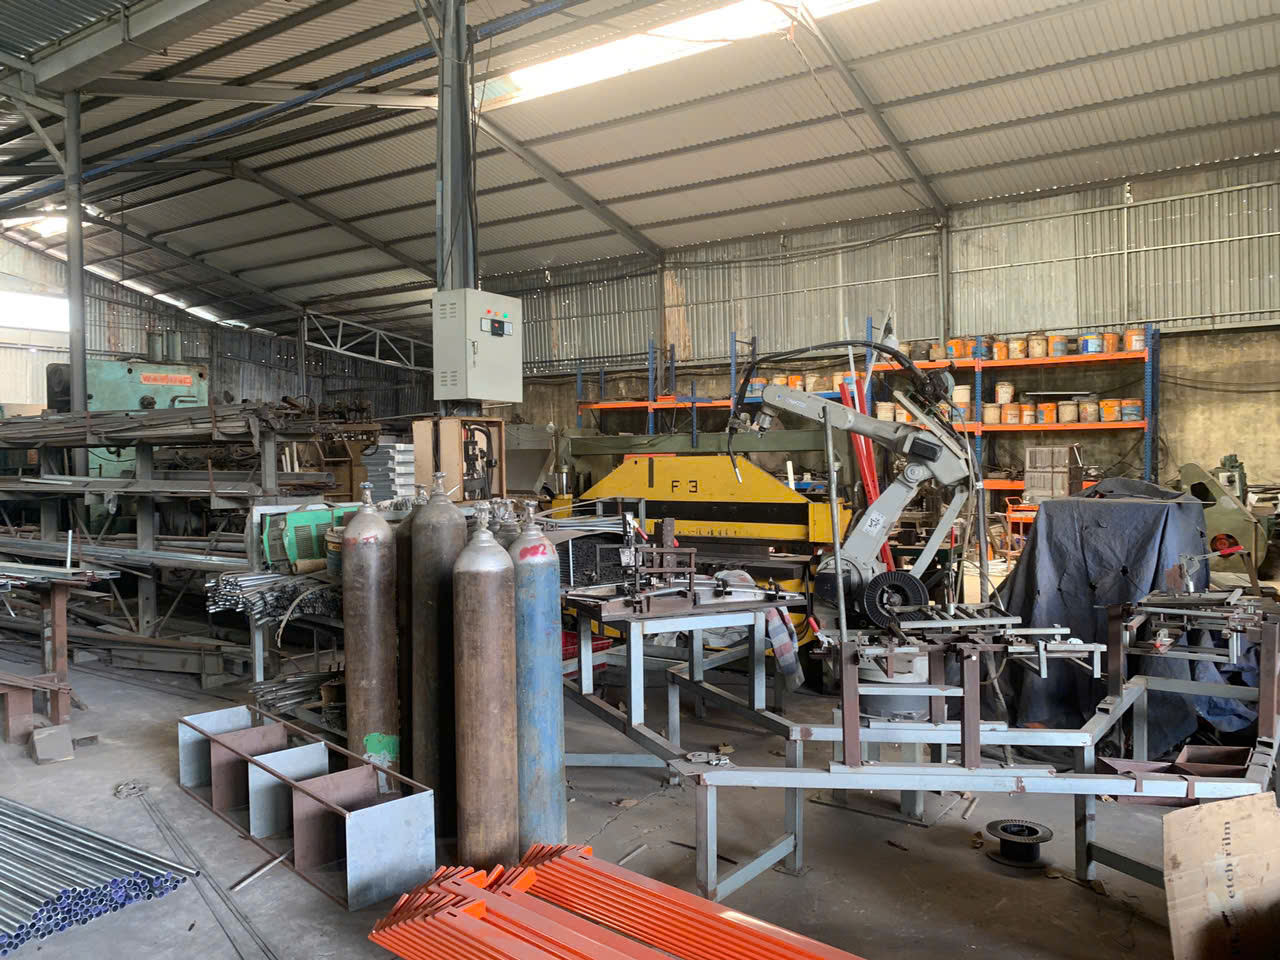
Look for machinery age, automation level (auto-loading, robotic welding, CNC bending), equipment uptime percentage (target 85%+), and predictive maintenance practices. These metrics directly determine manufacturing throughput and whether a supplier can consistently hit the lead times they promise for your sheet metal fabrication project.
Equipment Uptime and Predictive Maintenance
Uptime percentage is the single most important machinery metric. Equipment Uptime percentage 6 It measures the percentage of scheduled production hours that a machine is actually running. A fiber laser with 95% uptime is fundamentally different from one with 78% uptime. That 17-point gap translates directly into lost production hours — hours your order needed.
Predictive maintenance takes this further. Suppliers who track vibration data, motor temperatures, and cutting head hours can schedule maintenance before a breakdown occurs. Predictive maintenance practices 7 Shops that only do reactive maintenance — fixing machines after they break — will surprise you with delays.
Automation Levels That Matter for Sheet Metal
Not all automation is equal. Here is what to prioritize:
| Process | Manual Setup | Semi-Automated | Fully Automated | Impact on Lead Time |
|---|---|---|---|---|
| Sheet loading/unloading | Operator lifts sheets manually | Vacuum lifter assist | Tower storage with auto-feed | Reduces handling time by 40–60% |
| Laser/plasma cutting | Manual nesting, manual start | Auto-nesting software | Lights-out cutting capability | Enables 24-hour production runs |
| CNC bending | Manual back-gauge setup per part | Stored programs, quick tool change | Robotic press brake cell | Cuts setup time from 30 min to 3 min |
| Welding | Stick/MIG by hand | Fixture-assisted MIG/TIG | Robotic MIG/TIG cells | Improves consistency and speed by 50%+ |
| Quality inspection | Manual caliper/gauge checks | CMM spot checks | In-line vision or CMM systems | Catches defects before they cause rework |
How Machine Age Affects Your Delivery
Older machines break down more often. They run slower. Their tolerances drift. When we evaluate a supplier's equipment list, we note the year of manufacture and the brand. A 2018 Trumpf fiber laser is a different conversation than a 2008 Chinese CO2 laser. Both can cut steel. But only one can do it reliably at the speed your delivery date requires.
Ask for the supplier's equipment list with model numbers, years, and maintenance logs. If they hesitate, that is information in itself. Bottleneck identification often starts at the machine level — one slow or unreliable machine in a multi-step process can delay the entire job.
The Role of Digital Integration
Modern sheet metal shops connect their ERP system to the shop floor. Digital Integration 8 Production scheduling happens in real time. The status of your order — whether it is in cutting, bending, welding, or finishing — is visible at any moment. This digital thread integration reduces communication lag and lets you catch delays early, before they become crises. Shops without this visibility often rely on memory and whiteboards, which is where orders fall through the cracks.
How do I verify if a factory has the skilled labor capacity to handle my custom fabrication volume without delays?
One of our U.S. clients once lost three weeks because a supplier's best TIG welder quit — and nobody else on the floor could weld stainless to the required standard.
Verify skilled labor capacity by reviewing the supplier's workforce skill matrix, cross-training depth, welder certifications, employee retention rate, and the ratio of skilled operators to total headcount. A factory where fewer than two people can perform each critical operation is a single point of failure for your delivery schedule.
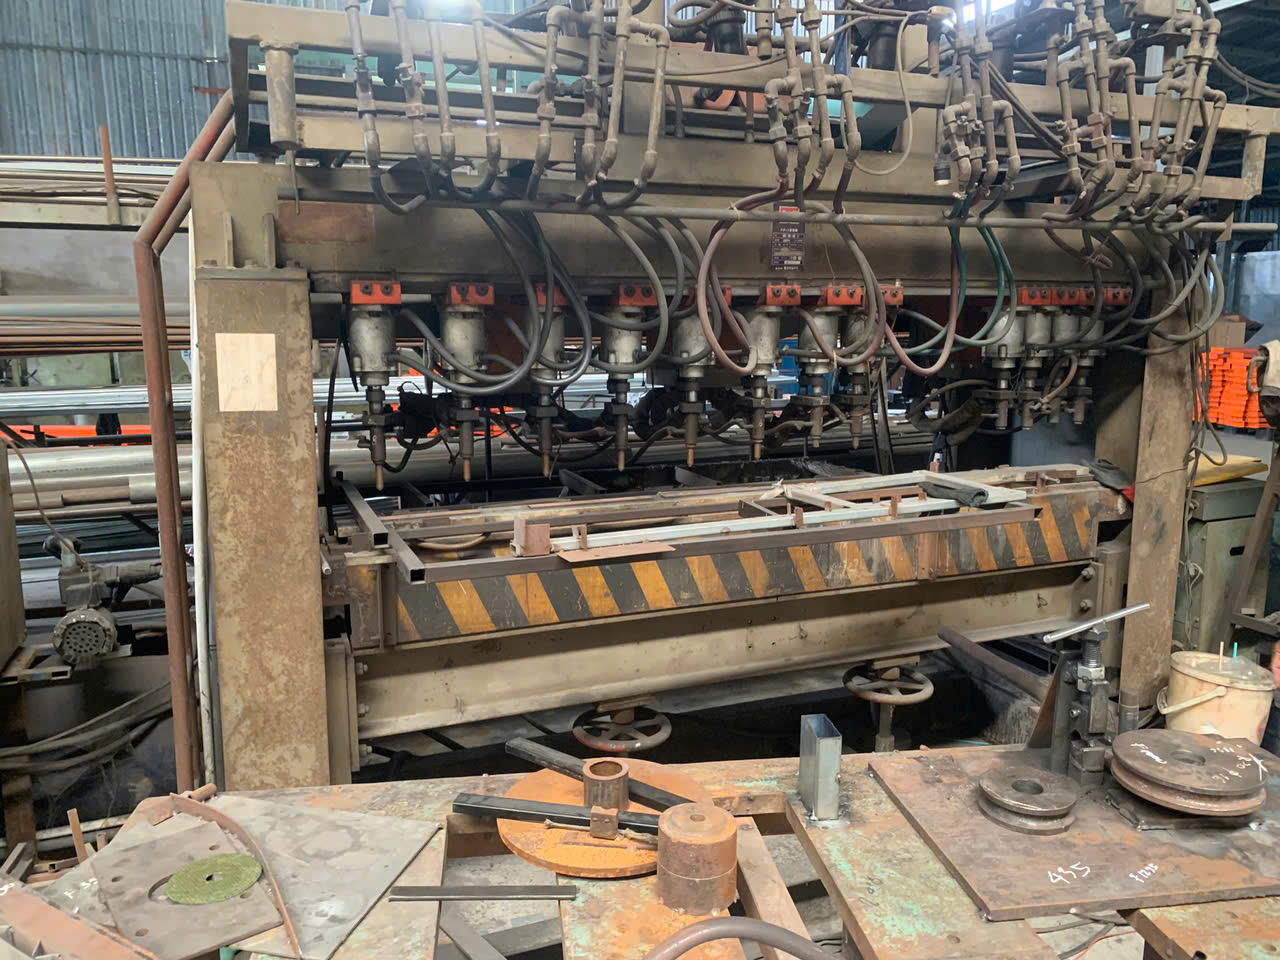
The Workforce Skill Matrix
A skill matrix is a simple grid. Workforce Skill Matrix 9 It lists every critical operation on one axis and every worker on the other. Each cell shows the worker's proficiency level — typically rated from 1 (trainee) to 4 (can train others). This document tells you more about a factory's true capacity than any machine list.
When our China and Vietnam teams conduct supplier audits, we always ask for this matrix. If a factory cannot produce one, they have not formally assessed their labor depth. That is a risk.
Cross-Training Depth
Cross-training is the insurance policy against labor bottlenecks. If only one operator can run the press brake, and that person calls in sick, your bending operation stops. If three people can run it, the work continues.
Here is what adequate cross-training looks like for a sheet metal fabrication shop handling custom parts:
| Critical Operation | Minimum Trained Operators | Ideal Cross-Training Depth | Risk if Understaffed |
|---|---|---|---|
| CNC laser cutting | 2 | 3–4 | Cutting queue stalls; all downstream work stops |
| CNC press brake (bending) | 2 | 3–4 | Parts wait for bending; assembly delayed |
| TIG/MIG welding (certified) | 3 | 5+ | Welding becomes the bottleneck for all assemblies |
| Surface finishing (powder coat, sandblast) | 2 | 3 | Final processing delayed; shipment missed |
| Quality inspection (CMM, first article) | 2 | 3 | Parts cannot be released; shipment held |
| Programming (CAM/nesting) | 1 | 2–3 | No new jobs can enter production |
Employee Retention and Turnover
High turnover destroys capacity. Training a press brake operator takes months. Training a skilled welder takes years. When turnover exceeds 15–20% annually in a fabrication shop, the factory is constantly in training mode. Quality control systems suffer because new workers make more mistakes. Rework increases. Lead times stretch.
Ask the supplier for their annual turnover rate. Ask how long their most experienced operators have been with the company. These are not intrusive questions — they are standard vendor performance management inquiries that any serious sourcing professional should make.
Certification and Qualification Records
For welding-intensive sheet metal work — like the complex angular mounting brackets with visible weld marks that we regularly source — ask for welder qualification records. AWS D1.1 10 or equivalent certifications matter. Qualified welders produce fewer defects. Fewer defects mean less rework. Less rework means your order ships on time.
Inventory management of skills is just as important as inventory management of materials. A factory that tracks both is a factory that can handle volume without surprises.
Which historical on-time delivery KPIs should I request to minimize my risk when sourcing from a new partner?
Before we onboard any new sheet metal supplier into our network, our team requests six months of delivery data. The numbers never lie — and they often contradict the sales pitch.
Request the supplier's On-Time Delivery (OTD) rate, On-Time In Full (OTIF) rate, late delivery frequency, average days late, schedule stability (date-change frequency), and Euro/Dollar Days metric. These KPIs, reviewed as 3-month and 12-month rolling averages, give you a data-driven view of whether a supplier can reliably deliver your sheet metal fabrication orders.

OTD Rate: The Baseline Metric
On-Time Delivery rate is calculated as (On-Time Deliveries ÷ Total Deliveries) × 100. The industry benchmark for sheet metal fabrication is 95–99%. Any supplier below 90% is a consistent risk. But OTD alone is not enough. It treats every order equally — a $500 bracket and a $50,000 assembly carry the same weight.
OTIF: The More Complete Picture
OTIF — On-Time In Full — adds a quantity dimension. A delivery is only counted as "on-time in full" if every line item arrives complete and on the promised date. For complex sheet metal assemblies where missing components halt your production, OTIF is a more meaningful metric than OTD alone.
In our experience managing supply chains for U.S. clients, we have seen orders arrive "on time" but with 80% of the quantity. That partial delivery still stops the client's assembly line. OTIF catches this. OTD does not.
The Euro/Dollar Days Metric
This is a sophisticated metric that multiplies the dollar value of a late order by the number of days it was late. It prioritizes critical delays over minor ones.
Example calculation:
- Order A: $200,000 value, 5 days late → $1,000,000 Dollar Days
- Order B: $5,000 value, 2 days late → $10,000 Dollar Days
Order A is clearly the bigger problem, even though Order B might also register as "late" in a flat OTD calculation. When negotiating capacity allocation with a supplier, this metric helps you argue for priority on high-value jobs.
Schedule Stability and Late Delivery Frequency
Schedule stability tracks how often a supplier changes the confirmed ship date after accepting your purchase order. One date change might be acceptable. Three or four changes on the same order signals poor production scheduling or chronic overcapacity.
Late delivery frequency counts how many individual orders miss their date, regardless of the OTD percentage. A supplier with 94% OTD might sound acceptable — until you realize that means 6 out of every 100 orders are late. If you place 20 orders per quarter, that is more than one late shipment every quarter.
Rolling Averages vs. Snapshot Data
Always ask for rolling averages — 3-month and 12-month trends. A single month can be skewed by one large or one problematic order. Rolling averages smooth out noise and show you the real trend. A supplier whose OTD is trending downward over 12 months is a supplier losing control of their capacity, even if last month's number looked fine.
What to Request: A Summary Checklist
| KPI | What It Measures | Target Benchmark | Why It Matters for Sheet Metal |
|---|---|---|---|
| OTD Rate | % of orders delivered on or before promised date | 95–99% | Baseline delivery reliability |
| OTIF Rate | % of orders delivered on time AND in full quantity | 93–97% | Catches partial shipments that halt assembly |
| Late Delivery Frequency | Number of late orders per period | Fewer than 5% of total orders | Shows consistency, not just averages |
| Average Days Late | Mean delay duration for late orders | Under 3 days | Measures severity of delays |
| Schedule Stability | Number of date changes per order after PO acceptance | Fewer than 1 change per order | Indicates planning and capacity discipline |
| Dollar Days | (Order value) × (Days late) | Trending downward | Prioritizes high-impact delays |
| Rework Rate | % of orders requiring rework before shipment | Below 3% | Leading indicator of capacity strain |
| Overtime % | Overtime hours as % of total labor hours | Below 15% | Leading indicator of overload |
Supply chain resilience is not built on hope. It is built on data. When you ask a new supplier for these KPIs and they can produce them quickly, that tells you they already manage their operations by the numbers. When they cannot, you are their guinea pig — and lead time reduction will be your problem, not theirs.
The Internal Side of the Equation
Here is something most sourcing articles will not tell you: your own internal cycle times affect supplier capacity. If your team takes 10 days to approve a drawing revision and 5 days to issue the PO, you have consumed 15 days of the lead time before the supplier even starts. Supplier evaluation must include a mirror. Optimize your own goods receipt cycle time and PO processing speed, and you give your supplier more room to deliver on time.
Conclusion
Supplier capacity metrics for sheet metal fabrication are your first line of defense against delivery delays. Track utilization, machinery uptime, labor depth, and historical KPIs — then hold your own internal processes to the same standard. To avoid common pitfalls and misconceptions in sheet metal fabrication procurement, make sure every metric you track is tied to a concrete action plan, not just a dashboard number.
Frequently Asked Questions
How can I evaluate a supplier's current production utilization to ensure my sheet metal order isn't sidelined?
A lesson we learned early in our Vietnam office: a supplier quoting a short lead time while running at 95% utilization is handing you a promise they cannot keep.
What specific machinery and automation metrics should I look for to guarantee my project meets its lead time?
During a recent supplier audit in Vietnam, we found a shop quoting 10-day lead times on laser-cut parts — but their only laser was a 15-year-old CO2 unit with no automated sheet loading.
How do I verify if a factory has the skilled labor capacity to handle my custom fabrication volume without delays?
One of our U.S. clients once lost three weeks because a supplier's best TIG welder quit — and nobody else on the floor could weld stainless to the required standard.
Footnotes
1. Defines the core manufacturing process discussed in the article. ↩︎
2. Defines a key metric for delivery performance in supply chains. ↩︎
3. Details a critical metric for assessing future workload and capacity. ↩︎
4. Explains the process of predicting future customer demand in supply chains. ↩︎
5. Explains how to measure factory output relative to capacity. ↩︎
6. Defines a crucial metric for machine availability and reliability. ↩︎
7. Describes a proactive approach to equipment maintenance. ↩︎
8. Explains the importance of connected systems for real-time production visibility. ↩︎
9. Describes a tool for assessing and managing employee capabilities. ↩︎
10. Specifies a key industry standard for welding quality. ↩︎